CHAPTER 15
Printing a Drawing
With today's equipment, there is no difference between printing and plotting. Printing used to refer to smaller-format printers, and plotting referred to pen plotters, most of which were designed for plotting large sheets. But the terms are now used interchangeably. Pen plotters have been virtually replaced by large-format inkjet or laser plotters with a few additional settings not commonly found on standard printing devices. Otherwise, as far as Autodesk® AutoCAD® software is concerned, the differences between plotters and laser, inkjet, or electrostatic printers are minimal. In this book, printing and plotting have the same meaning.
Although you may have a variety of small-format and large-format plotters attached to your computer, this chapter assumes as a standard the DWFx ePlot (XPS Compatible).pc3 plotter. Since each plotter is slightly different, standardizing on this one virtual device will ensure that you're able to follow each of the steps as they are discussed in this chapter.
You will print the layouts from the A-100.dwg, A-200.dwg, and C-100.dwg drawings from a layout at its default Ledger 11″×17″ (297 mm×420 mm) A3 sheet and at 24″×36″ (594 mm×841 mm) A1 sheet sizes.
In addition to ensuring your ability to plot to each of these formats, plotting to an electronic format similar to DWF or DWFX is not all that uncommon in industry. There is often a need to keep an electronic record of each submittal of a project, and the DWF format is one of the ways this is possible. I'll discuss some other electronic formats later in this chapter, but for now it's more important to know that the purpose of using a DWF plotter is to give you the basic principles for plotting, regardless of whether you have access to a printer or plotter.
In this chapter, you will learn to
- Set up a drawing to be printed with page setups
- Assign lineweights to drawing layers, and manage plot styles
- Configure and preview a print
- Publish multiple layouts, and use Sheet Set Manager
Using the Plot Dialog Box
The job of getting your AutoCAD file to plot (electronically or as a hard copy) can be broken down into five tasks. You'll need to tell AutoCAD the following:
- The printing device you'll use
- The lineweight assigned to each object in your drawing
- The portion of the drawing you're printing
- The sheet size to which you're printing
- The scale, orientation, and placement of the print on the sheet
You handle most of these tasks in the Plot dialog box:
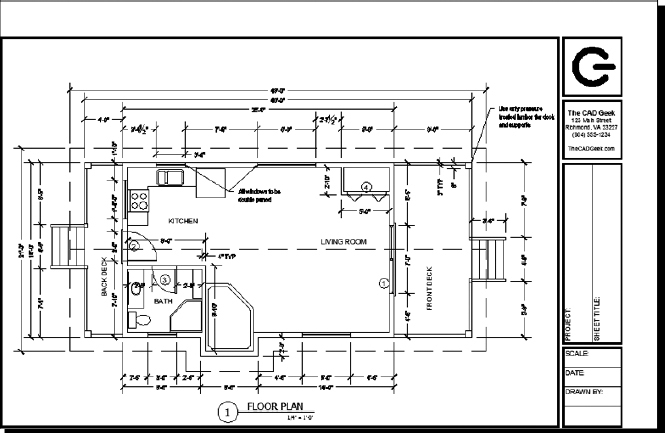
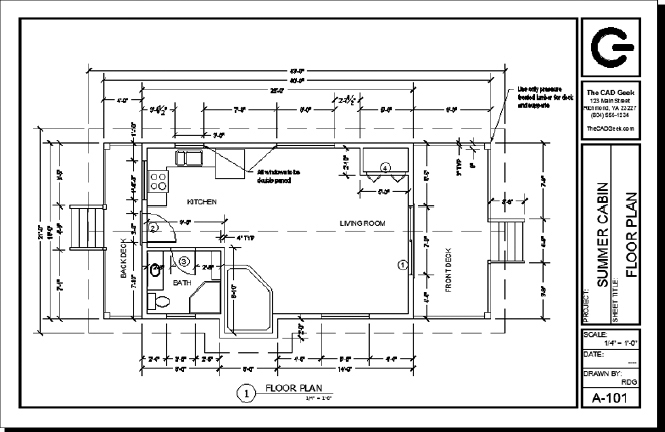
- Open I-A-100.dwg (M-A-100.dwg), shown in Figure 15.1. Click the A-101 layout to make it active and ensure that you are in paper space.
FIGURE 15.1 The A-101 layout showing the floor plan
 Click the Output tab, and then click the Plot button on the Plot panel to open the Plot dialog box.
The title bar includes the name of the layout because, in this case, you're printing a drawing from paper space (layout). If you print from model space, the title bar displays the word Model. This dialog box is similar to the Page Setup dialog box you worked with in Chapter 14, “Using Layouts to Set Up a Print,” when you were setting up layouts (see Figure 15.2).
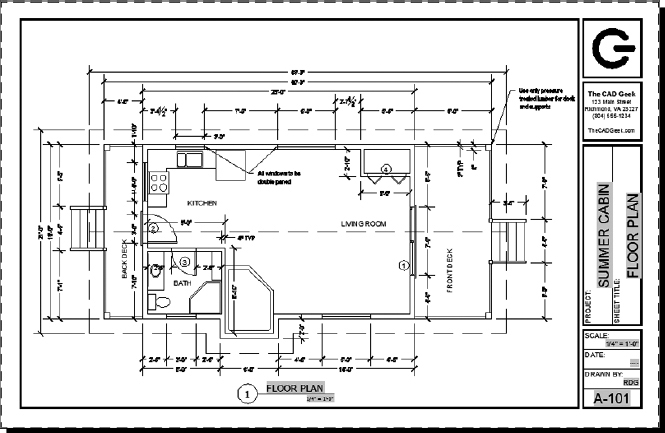
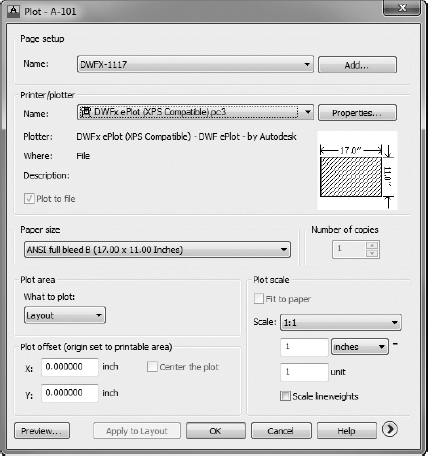
FIGURE 15.2 The Plot dialog box
You can also open the Plot dialog box by pressing Ctrl+P or by entering PLOT![]() or PRINT
or PRINT![]() .
.
First you'll take a quick tour of the Plot dialog box. Then you'll start setting up to print.
You'll see seven groups of settings on this unexpanded version of the dialog box. Some of the buttons and boxes won't be activated. I'll mention others only in passing, because their functions are for more-advanced techniques than those covered in this book. These functions are available when in model space as well.
If you receive a Layer Notification Warning dialog box or a notification bubble stating that you have unreconciled layers, you should address the situation before plotting the drawing. Unreconciled layers are new layers that have been added since the last time the drawing was saved, the PLOT command was used, or a layer state was saved. The purpose of the warning or notification is to signal you to look at these new layers and determine whether any action is required. Follow these steps:
- Open the Layer Properties Manager, and click Unreconciled New Layers in the left pane to display the list in the right pane.
- Select all the layers shown, right-click, and choose Reconcile Layer from the context menu.
- Close the Layer Properties Manager.
All layers are now reconciled, and the warnings should discontinue until you add any new layers.
Printer/Plotter
In the Printer/Plotter group, the Name drop-down list contains the various printing devices to which AutoCAD has been configured. The current one, the DWFx ePlot (XPS Compatible).pc3, is displayed in Figure 15.2. Just below the list, the name of the driver and the assigned port or network path and asset name are displayed for the selected printer.
Clicking the Properties button to the right opens the Plotter Configuration Editor dialog box, which has three tabs of data specific to the current printer. You must have a default printer assigned for the Properties button to be available. Most of this will already be set up by your Windows operating system.
Back in the Plot dialog box, you'll notice that the Plot To File check box is selected and grayed out. This is because the DWF plotter you have selected is a virtual device, meaning that it cannot create a physical print on a piece of paper and can create only a file. In this case, a DWFX file will be created, which can then be viewed and plotted to an actual piece of paper by using the free Autodesk® Design Review program or mobile application if you want.
Autodesk® Design Review is included in the default installation of AutoCAD, and it may also be downloaded from the Autodesk website (www.autodesk.com/designreview) for free. A mobile version is also available for free from the Apple App Store and Google Play.
When a physical device, such as a printer attached to your computer, is selected in the Plot dialog box, the Plot To File check box will not be grayed out. Selecting it will direct AutoCAD to make and save the print as a PLT file, rather than sending it to the selected printer. Many reproduction service bureaus prefer to receive electronic formats such as PLT, DWF, DWFX, and even PDF files to print, rather than AutoCAD DWG files. Unlike DWG files, the previously mentioned electronic formats do not require you to send all of the support and externally referenced files (fonts, images, external references, and so on) for the drawing to plot correctly.
Paper Size and Number of Copies
In the Paper Size group, the drop-down list contains paper sizes that the current plot device can recognize. To the right is the Number Of Copies group, which is grayed out when plotting to a file; this option allows you to specify how many copies of a drawing to plot. When you have a large run of pages to print, it's prudent to print a single copy of each, check for errors or omissions, and then print multiple copies of each page.
Plot Area
In the Plot Area group, a drop-down list contains six options for specifying which portions of your drawing to print: Display, Extents, Limits, View, Window, and Layout. You have already decided which layers will be visible when the print is made by freezing the layers in each viewport whose objects you don't want to print. Now you must decide how to designate the area of the drawing to be printed. As you go through the options, it's useful to think about the choices with regard to two printing possibilities: printing the whole drawing and printing just the floor plan. Using layouts removes much of the guesswork from the plotting process.
To illustrate how these options work, we'll make a couple of assumptions. First, the 1:1 Scale option is selected in the Plot Scale area so that AutoCAD will try to print the drawing at full scale. Second, the drawing will be in landscape orientation.
- In the Plot Scale group, expand the Scale drop-down list and select 1:1.
- Verify that the Plot Scale Units drop-down list is set to inches (mm), as shown in Figure 15.2 earlier.
 NOTE You'll learn more about plot scale in the “Plot Scale” section later in this chapter.
  To expand the dialog box, click the right-pointing arrow in the lower-right corner.
 Make sure Landscape is selected in the Drawing Orientation group, and then click the left-pointing arrow to collapse the expansion.
The Display Option
The Display option on the What To Plot drop-down list prints whatever is currently on the screen, including the blank area around the drawing.
- With the sheet in landscape orientation and with the origin in the lower-left corner of the paper space area, choose the Display option.
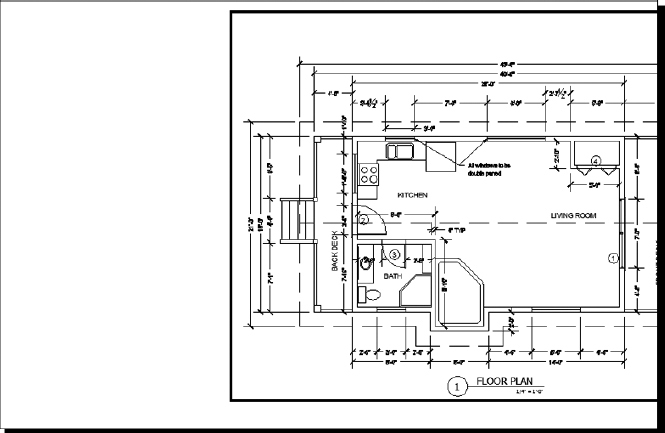
- Click the Preview button in the lower-left corner of the Plot dialog box. The plot preview will look like Figure 15.3.
FIGURE 15.3 The cabin drawing printed to Display
The drawing doesn't fit well on the sheet with this option. The drawing is oriented and sized correctly, but with the beginning of the plot area in the lower-right corner of the paper space area, it's printed above and to the right of where it should be. A considerable amount of clipping has also occurred, and much of the drawing is not displayed. Printing to Display is a quick method of plotting everything that is shown in the layout but is rarely the best solution when plotting in model space.
- Right-click and choose Exit, or press the Esc key, to exit the preview mode.
The Extents Option
When you select the Extents option, AutoCAD tries to fill the sheet with all visible objects in the drawing.
- Choose the Extents option.
- Click the Preview button; the results will look similar to Figure 15.4.
FIGURE 15.4 The drawing printed to Extents
This is more acceptable than the Display option, but it's not quite right. The border is off-center because the extents of the drawing begin at the lower-left corner white area in paper space that represents the actual paper. This is a good method to use if the border is not plotted or if there is no border at all. Be aware that if any objects exist in paper space to the left or below the drawing area, they will shift the beginning of the extents and reduce the amount of the actual drawing area that is visible.
- Press the Esc key to return to the Plot dialog box.
The Limits Option
Do you remember the drawing limits for the cabin drawing that you set in Chapter 3, “Setting Up a Drawing”? As a refresher, perform the following steps:
- Open the floor plan model file, I14A-FPLAYO.dwg (M14A-FPLAYO.dwg), from the preceding chapter or from the Chapter 15 download.
 Click the Quick View Layouts button in the status bar to switch to model space.
Plotting to Limits is not available in a layout.
- Zoom in to the floor plan, start the PLOT command again, and assign the same DWFx plotter.
- With the plotter selected, choose Limits from the What To Plot drop-down list.
-
In the Plot Scale section, click the Fit To Paper option.
Plotting at 1:1 in model space would result in only a miniscule portion of the vast drawing area actually getting plotted.
When you print to Limits, AutoCAD prints only what lies within the limits, and it pushes what's within the limits to the corner that is the origin of the print.
- Click the right-facing arrow in the lower-right corner, and make sure that Landscape is selected in the Drawing Orientation group.
- Click the Preview button in the lower-left corner (see Figure 15.5).
This print won't work here because the limits don't cover the entire drawing, and the title block has already been moved into paper space. Printing to Limits can be a good tool for setting up a print, but you'll usually reset the limits from their original defining coordinates to new ones for the actual print.
- Right-click and choose Exit from the context menu to exit the preview.
![]() NOTE If you are in a layout of a DWG file, the Limits option is replaced by Layout in the What To Plot drop-down list in the Plot Area section.
NOTE If you are in a layout of a DWG file, the Limits option is replaced by Layout in the What To Plot drop-down list in the Plot Area section.
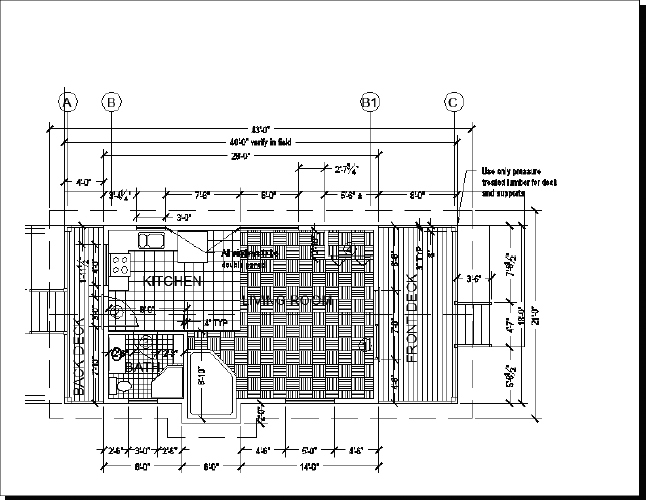
FIGURE 15.5 A preview of the drawing printed to Limits
The View Option
When printing to View, you tell AutoCAD to print a previously defined view that was saved with the drawing. When plotting from model space, the View option isn't displayed in the What To Plot drop-down list if you haven't defined and saved any views yet. The View option is never available when plotting from paper space (layouts).
- Open the I14A-FPLAYO.dwg (M14A-FPLAYO.dwg) from the Chapter 15 download, or update the named views for your elevations, and use the floor plan model file you created in the preceding chapter.
NOTE Because you moved your elevations in an earlier chapter, you may need to redefine your named views for this exercise to work. The named views stored in the I14A-FPLAYO.dwg (M14A-FPLAYO.dwg) file in the Chapter 15 download have been updated.
- Start the PLOT command once again, expand the What To Plot drop-down list, and click View.
A new drop-down list appears to the right.
- Expand the new drop-down list, and choose East_elev.
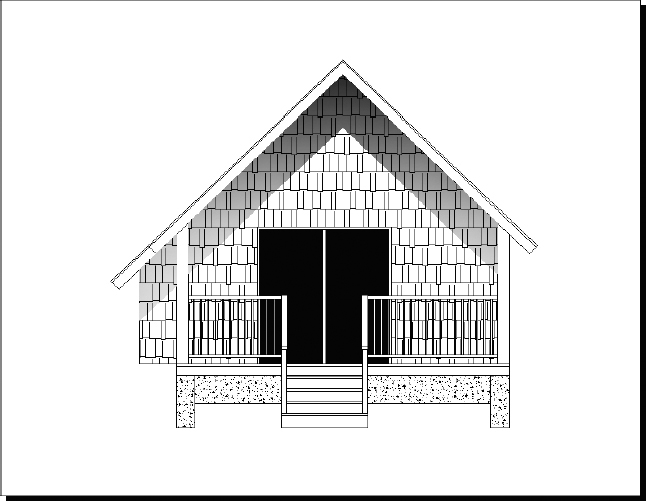
- Click the Preview button, and the preview should look similar to Figure 15.6.
FIGURE 15.6 Plotting model space to a named view (East_elev)
A view is always taken from the same fixed location. In the preceding chapter, you moved several components of the cabin drawing and might need to update the named views to reflect this. The View option for What To Plot is a valuable tool for setting up partial prints of a drawing.
- Press Esc to exit the preview, and then click Cancel to close the Plot dialog box.
The Window Option
Using a window to define the area of a plot is the most flexible of the methods described so far. It's like using a zoom window in the drawing. When you select this option, you're returned to your drawing, where you'll make a window around the area you want to print. When you return to the Plot dialog box, a Window button appears in the right side of the Plot Area section (see Figure 15.7), in case you need to redefine the window.
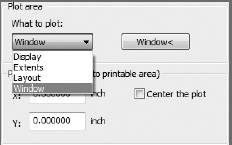
FIGURE 15.7 The Plot Area group in the Plot dialog box with its drop-down list open and the Window button displayed next to it
AutoCAD will print only what is in the window you made, regardless of how it fits on the sheet. This method is similar to the View method just discussed. The difference is that the View method prints a previously defined view (one that was possibly defined by a window but could also be defined in other ways), and the Window method prints what is included in a window that you define as you're setting up the plot. The window used by the Window method can't be saved and recalled at a later time.
The Layout Option
One of the greatest benefits of layouts is the ability to see on the screen exactly what will be printed. This is the purpose of the Layout option in the Plot dialog box. When printed at a scale of 1:1 and using the paper size designated in the Page Setup dialog box, the printed drawing will look as it does in the layout. The layout option is discussed further in the “Printing a Drawing Using Layouts” section later in this chapter. Whenever you're not simply generating a quick plot of an area inside model space, the layout option is the recommended way to plot drawing sheets.
Plot Scale
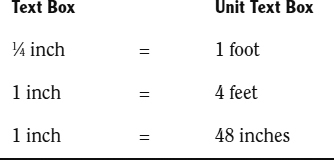
On the right side of the Plot dialog box is the Plot Scale group, where you control the scale of the plot. When the Fit To Paper check box is selected, AutoCAD takes whatever area you have chosen to print and automatically scales it so that it will fit on the selected page size. When this option is unchecked, the Scale drop-down list becomes available. This list contains several preset scales to choose from plus a Custom option and any scales that you've added. Some of the scales in the list are displayed as pure ratios, such as 1:50. Others are shown in their standard format, such as ![]() . Below the drop-down list is a pair of text boxes for setting up a custom scale. When you choose a preset scale, these text boxes display the true ratio of that scale.
. Below the drop-down list is a pair of text boxes for setting up a custom scale. When you choose a preset scale, these text boxes display the true ratio of that scale.
To set up a custom scale, do the following:
- Choose the units you're using in your drawing (inches or millimeters).
- Enter a plotted distance in the text box, just below the Scale drop-down list.
- In the Units text box below that, enter the number of units in your drawing that will be represented by the distance you entered in the text box above.
The inches (or millimeters) distance is an actual distance on the plotted drawing, and the units distance is the distance the plotted units represent. For
 scale (
 ), you can enter several combinations:
AutoCAD can plot to various raster image formats such as JPEG. If one of these raster format plotters is selected, the Plot Scale area of the Plot dialog box will use pixels as the unit type.
Layouts are almost always plotted at a scale of 1:1. Half-size sets are common in many design offices; these sets can be made by changing the Plot Scale in the Plot dialog box. I'll come back to these and other scale issues as you prepare a drawing for printing.
Plot Offset and Plot Options
Below Plot Area is the Plot Offset (Origin Set To Printable Area) group, which contains two text boxes and a check box. Select the Center The Plot check box to center the plot on the printed sheet. If this check box isn't selected, by default AutoCAD makes the lower-left corner of your drawing's printable area the origin for that drawing sheet. By changing the settings in the X and Y text boxes, you can move the drawing horizontally or vertically to fit on the page as you want. When the Center The Plot check box is selected, the X and Y text boxes are disabled for input but display the offset distance from the lower-left corner of the sheet that was necessary to center the drawing.
By using the X and Y settings in the Plot Offset group, you can make one margin wider for a binding (see the top of Figure 15.8). To center your drawing on the page, select the Center The Plot check box (see the bottom of Figure 15.8). If layouts are set up and being used for printing, they determine this setting, and the Center The Plot check box is unavailable.
Setting the material to be printed accurately on the page will be a result of trial and error and getting to know your printer. I'll return to this topic shortly when you learn how to get ready to print. If you work in a corporate environment, you should consult your company's CAD standards to see which settings your company uses for plotting.
The Expanded Plot Dialog Box
If the Plot dialog box hasn't already been expanded, click the right-facing arrow in the lower-right corner to expand it to include four additional groups in a stack on the right. For now, you're primarily interested in the group on the bottom, Drawing Orientation (see Figure 15.9).
Drawing Orientation The settings in this group are self-explanatory. The radio buttons serve as a toggle between the portrait and landscape orientation, and the Plot Upside-Down check box is an on/off toggle. The Plot Upside-Down setting is sometimes used as a way of tricking some plotters to size the binding edge of a drawing correctly. Because items such as Object Linking and Embedding (OLE) objects cannot plot upside-down, using Plot Upside-Down is typically discouraged. The preferred alternative is the X and Y Plot Offset settings in the main part of the Plot dialog box.
Plot Options This group has eight check boxes that define how the plot is executed. You'll explore many of these settings in more detail throughout this chapter. Here's a brief description of what each setting does:
Plot In Background When this is checked, plots will process behind the scenes, allowing you to continue working in your drawing. It may be necessary to disable this setting if you're plotting larger, more complicated drawings that take more system memory to process.
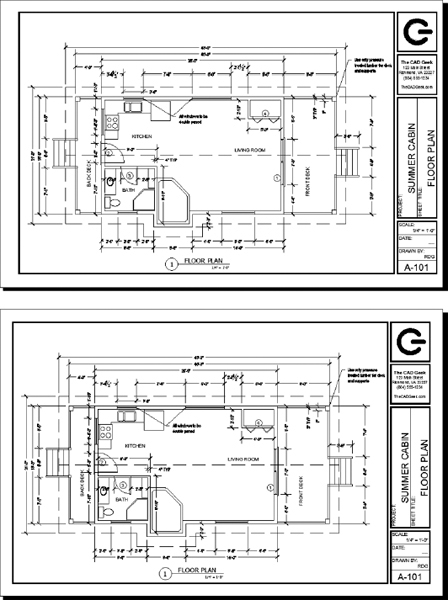
FIGURE 15.8 A print with its X offset set to allow for a binding (top) and with the drawing centered (bottom)
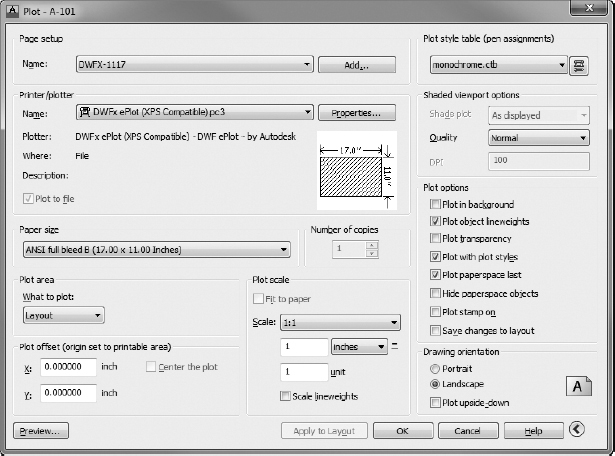
FIGURE 15.9 The expanded Plot dialog box
Plot Object Lineweights Instead of using a plot-style table, the Lineweight property assigned to layers and objects throughout the drawing may be used to provide visual separation throughout your drawing with this setting turned on.
Plot Transparency Similar to enabling or disabling the Transparency drawing mode from the status bar, this check box toggles the same property when plotting. You should keep this unchecked unless you're specifically using transparency in your drawing, because it requires more memory to process even if you don't have transparent objects in your drawing.
Plot With Plot Styles This setting enables the use of plot-style tables instead of the assigned Lineweight property. Consequently, the lineweight will be determined based on object color when using CTB pen tables and by plot styles when using STB pen tables.
Plot Paperspace Last Paper space is another name for layout tabs, so this setting first plots anything contained within a viewport and then plots objects drawn directly on the Layout tab last.
Hide Paperspace Objects When working with 3D models, this controls whether the HIDE command is applied to paper space objects.
Plot Stamp On Plot stamps are used to include information such as plot date, time, and the name of the person who created the plot. Enabling this option will append this information per your specification to your drawings.
Save Changes To Layout Changes made within the PLOT command will also apply to the page setup for that layout.
Shaded Viewport Options This group has settings to control the plot for renderings and shaded views, and it is covered in later chapters. On-screen previews may differ from hard-copy plots if your graphics card does not support hardware acceleration.
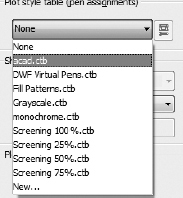
Plot Style Table (Pen Assignments) This is where the color and weight of linetypes are defined. Plot styles and pen assignments are discussed in the next section of this chapter.
You have taken a quick tour of the Plot dialog box, and you still have the I-A-100.dwg (M-A-100.dwg), I-A-200.dwg (M-A-200.dwg), and I-C-100.dwg (M-C-100.dwg) drawings to print. As you set up the prints a little later in this chapter, refer to this section for an explanation of the tools, if necessary.
Applying Plot-Style Tables
Because of its cost, color plotting is typically reserved for exhibit drawings and other presentation scenarios. Chances are, most of the drawings you'll create will be integrated into a larger construction document set that's prepared in black-and-white. Consider the layers inside your drawing for a moment: each layer has a color assigned to it, which is then used to display the objects drawn on that layer. Without instruction, AutoCAD will screen the lighter colors in your drawing when plotted in black-and-white. Typically, this is not the desired result, so Plot Style Tables give you control over the way AutoCAD interprets color when plotting.
As you'll learn in this section, plot-style tables do more than determine the color that objects plot when a drawing is plotted. These tables can also control how lineweights are assigned and whether screening is applied. Using plot-style tables to control color, screening, and lineweight is incredibly popular among industry professionals. In this chapter, the monochrome.stb table will be used. This table uses the Lineweight layer property to determine the thickness of plotted lines. You'll learn more about the Lineweight layer property later in this chapter.
Introducing Plot-Style Table Files
A plot style is a group of settings that is assigned to a layer, a color, or an object. It determines how that layer, color, or object is printed. Plot styles are grouped into plot-style tables that are saved as files on your hard drive. Two kinds of plot styles exist:
Color-Dependent Identified by their .ctb file extension, color-dependent plot-style tables map each of the 255 index colors. Plot styles are determined based on the color of an object.
Named Identified by their .stb file extension, named plot styles let you specify comprehensible names for your plot styles. You can create as many or as few plot styles as you need. Named plot styles are assigned to layers in the same way as are colors.
Leave AutoCAD for a moment, and use Windows Explorer to navigate to the following folder: C:Documents and Settingsyour nameApplication DataAutodeskAutoCAD 2013R19.0enuPlotters (in Windows Vista or Windows 7, go to C:Usersyour nameappdata
oamingAutodeskAutoCAD 2013 r19.0enuplotters). Open the subfolder called Plot Styles; Figure 15.10 shows its contents. Thirteen plot-style table files are already set up. Nine of them are color-dependent plot-style table files, with the extension .ctb; and four are named plot-style table files, with the extension .stb. (If you can't see the .ctb and .stb extensions, choose Tools ![]() Folder Options
Folder Options ![]() View, or in Windows 7 choose Organize
View, or in Windows 7 choose Organize ![]() Folder And Search Options
Folder And Search Options ![]() View, and uncheck Hide Extensions For Known File Types.) Finally, you'll see a shortcut to the Add-A-Plot Style Table Wizard, which you use to set up custom plot-style tables. Close Windows Explorer, and return to AutoCAD.
View, and uncheck Hide Extensions For Known File Types.) Finally, you'll see a shortcut to the Add-A-Plot Style Table Wizard, which you use to set up custom plot-style tables. Close Windows Explorer, and return to AutoCAD.
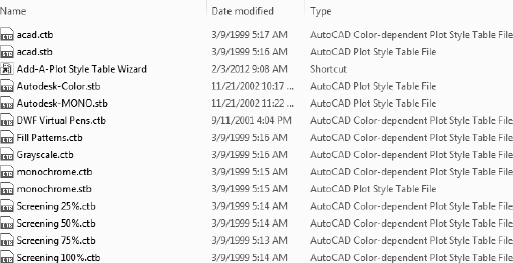
FIGURE 15.10 The contents of the Plot Styles folder
Understanding How Plot-Style Table Files Are Organized
For the AutoCAD LT® program, the plot-style table path is similar but uses an AutoCAD LT 2013 folder and one called R17.0 instead of R19.0.
Plot-style table files are assigned to a drawing and contain all the plot styles needed to control how that drawing is printed. Color-dependent plot styles control printing parameters through color. There are 255 of them in each color-dependent plot-style table, one for each color. Named plot-style tables, on the other hand, have only as many plot styles as are necessary, possibly only two or three. You'll now look at a plot-style table and see how it's organized:
- Start the PLOT command to open the Plot dialog box.
- Expand the dialog box, if necessary, and choose acad.ctb from the Plot Style Table drop-down list in the top-right corner (see Figure 15.11).
FIGURE 15.11 Assigning a color-dependent plot style to the drawing
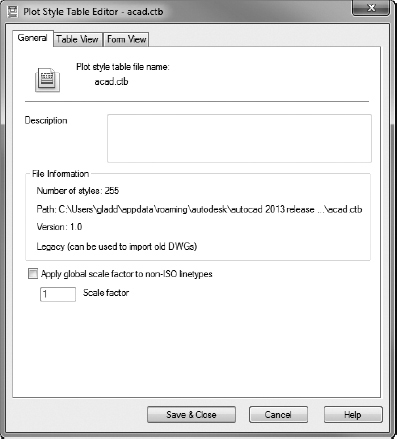
 Click the Edit button next to the drop-down list to open the Plot Style Table Editor dialog box with acad.ctb in its title bar (see Figure 15.12).
This dialog box has three tabs. The General tab displays information and a Description text box for input.
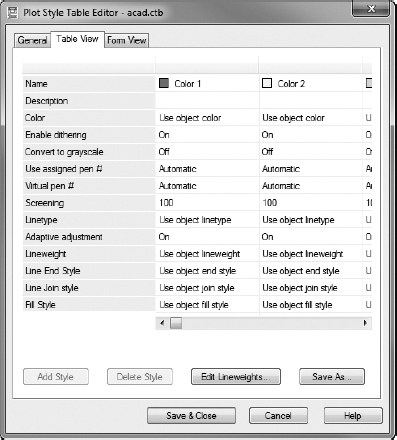
- Click the Table View tab (see Figure 15.13).
Now you see the plot styles across the top and the plot-style proper-ties listed down the left side. This tab organizes the information like a spreadsheet. Use the scroll bar to assure yourself that there are 255 plot styles. Notice that each plot style has 12 properties plus a text box for a description. This tab displays the plot-style information in a way that gives you an overview of the table as a whole.
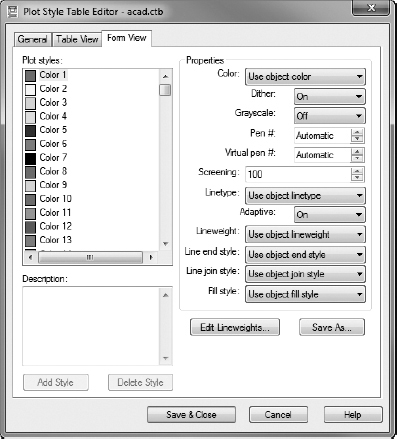
- Click the Form View tab (see Figure 15.14).
FIGURE 15.12 The General tab of the Plot Style Table Editor dialog box for the acad.ctb file
FIGURE 15.13 The Table View tab of the Plot Style Table Editor dialog box for the acad.ctb file
FIGURE 15.14 The Form View tab of the Plot Style Table Editor dialog box for the acad.ctb file
The same information is organized in a slightly different way. Here the plot styles are listed in the box on the left. You can highlight one or more plot styles at a time. The properties of the highlighted styles appear on the right. This view is set up to modify the properties of chosen plot styles. Notice that the first property, Color, has Use Object Color assigned for all plot styles. This means that red objects are plotted in red, blue in blue, and so on. You can override this by expanding the drop-down list and selecting another color.
- Click the Cancel button to exit the Plot Style Table Editor, assign the color-dependent monochrome.ctb to the drawing, and then open the file for editing.
- Click the Table View tab. Now look at the Color property.
All plot styles have the color Black assigned (see Figure 15.15).
- Click Cancel to close the Plot Style Table Editor dialog box, and close the Plot Styles dialog box.
The monochrome.ctb file will print all colors in your drawing as black but won't change the colors in the AutoCAD file. This is the plot-style table you'll use to plot your My Cabin project.
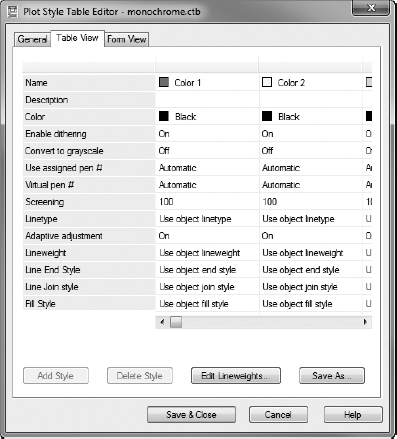
FIGURE 15.15 The Table View tab of the Plot Style Table Editor dialog box for the monochrome.ctb file
Assigning Plot-Style Tables to Drawings
Each drawing can be assigned only one kind of plot-style table file: color-dependent or named. This is determined when the drawing is first created.
![]() NOTE Even though the type of plot style for a new drawing is fixed in the Plot Style Table Settings dialog box, two utility commands let you switch the type of plot style that a drawing can have and assign a different one. They are the CONVERTPSTYLES and CONVERTCTB commands.
NOTE Even though the type of plot style for a new drawing is fixed in the Plot Style Table Settings dialog box, two utility commands let you switch the type of plot style that a drawing can have and assign a different one. They are the CONVERTPSTYLES and CONVERTCTB commands.
Follow these steps:
- Open the Application menu, and click the Options button in the lower-right corner.
This opens the Options dialog box.
- Click the Plot And Publish tab.
- Click the Plot Style Table Settings button near the lower-right corner of the dialog box.
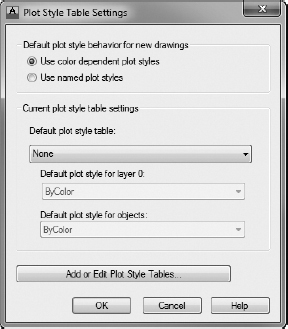
Doing so opens the Plot Style Table Settings dialog box. In the uppermost group are the two radio buttons that control which type of plot style a drawing will accept: color-dependent or named (see Figure 15.16). New drawings will accept only the type of plot style that is selected here.
FIGURE 15.16 The Plot Style Table Settings dialog box
In the Current Plot Style Table Settings group is the Default Plot Style Table drop-down list. Here you can select a plot-style table file (of the type selected by the radio buttons) to be assigned automatically to new drawings. One of the options is None.
- Close the Plot Style Table Settings dialog box. Then close the Options dialog box.
Throughout this book, all the drawings that you created (or downloaded) were set up to use color-dependent plot styles, so you can assign this type of plot style to the drawing. Usually, you do this by assigning a particular plot-style table file to a layout or to model space. To finish the tour and this chapter, you'll assign one of the available plot-style table files to the I-A-100.dwg (M-A-100.dwg), I-A-200.dwg (M-A-200.dwg), and I-C-100.dwg (M-C-100.dwg) drawings and use the Preview option to see the results:
- Make I-A-100.dwg (M-A-100.dwg) the current drawing if it isn't already.
- Click the A-101 layout to make it current.
- Right-click the Quick View Layouts button in the status bar and select Page Setup Manager.
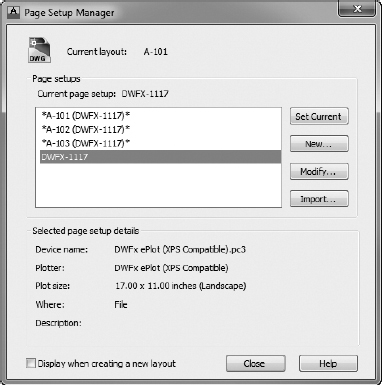
This opens the Page Setup Manager dialog box, shown in Figure 15.17.
FIGURE 15.17 Accessing the DWFX-1117 (DWFX-A3) page setup from the Page Setup Manager dialog box
- Select the DWFX-1117 (DWFX-A3) page setup, and click the Modify button.
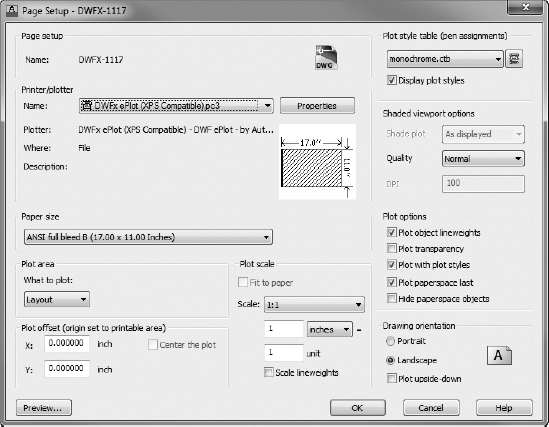
The Page Setup—DWFX-1117 (DWFX-A3) dialog box shown in Figure 15.18 opens after selecting Modify in the Page Setup Manager. This dialog box is nearly identical to the expanded Plot dialog box used with the PLOT command.
- Change the Plot Style Table to monochrome.ctb, and click OK to exit the Page Setup dialog box (see Figure 15.18).
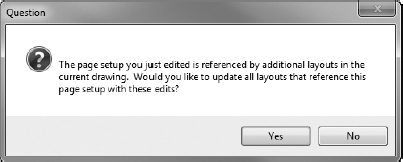
Because you just modified a page setup that was assigned to a layout, the Question dialog box shown in Figure 15.19 opens, asking you how to apply the changes you just made.
- Choose Yes to apply the changes to all of the layouts that reference the DWFX-1117 (DWFX-A3) page setup.
FIGURE 15.18 Modifying the DWFX-1117 (DWFX-A3) page setup to use the monochrome.ctb plot-style table
FIGURE 15.19 The Question dialog box opens when a page setup is applied to multiple layouts.
- Start the PLOT command, and expand the dialog box by using the arrow icon in the lower-right corner if it's not expanded already.
- In the upper-right corner, make sure that monochrome.ctb is displayed in the Plot Style Table drop-down list and then click the Preview button.
AutoCAD replaces the colors used in the drawing with black and displays a preview of what the plotted drawing will look like (see Figure 15.20).
FIGURE 15.20 Preview of the A-101 layout without a plot-style table assigned to it
- Cancel out of the PLOT command, and save the I-A-100.dwg (M-A-100.dwg) file (keeping its name).
You've applied the modified DWFX-1117 (DWFX-A3) page setup to all of the layouts inside the A-100.dwg file, but this change hasn't been applied to the other layouts in your plan set. Rather than duplicating efforts by manually changing the plot-style table in each drawing file, you'll import the modified page setup from A-100.dwg.
- Open the I-A-200.dwg (M-A-200.dwg) file, and then open the Page Setup Manager by right-clicking the Quick View Layouts button on the status bar.
- From Page Setup Manager, click the Import button and browse to the I-A-100.dwg (M-A-100.dwg) file in your Chapter 15 Training Data folder.
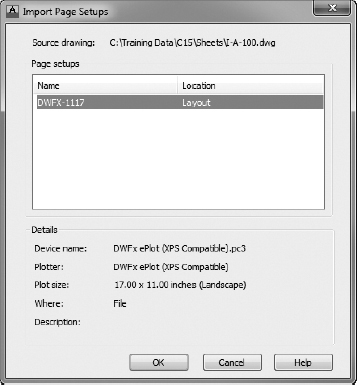
After selecting the I-A-100.dwg (M-A-100.dwg) file, the Import Page Setups dialog box shown in Figure 15.21 opens to list all the page setups saved inside the selected drawing.
- Make sure DWFX-1117 (DWFX-A3) is selected and then click OK.
FIGURE 15.21 Selecting the page setups to import from the Import Page Setups dialog box
The Question dialog box opens to ask: “A layout page setup named DWFX-1117 (DWFX-A3) has already been defined. Would you like to redefine it?”
- Choose Yes to redefine the existing DWFX-1117 (DWFX-A3) page setup.
Another version of the Question dialog box opens, this time reading: “The page setup you just edited is referenced by additional layouts in the current drawing. Would you like to update all layouts that reference this page setup?”
- Choose Yes to apply the changes to the existing layouts in the I-A-200.dwg (M-A-200.dwg) drawing. Close the Page Setup Manager to return to your drawing.
The DWFX-1117 (DWFX-A3) page setup has been updated inside your elevation drawing to include the monochrome.ctb plot-style table change.
- Save the I-A-200.dwg (M-A-200.dwg) file (keeping its existing name), and then repeat steps 1–5 on the I-C-100.dwg (M-C-100.dwg) file.
Printing a Drawing
You'll learn to plot the individual plan sheets in a moment, but your first task will be to print 14A-FPLAY1.dwg from model space at a scale of ![]() (1 = 50) on an 11″×17″ (297 mm×420 mm) format printer. In this exercise, you'll use the DWFx ePlot (XPS Compatible).pc3 printer. Since the DWF plotter will simply plot to a file, you could select any sheet size you wanted. To remain consistent with the layouts you have already created, you will use a standard Letter (A3) sheet size for this exercise.
(1 = 50) on an 11″×17″ (297 mm×420 mm) format printer. In this exercise, you'll use the DWFx ePlot (XPS Compatible).pc3 printer. Since the DWF plotter will simply plot to a file, you could select any sheet size you wanted. To remain consistent with the layouts you have already created, you will use a standard Letter (A3) sheet size for this exercise.
The first step is to configure your layers by assigning lineweights to them.
Determining Lineweights for a Drawing
Look at the I14A-FPLAY1 (M14A-FPLAY1) drawing as a whole. You need to decide on weights for the various lines. The floor plan is drawn as if a cut were made horizontally through the building, just below the tops of the window and door openings. Everything that was cut will be given a heavy line. Objects above and below the cut will be given progressively lighter lines, depending on how far above or below the cut the objects are located.
In this system, the walls, windows, and doors will be heaviest. The roof, headers, fixtures, deck, and steps will be lighter. For emphasis, you'll make the walls a little heavier than the windows and doors. The hatch pattern will be very light, and the outline of the various components will be heavier for emphasis. Text and the title block information will use a medium lineweight. These are general guidelines; weights will vary with each drawing.
![]() NOTE Lineweight standards vary for each trade and profession that uses AutoCAD. Details usually follow a system that is independent from the one used by other drawings in the same set. Section lines, hidden lines, centerlines, cutting plane lines, break lines, and so on, will all be assigned specific lineweights.
NOTE Lineweight standards vary for each trade and profession that uses AutoCAD. Details usually follow a system that is independent from the one used by other drawings in the same set. Section lines, hidden lines, centerlines, cutting plane lines, break lines, and so on, will all be assigned specific lineweights.
Using Project Lineweights
You'll use four lineweights for the project, as shown in Table 15.1.
TABLE 15.1: The four lineweights used in the My Cabin project
| Weight | Thickness in Inches |
| Very Light | 0.005 (0.13 mm) |
| Light | 0.008 (0.20 mm) |
| Medium | 0.010 (0.25 mm) |
| Heavy | 0.014 (0.35 mm) |
In I14A-FPLAY1 (M14A-FPLAY1), 30 layers are visible in the floor plan, the site plan, and the elevation layouts as they are currently set up. Their lineweights will be assigned as shown in Table 15.2.
TABLE 15.2: Lineweights associated with the layers in the I14A-FPLAY1 (M14A-FPLAY1) drawing
The site plan model file I13C-SPLAY1.dwg (M13C-SPLAY1.dwg) has five layers of concern. You'll need to open it and assign the lineweights shown in Table 15.3.
TABLE 15.3: Lineweights associated with the layers in the I13C-SPLAY1 (M13C-SPLAY1) drawing
| Layer | Lineweight |
| C-ANNO-NARW | Fine |
| C-PROP-LINE | Medium |
| C-ROAD | Medium |
| C-SITE-REFR | Medium |
| C-SWLK | Fine |
When you look at the lineweights currently assigned to the layers across your two model files, you can generate a third chart that shows what lineweight needs to be assigned to each group of layers, as shown in Table 15.4.
TABLE 15.4: The thickness of each lineweight and the assigned layers
| Thickness | Layers |
| Very Light: 0.005 (0.13) | A-ANNO-DIMS, A-ELEV-FNDN-PATT, A-ELEV-ROOF-PATT, A-ELEV-SHAD-PATT, A-ELEV-WALL-PATT, A-FLOR-PATT, A-ROOF |
| Light: 0.008 (0.20) | A-DECK-STRS, A-ELEV-FNDN, A-FLOR-FIXT, A-WALL-HEAD, C-ANNO-NARW, C-SWLK |
| Medium: 0.010 (0.25) | A-ANNO-TABL, A-ANNO-TEXT, A-ANNO-TTLB, A-ANNO-TTLB-TEXT, A-DECK, A-DOOR, A-ELEV-DECK, A-ELEV-DECK-STRS, A-ELEV-DOOR, A-ELEV-DOOR-PATT, A-ELEV-GLAZ, A-ELEV-GLAZ-PATT, A-ELEV-ROOF, A-ELEV-TEXT, A-ELEV-WALL, A-GLAZ, A-GRID, A-TTLB-LABL, C-PROP-LINE, C-ROAD, C-SITE-REFR |
| Heavy: 0.014 (0.35) | A-WALL |
Applying Lineweights to Layers
You'll use Tables 15.1 and 15.2 to apply lineweights to the I14A-FPLAY1 (M14A-FPLAY1) and I13C-SPLAY1 (I13C-SPLAY1) drawings, respectively. The following procedure will guide you through the process:
The I15-FP Lineweight.las (M15-FP Lineweight.las) layer state is also available from the Chapter 15 download, and it will automatically assign the lineweights discussed in this exercise.
- Open I14A-FPLAY1.dwg (M14A-FPLAY1.dwg) from your Chapter 15 directory, and start the LAYER command to display the Layer Properties Manager.
- Make layer 0 the current layer.
The A-AREA and Defpoints layers do not plot, so you don't need to be concerned with them at this time, but verify that they are set to not plot. The E-POWR and L-PLNT layers are empty.
- Click the A-ANNO-DIMS layer to highlight it.
- Hold down the Ctrl key, and click the A-ELEV-FNDN-PATT, A-ELEV-ROOF-PATT, A-ELEV-SHAD-PATT, A-ELEV-WALL-PATT, A-FLOR-PATT, and A-ROOF layers to select them. Then release the Ctrl key.
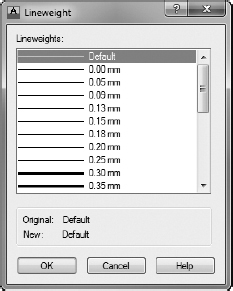
- In the Lineweight column of the Layer Properties Manager dialog box, click one of the highlighted Default words in the Lineweight column to open the Lineweight dialog box (see Figure 15.22).
FIGURE 15.22 Assigning a lineweight in the Lineweight dialog box
- Click 0.005″ (0.13 mm). Then click OK to assign the lineweight and exit the Lineweight dialog box.
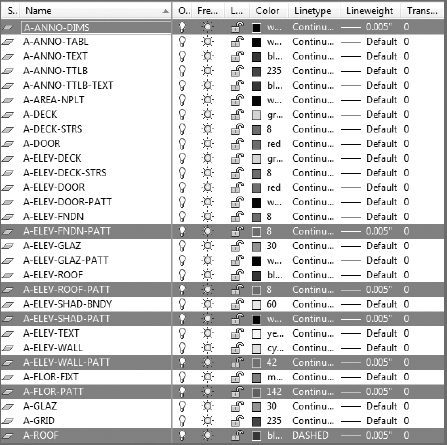
In the Layer Properties Manager dialog box, the highlighted layers now have a lineweight of 0.005″ (0.13 mm) assigned to them (see Figure 15.23).
FIGURE 15.23 The new lineweight is shown in the Layer Properties Manager.
- Repeat steps 3–6 three more times to assign the remaining lineweights to the layers within I14A-FPLAY1.dwg (M14A-FPLAY1.dwg):
- Assign the 0.008″ (0.20 mm) lineweight to the A-DECK-STRS, A-ELEV-FNDN, A-FLOR-FIXT, and A-WALL-HEAD layers.
- Assign the 0.010″ (0.25 mm) lineweight to the A-ANNO-TABL, A-ANNO-TEXT, A-ANNO-TTLB, A-ANNO-TTLB-TEXT, A-DECK, A-DOOR, A-ELEV-DECK, A-ELEV-DECK-STRS, A-ELEV-DOOR, A-ELEV-DOOR-PATT, A-ELEV-GLAZ, A-ELEV-GLAZ-PATT, A-ELEV-ROOF, A-ELEV-TEXT, A-ELEV-WALL, A-GLAZ, and A-GRID layers.
- Assign the 0.014″ (0.35 mm) lineweight to the A-WALL layer.
- Save the I14A-FPLAY1.dwg (M14A-FPLAY1.dwg) file, and open the I13C-SPLAY1.dwg (M13C-SPLAY1.dwg) file.
- Repeat the previous exercise by applying linetypes to these layers as follows:
- Assign the 0.008″ (0.20 mm) lineweight to the A-ANNO-NARW and C-SWLK layers.
- Assign the 0.010″ (0.25 mm) lineweight to the C-PROP-LINE, C-ROAD, and C-SITE-REFR layers.
The 15-SP Lineweight.las layer state is also available from the Chapter 15 download, and it will automatically assign the lineweights for your civil site plan.
- Save the I13C-SPLAY1.dwg (M13C-SPLAY1.dwg) file (keeping its existing name).
You have assigned the lineweights. When the print is complete, you can judge whether these lineweight assignments are acceptable or need to be adjusted. In an office, a lot of time is invested in developing a lineweight standard that can be used in most drawings. The development of such a standard is typically led by a CAD manager and decided upon by a CAD committee of key users throughout the company.
Setting Other Properties of Layers
Two other properties of layers deserve to be mentioned: Plot and Description. Both columns appear at the far-right end of the Layer Properties Manager dialog box.
The Plot feature is a toggle that controls whether the objects on a layer are printed. By default, the control is on. When this feature is turned off for a particular layer, objects on that layer aren't printed but remain visible on the screen. You used this feature to make layers with the NPLT suffix unplottable, and, in the future, you might designate a layer set not to print for in-house notes and data that you don't intend to be seen by those who will eventually view your printed drawings.
A Description column appears at the far right of the Layer List window. Clicking in this column on the blue bar of a highlighted layer opens a text box in which you can enter a description of the layer. Layer names are often in code or use abbreviations that don't fully describe what objects are on that layer. Here's a place to remedy that.
Setting Up the Other Parameters for the Print
Now that you have set the lineweights, it's time to move to the Plot dialog box and complete the setting changes you need to make in order to print this drawing. You'll use the Window option to select what you'll print.
- If it's not open already, open the I14A-FPLAY1.dwg (M14A-FPLAY1.dwg) file and switch to model space.
- In the Layer Properties Manager, select the A-ANNO-TABL, A-FLOR-PATT, A-GRID, and all three Site layers.
- Click the lightbulb icon to turn off each of the selected layers.
- Start the PLOT command.
- In the Plot dialog box, check the Printer/Plotter area to be sure that you have DWFx ePlot (XPS Compatible).pc3 displayed in the drop-down list.
- Check the Paper Size area to verify that ANSI Full Bleed (17.00 × 11.00 Inches) or ISO Full Bleed A3 (420.00 × 297.00 mm) is the selected paper size.
- Move down to the Plot Area section, open the What To Plot drop-down list, and select Window.
- In the drawing, turn off Object Snap.
- To start the window, pick a point just above and to the right of the topmost and rightmost dimensions.
- To complete the window, click a point below and to the left of the bottommost and leftmost dimensions.
Back in the Plot dialog box, Window is displayed in the What To Plot drop-down list, and a new Window button appears on the right side of the Plot Area section.
- Click this button if you need to redo the window after viewing a preview of the plot.
- If you have not already done so, click the right-pointing arrow in the lower-right corner of the Plot dialog box to display another column of plotting options.
- In the Drawing Orientation area in the lower-right corner, be sure that Landscape is selected.
- Assign the monochrome.ctb plot-style table by using the Plot Style Table drop-down list in the expanded Plot dialog box.
- In the Plot Scale area, uncheck Fit To Paper and, if you're using architectural units, open the Scale drop-down list and select ¼″ = 1′ -0″.
Notice that the text boxes below now read 0.25 and 12, a form of the true ratio for
scale. If you're using decimal units, do the following:- Choose Custom from the Scale drop-down list.
- Enter 1 in the upper text field and 50 in the lower.
- In the Plot Offset group, click the Center The Plot check box.
Your dialog box should look like Figure 15.24.
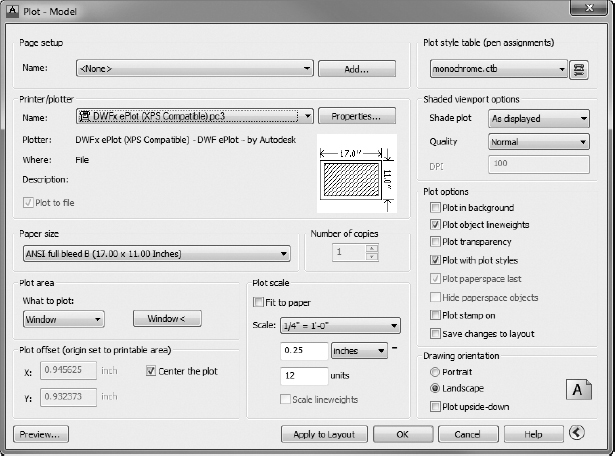
FIGURE 15.24 The Plot dialog box with the current settings
This completes the setup for your first plot. It's a good idea to preview how it will look as a result of the setup changes before you plot a drawing.
Previewing a Print
The Preview feature gives you the opportunity to view your drawing exactly as it will print.
- Click the Preview button in the lower-left corner of the Plot dialog box.
The computer takes a moment to calculate the plot and then displays a full view of your drawing as it will fit on the page (see Figure 15.25). If a Plot Scale Confirm dialog box opens, click Continue.
FIGURE 15.25 The preview of the cabin drawing, ready to print
- Right-click, and choose Zoom Window from the context menu.
- Make a window that encloses the bathroom, hot tub, and a couple of the dimensions. You have to click and hold down the mouse button, drag open the window, and then release the button.
The new view displays the lineweights you have set up (see Figure 15.26).
- Right-click, and choose Zoom Original from the context menu to return to the first preview view.
FIGURE 15.26 The zoomed-in view of the cabin showing the lineweights
- Right-click again, and choose Exit to return to the Plot dialog box.
If your print was oriented correctly on the sheet, you're ready to print. If not, recheck the setup steps for errors.
- At the bottom of the Plot dialog box, click the Apply To Layout button and then click OK.
- In the Browse For Plot File dialog box, browse to your Chapter 15 directory, accept the default filename, and click the Save button.
The computer begins calculating the print and eventually sends it to the printer.
 After the print is done, a notification balloon appears at the lower-right corner of the AutoCAD window (see Figure 15.27). You can turn notifications on and off by right-clicking the Plot/Publish Detail icon in the AutoCAD tray and choosing the appropriate option.
 - Save and close the I14A-FPLAY1.dwg (M14A-FPLAY1.dwg) drawing.
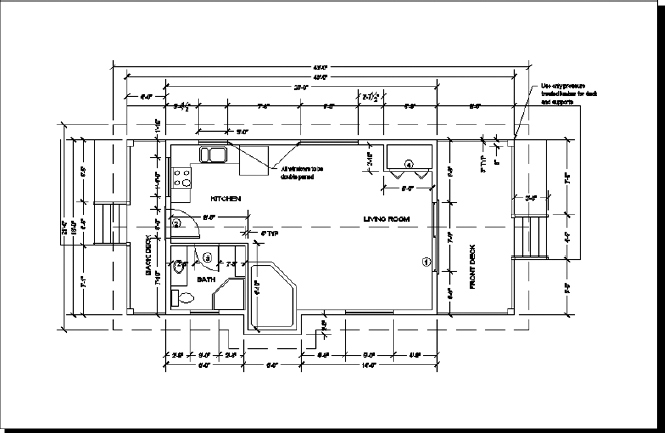
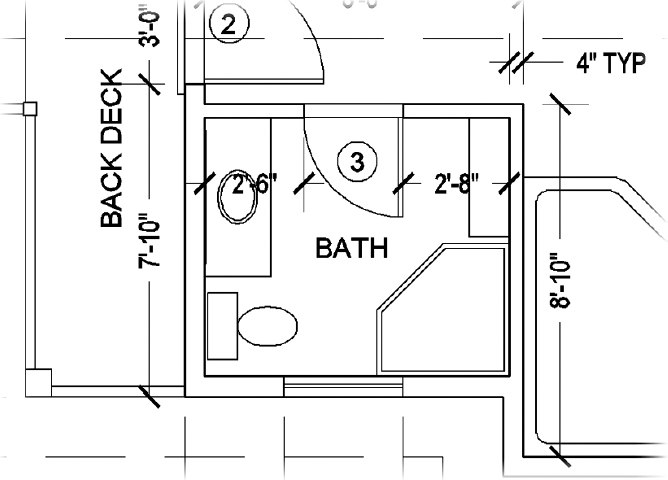
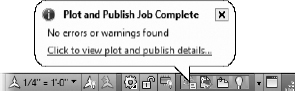
FIGURE 15.27 The notification balloon indicating that the plot is complete
![]() TIP On the right side of the Printer/Plotter group of the Plot dialog box, AutoCAD displays a partial preview of the plot in diagram form as you set it up. If there is a problem with the setup, AutoCAD displays red lines to warn you, but sometimes this doesn't accurately reflect the actual plot. It's better to use the Preview feature, which provides you with a WYSIWYG view of the plot.
TIP On the right side of the Printer/Plotter group of the Plot dialog box, AutoCAD displays a partial preview of the plot in diagram form as you set it up. If there is a problem with the setup, AutoCAD displays red lines to warn you, but sometimes this doesn't accurately reflect the actual plot. It's better to use the Preview feature, which provides you with a WYSIWYG view of the plot.
When your print comes out, it should look like Figure 15.25, shown earlier. Check the lineweights of the various components on the print. You might have adjust the settings outlined in this section when plotting to a physical plotter attached to your computer.
Since the DWFx plotter was selected, a DWFX file was created instead of a physical print. The next exercise will introduce you to Autodesk Design Review, a free program from Autodesk that is used to view these electronic plots.
![]() NOTE You can change a setting in the Lineweight Settings dialog box to be able to see lineweights in your drawing before you preview a plot, but they aren't very accurate unless you're using layouts. When you print from model space, you have to preview the drawing from the Plot dialog box to see how the lineweights look.
NOTE You can change a setting in the Lineweight Settings dialog box to be able to see lineweights in your drawing before you preview a plot, but they aren't very accurate unless you're using layouts. When you print from model space, you have to preview the drawing from the Plot dialog box to see how the lineweights look.
Viewing Plots in Design Review
Autodesk Design Review is a companion product that is included in the default AutoCAD installation and is available as a free download for people without a product such as AutoCAD installed. The public download for Design Review can be found at http://autodesk.com/designreview.
With Design Review, you can view, print, and mark up a vast array of file types including DWG, DWFX, PDF, and many common raster image formats. Markups created in Design Review can then be loaded into AutoCAD, allowing for a review cycle that reduces paper consumption and is completely digital. Although Design Review is capable of much more, you'll use it simply to view the DWFX file you plotted to in the previous exercise.
- Start Autodesk Design Review by choosing Start
 All Programs Autodesk Autodesk Design Review 2013.
 TIP Visit this book's companion site, www.autocadner.com, or the author's blog at www.thecadgeek.com for more information about the additional capabilities of Autodesk Design Review.
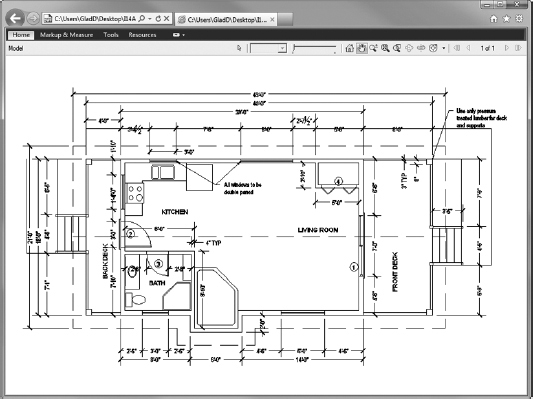
 - With Design Review running, use the Quick Access toolbar or choose Application menu Open Open File to open the DWFX file you saved to your Chapter 15 directory in the previous exercise.
The drawing you plotted displays in the Design Review Canvas (drawing area) shown in Figure 15.28. This is an exact representation of what the drawing would look like had you plotted it to a physical printer or plotter attached to your computer.
- Close Autodesk Design Review after you've used it to view the electronic plot of your drawing.
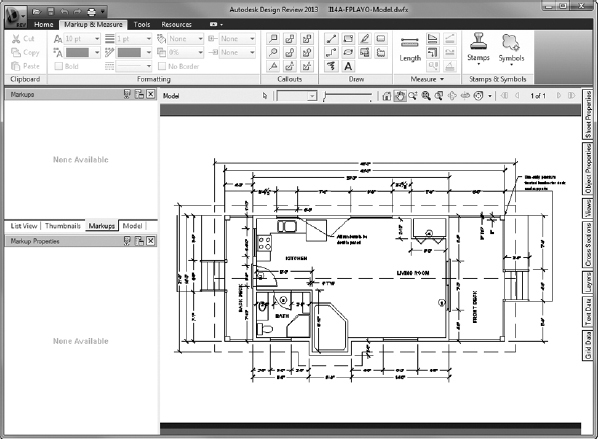
FIGURE 15.28 Viewing the plotted model space drawing by using Autodesk Design Review
The versatility of DWF files extends well beyond the reach of this book. To summarize, the format provides a free way to communicate design information with other project team members whether or not they have AutoCAD installed on their machines. AutoCAD users can further harness the abilities of the DWF and DWFX formats by publishing their designs to a three-dimensional DWF file. Whether you choose to publish in 2D or 3D, the DWF format was specifically designed to interact with Autodesk products and provides an excellent alternative to the PDF format, which often results in a much larger file size.
VIEW DWF AND DWFX FILES ON THE GO
Having access to your designs is a common requirement when visiting a job site, visiting a client's office, or otherwise working away from your desk. This has typically been accomplished by plotting a hard copy (paper drawing set) of your drawings and taking it with you as you leave the office. The introduction of Autodesk® 360 documents and the Design Review mobile application now provide a modern solution to this archaic workflow. Both 2D and 3D DWF or DWFX files that are uploaded to Autodesk 360 documents (http://360.autodesk.com) may be viewed within any major web browser without needing to install additional software. Similarly, the Design Review mobile application is a free download available from both the Apple App Store and Google Play.
Printing a Drawing Using Layouts
Plotting drawings using layouts is very similar to plotting from model space. The core difference between the two methods relates to the way your drawing is scaled. When plotting from model space, you must choose a plot scale from the Plot dialog box, whereas that parameter is already taken care of when plotting layouts. Aside from the occasional need to publish a half-size set of drawings, the plot scale inside the Plot dialog box will almost always be set to 1:1.
Updating Model File Layer Properties in Sheet Files
Earlier, you completed the “Printing a Drawing” section, which, among other things, discussed ways to assign lineweights to layers. Currently, these lineweights are reflected only inside the respective model files such as I14A-FPLAY1.dwg (M14A-FPLAY1.dwg). By default, changes to the layer properties of an external reference are not reflected in the host drawing, or sheet file in this case. In this section, you'll learn about the VISRETAIN variable and how to use it in conjunction with layer states to update the lineweights inside your sheet files. Let's get started:
- Open the I-A-100.dwg (M-A-100.dwg) sheet file, and switch to model space.
- Start the LAYER command to open the Layer States Manager.
 Click the Layer States Manager button found on the toolbar of the Layer Properties Manager.
- In the Layer States Manager dialog box, create a new layer state by picking the New button on the right side of the Layer States Manager dialog box.
- Name your new layer state 15-LayerBackup, and click OK to return to the Layer States Manager.
- Click the Close button to exit the Layer States Manager.
Keep the Layer Properties Manager displayed on your screen.
The VISRETAIN drawing variable controls how layers inside external references are stored inside your drawing. With its default value of 1, layer properties are stored in the host drawing, and changes in the reference drawing are not reflected in the current drawing. Conversely, when this value is set to 0, changes in the xref drawing are reflected in the current drawing.
- Enter VISRETAIN
 at the command line, and change its value to 0.
 - Start the XREF command to open the External References palette.
- Right-click the I14A-FPLAY1 (M14A-FPLAY1) reference, and choose Reload.
The I14A-FPLAY1.dwg (M14A-FPLAY1.dwg) drawing reloads in the current drawing. Notice the lineweight column in the Layer Properties Manager; the lineweights have updated in the current drawing.
- Set the VISRETAIN variable back to 1, and open the Layer States Manager once again.
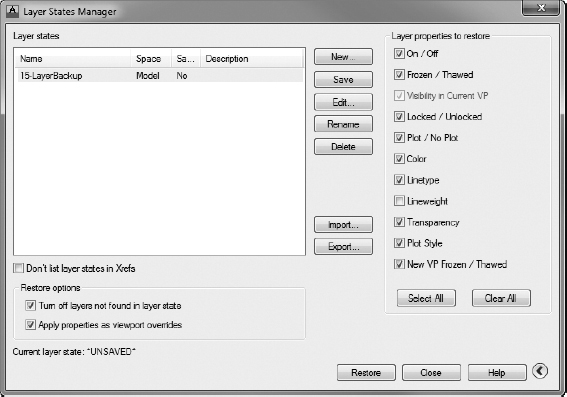
- Expand the Layer States Manager by using the arrow icon in the lower-right corner to reveal the Layer Properties To Restore group at the right side of the dialog box.
- Uncheck the Lineweight check box, as shown in Figure 15.29, and then click the Restore button.
FIGURE 15.29 Restoring all but the Lineweight property from the 15-LayerBackup layer state
- Repeat steps 2–12 on the I-A-200.dwg (M-A-200.dwg) and I-C-100.dwg (M-C-100.dwg) sheet files.
To avoid overwriting the lineweights just loaded into the A-100 sheet file, you chose not to restore the Lineweight property from your 15-LayerBackup layer state. Had you chosen to restore this property, the lineweights in your drawing would have been set back to Default. A drawback to this method is that any viewport layer overrides you created have been reset to match the properties of that layer in model space.
This drawback is one of the main reasons that many in industry choose to avoid viewport overrides whenever possible and manage their layers from model space. With the size of your Summer Cabin project, re-creating these viewport overrides shouldn't be too difficult. To summarize, you'll need to re-create the following viewport overrides:
A-101 Layout VP Freeze: A-FLOR-PATT and A-ANNO-TABL from the 14A-FPLAY1 reference
A-102 Layout VP Freeze: A-GRID, A-ANNO-TABL, and A-ANNO-DIMS from the 14A-FPLAY1 reference
A-103 Layout VP Freeze: A-FLOR-PATT and A-ANNO-DIMS from the 14A-FPLAY1 reference
![]() NOTE Because all the layers are managed from model space in the I-A-200.dwg (M-A-200.dwg) and I-C-100.dwg (M-C-100.dwg) sheet files, there's no need to re-create the viewport overrides in those drawings.
NOTE Because all the layers are managed from model space in the I-A-200.dwg (M-A-200.dwg) and I-C-100.dwg (M-C-100.dwg) sheet files, there's no need to re-create the viewport overrides in those drawings.
Plotting a Single Layout
With the lineweights properly assigned, you're now ready to begin plotting the layouts that make up your plan set. The rest of this chapter focuses on the multiple ways of plotting layouts from AutoCAD. Each method has its own advantages and disadvantages, and the method you ultimately choose will likely change based on the specific task at hand. To begin our discussion, you'll first look at plotting a single layout.
To summarize, when a layout has been set up properly and is active, you print at a scale of 1:1. The elements of the drawing on the layout are then printed at actual size, and the model space portion of the drawing is printed at the scale to which the viewport has been set. Follow these steps:
- With I-A-100.dwg (M-A-100.dwg) open, switch to the A-101 layout by using the Quick View Layouts tool.
For a review of layouts and viewports, see Chapter 14. Your layout should look like Figure 15.30.
- Make sure that you are in paper space to start the PLOT command.
FIGURE 15.30 The cabin drawing ready for printing from a layout
- You're using the DWFX-1117 (DWFX-A3) page setup. Verify the printer, paper size, and orientation as before.
- Make sure that, in the Plot Area group, the current choice displayed in the What To Plot drop-down list is Layout instead of Limits.
- In the Plot Scale group, the scale has been set to 1:1. This is what you want.
In the Plot Offset group, the Center The Plot check box is grayed out; it isn't needed when using a layout to plot.
- Expand the Plot dialog box as necessary to verify that the monochrome.ctb plot-style table is assigned.
There are no changes to make. Because this layout was set up for printing when it was created, all the settings in the Plot dialog box are automatically set correctly.
- In the lower-left corner, select Preview.
Your preview should look like Figure 15.31. Notice how the preview looks exactly like the layout, but without the dashed frame.
- Right-click, and choose Exit to close the preview window.
- Click OK to start the print.
- Save the resulting electronic plot as I15-A-100.dwfx (M15-A-100.dwfx).
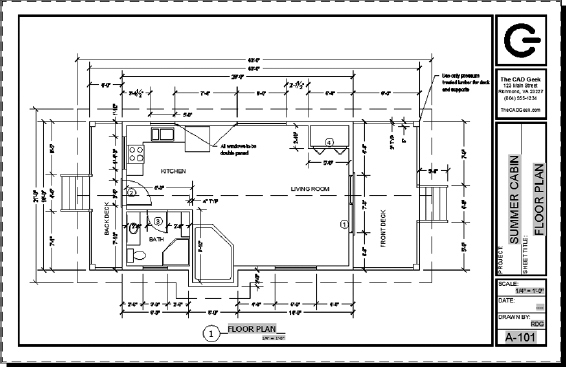
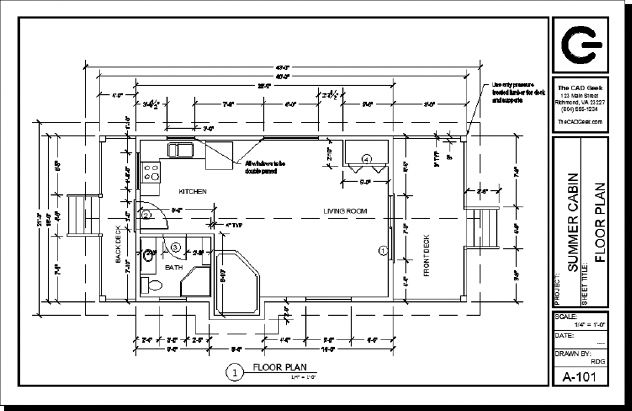
FIGURE 15.31 The preview of the current layout
This exercise shows that once a layout has been created, most of the setup work for printing is already done for you. This greatly simplifies the printing process because the parameters of the print are determined before the PLOT command begins.
Printing a Drawing with Multiple Viewports
Multiple viewports in a layout don't require special handling. The print is made with the layout active at a scale of 1:1. For the next print, you'll continue using the DWFx plotter but with a larger sheet size. Large-format drawings, typically defined as anything larger than 11″×17″, are especially common when representing large designs such as buildings.
Printing with a Large-Format Printer
The procedure here varies little from the one you just followed to print the layout at a 1:1 scale. Here you will scale the viewport up to fit on a larger sheet for presentation purposes:
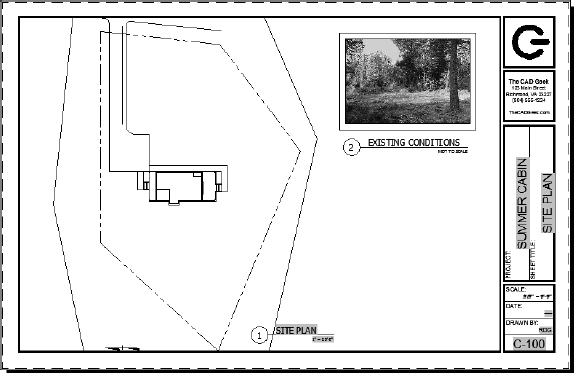
- Open the I-C-100.dwg (M-C-100.dwg) site plan sheet file, and switch to the C-100 layout (see Figure 15.32).
- Start the PLOT command to open the Plot dialog box.
FIGURE 15.32 The site plan sheet file—I-C-101.dwg (M-C-100.dwg)—with the C-100 layout active
- Verify that the DWFx plotter is still current and, in the Paper Size area, choose any large-size paper that is recognized by the plotter.
In this example, I'm using a 24″×36″ (594 mm×841 mm) A1 sheet size.
In a true production environment, it might be better to create a large-format layout to accommodate large-format plots.
- In the Plot Area group, choose Extents from the What To Plot drop-down list and then click the Center The Plot option.
- In the Plot Scale group, check the Fit To Paper option and then check Scale Lineweights.
This option causes AutoCAD to scale the lineweights relative to the amount the layout is scaled to fit to the paper.
- Click the Preview button.
The white area around the border isn't even (see Figure 15.33). This is because the aspect ratio of the layout is different from that of the 24″×36″ (594 mm×841 mm) A1 paper.
FIGURE 15.33 Preview of the cabin site layout
- Right-click, and choose Exit from the context menu to cancel the preview.
- Click the OK button to plot this drawing to a new 15-C-100-Enlarged.dwfx file.
- Close the I-C-100.dwg (M-C-100.dwg) without saving.
Publishing Multiple Layouts
In AutoCAD terminology, you plot a single layout or view one or more times. The terms publishing and batch plotting are interchangeable and refer to assigning several layouts or views to plot in sequence, one or more times. In this exercise, you will publish all your layouts at one time.
 Open the I-A-100.dwg (M-A-100.dwg) sheet file, select the Output tab, and then click the Batch Plot button in the Plot panel.
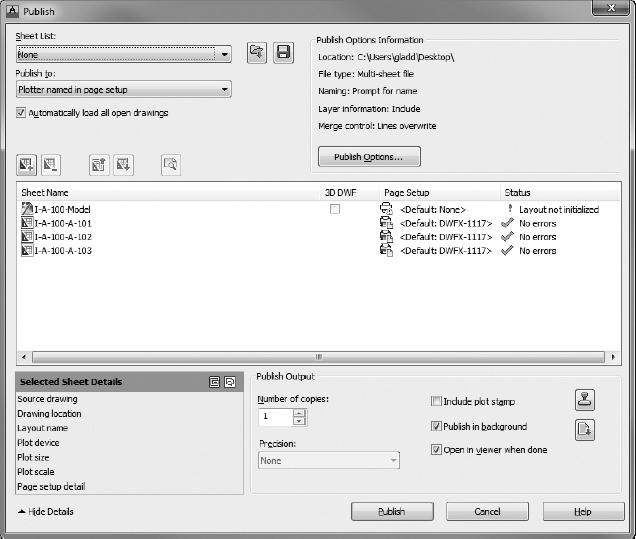
You may also choose the Publish option from the Application menu, or enter PUBLISH
to open the Publish dialog box (see Figure 15.34). This shows all the layouts, including model space for all open drawings.FIGURE 15.34 The Publish dialog box
 You don't want to plot the objects from model space, so select the Model layout in the Sheet Name list and then click the Remove Sheets button.
- To prevent the Model sheet from automatically being added in the future, right-click and then uncheck the Include Model When Adding Sheets option in the context menu.
In the Page Setup column, you can see that all the layouts are set to <Default:DWFX-1117> (<Default:DWFX-A3>). This indicates that all the layouts will use the original page setup designated when the first layout, Cabin Floor Plan, was created. Remember, the other layouts were copied from this original layout.
 To add the other sheet files in your plan set, click the Add Sheets button.
- Select the I-A-000.dwg (M-A-000.dwg), I-A-200.dwg (M-A-200.dwg), and I-C-100.dwg (M-C-100.dwg) sheet files.
If necessary, drag the sheets into the proper order.
- Click the Publish button at the bottom of the dialog box.
- In the Save Sheet List dialog box, click Yes.
This provides you with the opportunity to save this publishing job as a Drawing Set Description (DSD) file so that it can be reloaded with the Load Sheet List button. It's not always necessary to plot all the layouts in a drawing every time you use the Publish tool. By creating DSD files for frequently published layout combinations, you can reduce the amount of time required to produce hard-copy prints.
- In the Save List As dialog box that opens, name the DSD file and navigate to your current working directory to place it. Then click Save.
- The Publish dialog box closes, and the plots begin. If a Processing Background Job dialog box appears, click Close.
An extensive number of plots can take a while to finish, depending on the size and complexity of the drawings and speed of the printer. The publish operation takes place in the background, so you can continue to work on your drawings as the publishing occurs.
 Click the Plot And Publish Details button in the bottom-right corner of the AutoCAD window to see information regarding the current and previous plots.
Only one publish operation can occur at a time. If you start an operation before the previous one is completed, you will see the Job Already In Progress dialog box, shown in Figure 15.35, indicating that you must wait before starting the next one.
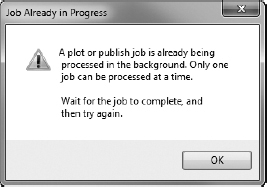
FIGURE 15.35 The Job Already In Progress dialog box
Without the PUBLISH command, you would have to open each layout tab individually and use the PLOT command to make a print of each layout. In addition to providing out-of-the-box batch plotting capabilities, the option to save a DSD file helps automate the plotting process. These DSD files can be especially helpful for projects for which multiple submittals are expected.
There is one final way of plotting multiple drawings at once, and it is by using Sheet Set Manager. The next section will allow you to harness one of the most popular features of Sheet Set Manager.
Publishing with Sheet Set Manager
In Chapter 14, you learned how Sheet Set Manager can be used to create and manage drawing sheets. Now that it's time to plot your drawings, this section will teach you how to use Sheet Set Manager to plot nearly any combination of sheets.
- If it's not already displayed on your screen, open the Sheet Set Manager palette set by selecting the Sheet Set Manager tool on the Palettes panel of the View tab on the Ribbon.
- Expand the drop-down list at the top of the Sheet List palette, and choose Open. Browse to and open the Summer Cabin.dst file in your Chapter 15 directory.
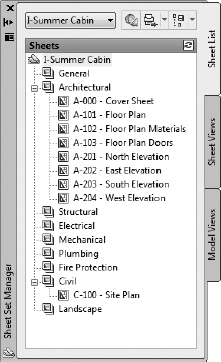
After you open the sheet set, the Sheet Set Manager palette set should display a list of drawing sheets in your project (see Figure 15.36).
FIGURE 15.36 The Summer Cabin sheet list displaying a list of drawing sheets
- Right-click the Summer Cabin sheet set name at the top of the Sheet List palette, and choose Publish Publish To Plotter from the contextual menu that appears (see Figure 15.37).
FIGURE 15.37 Publishing the entire sheet set to the default plotter
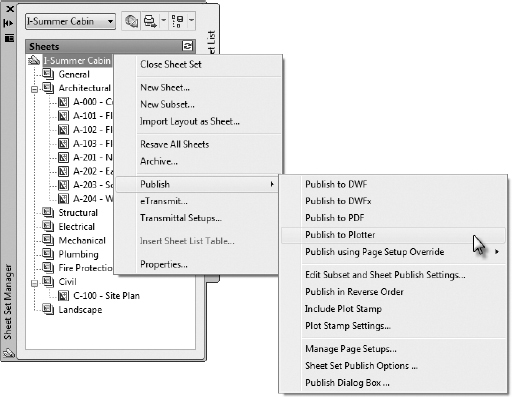
Choosing the Publish To Plotter option from Sheet Set Manager will use the plotter assigned to each individual layout tab. That is, if half of your layouts had Plotter A assigned to them and the other half had Plotter B, half of your drawing set would plot on each plotter. Therefore, if you plan to use Sheet Set Manager, it's especially important for you to set up each of your drawings in a uniform way. Sheet Set Manager offers you multiple ways of plotting your sheet set:
Publish To DWF/DWFx Uses the assigned page setup of each layout and creates a DWF or DWFX file by using the settings such as page size and plot-style table contained within the page setup.
Publish To PDF Identical to the Publish To DWF or DWFx option with the exception of the output file type. As its name indicates, the Publish To PDF option will create a PDF file compatible with the popular Adobe Acrobat program.
Publish To Plotter As previously discussed, this option will use the page setup assigned to each layout and use those settings to publish the sheet set. If different plotters are assigned to the various layouts, your sheet set will plot to separate plotters.
Publish Using Page Setup Override Among the settings you specified as you created your Summer Cabin sheet set was the location for Page Setup Overrides. This was set to the same template drawing used to create your sheets. Therefore, any additional page setups you create in your sheet template drawing will automatically appear here. Using a Page Setup Override will inherit all of the settings, including the plotter, contained within the page setup.
You don't always need to plot every drawing inside your sheet set. Let's say you want to plot only the Architectural sheets in your plan set. Rather than right-clicking the Summer Cabin sheet set name, you would right-click the Architectural subset to display the contextual menu shown earlier in Figure 15.37. Instead of plotting every drawing in your sheet set, Sheet Set Manager will plot only the sheets under the Architectural subset.
It's also possible to select any combination of sheets and subsets by using the Ctrl key to plot only the sheets you select. Although setting up Sheet Set Manager takes more time than using the PUBLISH command, this versatility, coupled with the sheet management features covered in Chapter 14, makes it a worthwhile investment for a plan set of any notable size.
WHAT'S THE DIFFERENCE BETWEEN DWF AND DWFX?
The DWF format was created in 1995, before computing power was what it is today. Creating DWF files will use version 6 of the DWF format. By contrast, the DWFX format is technically version 7 of the DWF format. The major difference between the two versions is interoperability.
The only way to view and open a DWF file is with an Autodesk application such as Design Review. However, DWFX files are built using the Microsoft XML Paper Specification. While you'll still need Design Review to take advantage of the electronic markup features found inside it, DWFX files have the added feature of being compatible with an XPS viewer. An XPS viewer is available for Windows XP and ships with Windows Vista and above. It's also possible to download and install XPS viewing components for Internet Explorer 7 and higher to view DWFX files.
Going Forward
This chapter has been a quick tour and introduction to the plot-style feature, which helps control how your drawing will plot. Getting consistently good output from your AutoCAD drawings requires an investment of time by you, or the office CAD manager/information technologist, to set up the best configuration of your printers and AutoCAD. As you have seen, layouts provide a good tool for setting up plots, once the configuration is right.
The next two chapters cover drawing in 3D (for AutoCAD users only). There you'll learn how to build a comprehensive 3D model and render it to create a photorealistic illustration of how your cabin will look after it is built. This book's web page (www.sybex.com/go/autocad2013ner and www.thecadgeek.com) offers a collection of all the AutoCAD drawings and adjunct files that you'll use or generate throughout the course of this book.
Just because the 3D features found inside AutoCAD aren't included in AutoCAD LT doesn't mean that your journey has to end here. Be sure to visit the companion sites noted in the preceding paragraph, where you'll find additional resources to help you continue mastering AutoCAD and also get answers to any questions that may have arisen as you worked through the book.
If You Would Like More Practice…
This chapter used the virtual DWFx ePlot (XPS Compatible).pc3 device that's included with AutoCAD to create plots of your drawings. Apply the concepts you learned throughout this chapter to plot to a physical printer/plotter connected to your computer. To create a hard-copy plot of a layout tab, follow these steps:
- Open the PLOT command.
- Select the physical device to which you would like to plot.
- Choose the best paper size for your device. Remember that many plotters include several versions of the same overall paper size.
- Set the Plot Area, Plot Offset, and Plot Scale as needed. Use the Preview button to verify each of these settings.
- Pick a Plot Style Table, and set the Drawing Orientation to Landscape.
- Validate your plot by clicking the Preview button once again. Make any necessary changes.
- Click OK to begin plotting your drawing.
Are You Experienced?
Now you can…
- Set up a drawing to be printed
- Assign lineweights to layers in your drawing
- Select the area of your drawing to print
- Choose a sheet size to use to print your drawing
- Control the orientation and origin of the print
- Set the scale of the print
- Preview a print
- Print a layout
- View electronic plots with Autodesk Design Review
- Use Sheet Set Manager to publish one or many drawings
- Publish multiple layouts
- Navigate through the plot-style features