
Chapter 13
Space Charge Measurement by the Laser-Induced Pressure Pulse Technique 1
13.1. Introduction
Three non-destructive techniques currently exist to determine the space charge in a solid insulator using the propagation or production of a pressure wave. These are the electroacoustic PEA (Pulsed Electro Acoustic) method described in the previous chapter, a method using propagation of a pressure wave generated by a piezo: PIPS or PIPP (Piezoelectrically Induced Pressure Step or Pulse), and a method using propagation of a pressure wave induced by the impact of a laser beam, called the LIPP (Laser Induced Pressure Pulse) technique. The method of production of this pressure wave is the parameter which distinguishes these different techniques. In PIPPS, PIPP and LIPP techniques, the acoustic wave is generated in a mechanical way, either by a piezo transducer, or by a laser impact on a target fixed on the sample to be tested. This impulse acoustic wave propagates throughout the insulator, thus modifying the relative position of the charges it encounters. A variation of induced charges then appears at the electrodes, whose effect is the outbreak of a pulse voltage or current in the measurement circuit.
After a brief discussion of the development history of this method’s principle, the equations connecting the measured external pulse current or voltage magnitude to the internal charges distribution will be described. A description of the experimental setup as well as the expected performances follows, and the possibilities offered by this technique will then be illustrated. Finally, perspectives on the use of this method will be presented.
13.2. History
The suggestion to use a short mechanical perturbation to determine the internal charge amount accumulated in a solid insulator [LAU 77] originates from the École supérieure de physique et de chimie industrielle in Paris. Applicable to all insulators in which the charges to be measured move with the induced deformation of the atomic lattice, this non-destructive method has given rise to numerous experimental implementations. Logically, the first was that proposed by the Laboratoire d’électricité générale [LAU 76], [DAR 80]. This technique used a steep-fronted pressure wave generated by a shockwave tube. Unfortunately, the spatial resolution of the measurements was strongly dependent on the position of the tube with respect to the sample and reproducibility was not guaranteed. A second implementation was achieved by creating a pressure wave with a sudden capacitor discharge in a liquid. The spatial resolution obtained with this method was mostly destined for thick samples (of a few cm).
The first use of a laser impact as a generation source for the pressure wave was made by a Russian team [ROZ 79]. The fairly long duration of the laser pulse did not permit samples of less than a few mm thick to be studied. We had to wait until the early 1980s for spatial resolutions which allowed the study of thinner samples, owing to the use of lasers emitting laser pulses of a short duration (a few ns) [ALQ 81], [SES 81], [ALQ 83]. The problems of spatial resolution, reproducibility and parallelism between the optical wave front and the sample were solved and this technique has, since then, been improved and adapted to different sample structures (whether plane or coaxial). Considering the characteristics it presents, it was adopted by numerous university research teams around the world, and also by big industrial groups working on the optimization of insulating materials.
13.3. Establishment of fundamental equations for the determination of space charge distribution
The equations (in a plane structure) which allow the connection between signals induced by the transit of the pressure wave in an homogenous insulator and the internal charges distribution ρ(x) (assumed uniform on the x-axis) will be established. These internal charges induce image charges on the electrodes A and B, whose superficial densities σA and σB are given for different cases (Figure 13.1).
13.3.1. Specific case: uncharged or charged and short-circuited sample (V=0)
When the sample is uncharged, the charge density ρ(x) is null on the x-axis. After application of an electrical potential difference V=VB−VA, the charge density σA given by equation [13.1a] only depends on the value of this electrical potential difference. If the sample is charged and short-circuited, the charge density at the electrodes only depends on the charge densities ρ(x) accumulated in the sample and on its geometry. We can define a voltage potential difference V0, such that σA is given by equation [13.1b]:
where d corresponds to the thickness of the insulator, ε0 and εR, respectively, to the vacuum permittivity and that of the insulator, and V0 is the equivalent voltage of the electret [DRE 73], i.e. the voltage to apply to the sample to eliminate the surface charge σA.
13.3.2. General case: charged sample submitted to an electrical potential difference
By superposing both the previous cases, σA is given by:
The electrical potential difference V being fixed, calculation of the voltage V0 is required for the determination of σA. The detail of this calculation can be found in [ALQ 83]:
where P(x) represents the pressure wave spatial distribution, Q the total charge contained in a surface S and ![]() the average penetration depth of the charges. The polarization (assumed uniform on the x-axis) is equivalent to a charge distribution ρpol(x), defined by equation [13.4a]. For the sake of simplification, the charge density ρ(x) will therefore be considered defined by equation [13.4b]:
the average penetration depth of the charges. The polarization (assumed uniform on the x-axis) is equivalent to a charge distribution ρpol(x), defined by equation [13.4a]. For the sake of simplification, the charge density ρ(x) will therefore be considered defined by equation [13.4b]:
Finally, the expression for σA, taking into account equations [13.3] and [13.4], becomes:
The determination of σB is immediate since:
The superficial charge densities σA and σB are therefore likely to supply information on the charges accumulated within the insulator.
13.3.3. Application of a pressure wave
Under the effect of uniform compression, and because of the local concentration variation of dipoles and charges, the relative permittivity εR takes a uniform value ε′R in the material. If we admit that the stored charges follow the atomic lattice deformation, then a basic calculation shows that the quantity ![]() remains unchanged and that only the term related to the dielectric thickness is affected by this constraint. The application of a uniform compression therefore does not allow the spatial distribution of charges to be found.
remains unchanged and that only the term related to the dielectric thickness is affected by this constraint. The application of a uniform compression therefore does not allow the spatial distribution of charges to be found.
By contrast, when the sample is subjected to an unhomogenous compression (see Figure 13.1), the value of εr in the compressed zone as well as the quantity ![]() are modified, as are σA and σB. This variation depends on the internal charges ρ(x) but also the mechanical perturbation profile P(x) the knowledge of which therefore turns out to be fundamental.
are modified, as are σA and σB. This variation depends on the internal charges ρ(x) but also the mechanical perturbation profile P(x) the knowledge of which therefore turns out to be fundamental.
13.3.4. Relationships between measured signals and charge distribution
The difference in electrical potential existing at the boundaries of the sample during the propagation of the pressure wave is expressed by:
where d′ is a function of time:
In this equation, χ represents the compressibility of the insulator and xf(t) the position of the pressure wave front. The detailed calculation permitting the electric field distribution to be worked out can be found in [ALQ 83]:
where i(t) is the current circulating in the measurement circuit and G(εR) a function of the pressure dependence of εR. When the measurement circuit presents a very high impedance at high frequency, equation [13.9] becomes [13.10] (electrode A being related to the mass). If this impedance is very weak, equation [13.9] transforms into [13.11]. C is the equivalent capacity of the sample fraction submitted to the pressure wave (before compression):
In the case where the pressure wave evolves during its progression (by attenuation and dispersion of elastic waves in the material), it is not possible to simplify equations [13.10] and [13.11]. Nevertheless, if the pressure pulse is of a short duration (or less than the desired spatial resolution), then the measured voltage [13.10] is directly proportional to the electric field, or the measured current [13.11] is directly proportional to the charge quantity [ALQ 83].
The equations which have just been established show that the electric charge distribution in an electrical insulator can be deduced with no ambiguity by the measurement of the signal produced by the propagation of a pressure wave.
13.4. Experimental setup
13.4.1. Synoptic schema of the measurement setup
The implementation of the LIPP technique is composed of three steps: the production of a pressure wave, the measurement of the induced signal and the processing of these signals. After amplification, the collected signal (potential or current difference) is then stored in a transient recorder. The digital processing of this is then ensured by a computer, allowing the space charge distribution to be established. The synoptic outline of the experimental setup was reproduced in Figure 13.2 (current measurement). Figure 13.3 shows a final realization.
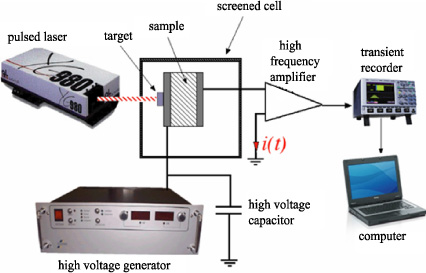
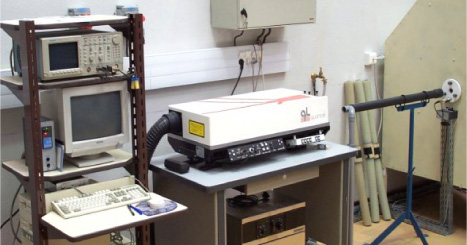
Figure 13.3. View of an experimental setup (digital oscilloscope and signal-processing computer on the left, laser generator at the center and measurement cell on the right)
13.4.2. Generation of pressure
The production of a pressure wave by the impact of a laser pulse on an absorbant surface, suggested by R.M. White in 1963 [WHI 63], was the goal of numerous research. The target absorbs part of the incident energy and transfers it to the lattice in a very brief time, producing local heating. A thermal expansion then appears and subsequently a spatial deformation gradient, i.e. a pressure which propagates in the form of a quasi-plane wave perpendicular to the irradiated surface. This absorption, which depends on both the optical properties of the material and laser beam wavelength, is attributed to electron excitation in higher energy states which then come back very rapidly to their fundamental state (typically 10−12 s). For metallic targets (gold, aluminum, copper, etc.), the absorption ranges in depth from 0.1 to 1 µm, but they reflect up to 90% of the laser beam energy (at λ=1,064 nm). When part of the target is vaporized (volatile target), the vapor thus created exerts an additional pressure on the still solid part.
To obtain relatively high pressures (typically from ten to twenty, to a few hundred bars) and therefore a strong signal/noise ratio, it is fundamental to have power densities varying from 106 to 108 W/cm2. Further, the duration of the laser pulse must be fairly brief to obtain a satisfying spatial resolution (a few microns). In polymers, where the speed of sound ranges from 1,000 to 3,000m/s at 20°C, the laser pulse duration must not exceed a few nanoseconds, such to be able to process samples from a few hundred microns to a few millimeters thick.
Considering these orders of magnitude, the use of a laser emitting pulses of the order of a nanosecond and possessing energy of a ten to twenty, to a few hundred millijoules (on a 1cm surface) allows the requirements to be satisfied. The choice of the laser is most often focused on Nd-YaG models, offering a better spatial homogeneity of the emitted beam energy than offered by gas models, which permits to the generation of uniform pressures on the whole irradiated surface.
The choice and the optimization of the target are essential steps in the search for a high signal/noise ratio permitting the induced signals to be correctly processed. The target can be fixed on the sample either with the aid of glue, or with a semiliquid couplant. In both cases, they must allow the transmission of the wave without strong attenuation. A deposit by vacuum evaporation can also be envisaged (on a metallic target); in that case the thickness of the metallization must be sufficiently high to avoid any photo-induced currents.
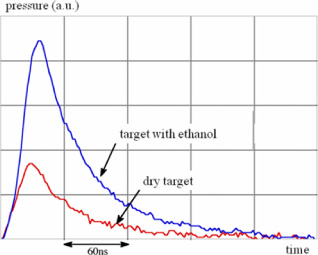
To increase the level of the induced pressure, and therefore the signal/noise ratio, various solutions have been found, notably the coating of the target by a substance optically transparent at the wavelength of the laser beam (water, ethanol, resin, varnish, etc.) [AND 70], [YAN 74], [FAI 74], [VON 77]. This coating allows the pressure induced in the target to be increased by using the overpressure generated in the air in the vicinity of the laser beam impact. An example of pressure obtained by use of an ethanol film left on a semi-conductive target is given in Figure 13.4. Let us note that the gain obtained on the pressure level is to the detriment of the spatial resolution (because of an increase of the pressure duration).
13.4.3. Signal recording
When considering the propagation speed of a pressure wave in the insulators, the current or the induced electrical potential difference will have to be recorded by a piece of equipment with a high bandwidth (a few 100MHz). In the outline of Figure 13.2, the measurement circuit (of low impedance) is made up of a high-voltage capacitor and an amplifier input impedance (50Ω). An induced current related to the internal distribution of the electric field by equation [13.11] will circulate in this measuring circuit. From an electrical point of view, the sample traversed by the pressure wave then behaves like a high-frequency current source. The non-irradiated part of the sample placed under the electrodes also behaves like a low impedance at high frequencies and consequently a part of the laser induced current circulates in this impedance. In order to reduce this lost part of the current, the dimensions of the electrodes must be, as much as possible, close to that of the laser beam. Further, a frequential analysis including all the elements of the topology of the measurement circuit is essential to check that in the “useful” spectral window, the signal collected by the amplifier is actually the image of the current generated by the sample [DER 94], [MAL 96], and that the use of filters does not truncate it [MAL 96].
13.4.4. Calibration of the experimental setup
The calibration operation consists of determining the evolution of the pressure wave in the insulator. This term plays a part in equation [13.10] and its time derivative in equation [13.11]. This determination can be carried out when the internal electric field is known, for example when the sample to test is empty of charge and when the applied voltage is sufficiently low to avoid any injection or dissociation of charges during the calibration measurement. If the pressure wave has a low spatial extension, the distance it covers to entirely penetrate the insulator is sufficiently weak to consider that it does not get distorted, which is mathematically expressed by:
where P(x,t) represents the value of the pressure at point x and instant t, v being the wave speed and 0 the input point of the wave. If we derive P(x,t) with respect to time, we then obtain a current being, respectively, during the input and during the output of the pressure wave (in a plane insulator):
where E0 represents the value of the applied field, assumed uniform in the insulator. The measured signal is therefore, apart from the hypotheses, proportional to the pressure at the interface between the input electrode and the insulator (zone a, Figure 13.5). The wave then moves in the material (zone b, Figure 13.5), and is subjected to an attenuation and a dispersion to reach the interface between the insulator and the output electrode, where we can hold the same reasoning as for the input (zone c, Figure 13.5).
Figure 13.5. Left: signal induced during the calibration step (Polyethylene; d=1mm, V=30kV, T=20°C). Right: Determination of the evolution of the pressure wave’s profile during its transit in the sample
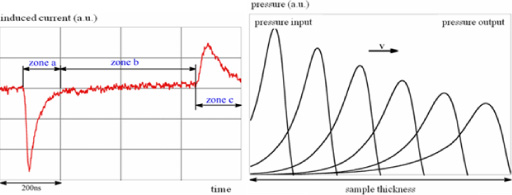
From the signal induced during the calibration step, appropriate digital processing is then made to reproduce the wave propagation by taking into account both attenuation and dispersion laws [DIT 90]. The verification of the wave propagation modeling can be done in two different ways. The first, experimental [DIT 90], consists of using a quartz-crystal transducer to measure the pressure at the output of samples of a similar nature but with different thicknesses, and to compare them with the calculated pressures. The second method, mathematical [MAL 96], consists of recalculating the induced current (equation [13.11]) from the calculated pressures and comparing it with the current actually measured. An example of a pressure wave propagation calculation is given in Figure 13.5. Let us note that this kind of measurement has, rightly, been proposed for the determination of the elastic properties of insulating materials [DIT 93].
13.4.5. Signal processing
In the particular (and ideal) case where the wave can be assimilated to a pulse which is not subjected to any deformation during its transit in the insulator, equation [13.11] is a second-order Fredholm equation. Its resolution, known as a deconvolution operation, can be achieved using different methods [BIR 76]. In practice, the wave is subject to a deformation: equation [13.11] is then called a first-order Fredholm equation. Its resolution is not easy because the noise, even if low, together with errors due to discretization and rounding up in calculations, induce parasitic oscillations which are sometimes important in the solution [MAX 72]. The pressure wave-induced current being known in discrete form, the first step in the resolution of equation [13.11] consists of replacing the integral by a summation. In matrix form, the resolution of the equation induces strong oscillations in the solution (no longer unique), inherent to matrix inversion methods. This inversion must therefore be performed with a constraint imposed on the solution to only conserve its natural variations [BOU 87]. To validate the solution obtained, it is essential to possess a priori information on E(x). Two verifications are generally done on this account: the first consists of recalculating the induced signal from the found solution, E(x), and to compare it to the measured signal, whilst the second verification consists of ensuring that E(x) satisfies the equation:
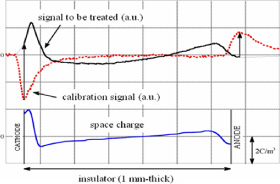
These conditions are directly expressible in terms of mathematical equations and therefore can be integrated into the processing software; ρ(x) is then obtained using Poisson’s equation. An example of processing of the signal induced by the transit of a pressure wave in a low-density polyethylene sample is given in Figure 13.6. The laser duration being short (9 ns), the signal processing result is very close to the measured signal.
Figure 13.6. Example of processing of a signal induced by the transit of the pressure wave in a charged sample
13.5. Performances and limitations
13.5.1. Performances
Considering the high level of pressures induced by the LIPP method, measurements may be performed on thick samples (up to a few millimeters thick), allowing investigations on power cables [MAH 91]. The sensitivity of the measurements is high because the high level of induced pressures generates signals with strong signal/noise ratios. It is nevertheless quantifiably difficult because related to the noise level. However, a simplified approach can bring an estimation of its value [DIT 90]. As an example, for a polymeric insulator with a thickness of a few mm, the sensitivity of the measurement and the spatial resolution after processing of the signal are, respectively, of the order of a few mC/m3 and a few µm (9 ns laser, 450 mJ) [MAL 96].
The duration of a measurement being short (i.e. 1 µs for a 2 mm-thick polyethylene sample at 20°C), under DC voltage, the LIPP method allows the growth and the evolution of the space charge whose dynamics is much slower to be followed in real time. Further, its use under industrial frequency (sine 50 Hz–60 Hz) has already been validated [BER 95], [HO 02]. This property is particularly interesting because it permits parameters essential for the study of the space charge formation in insulators to be accessed.
Laser beam focusing [QIN 99] or the use of masks [MAL 96] permits localized measurements to be made. The displacement of the focused beam (or the masks) allows the realization of 3-D space charge cartographies. It also allows the research of non-uniform distributions betraying the presence of “defects” in the insulator.
13.5.2. Limitations
The first limitation of the LIPP method is related to the actual principle of the measurement, i.e. the displacement of the pressure wave. Indeed, the passage from one medium to another (in the case of multilayer insulators, interfaces, electrodes, etc.) is accompanied by a reflection of all or part of the wave which depends on the acoustic mismatch between both media. If the acoustic impedances are very different, the pressure wave is entirely reflected: the method does not allow the measurement beyond the interface between both media. If the reflection is partial, signal processing is very difficult, if not impossible. It should be noted that this limitation factor can be taken advantage of to detect possible assembly defects between two layers of a similar insulating system [AIN 99].
The use of a volatile target is the second limitation factor of the LIPP method. Indeed, target ablation modifies the induced pressure profiles and successive measurements lose their synchronicity (Figure 13.7, left). The signals can no longer be processed owing to only one calibration signal, which makes the space charges study process considerably heavier. Further, after impact of the laser beam on the target, a plasma made up of extracted charged particles forms in front of it, absorbing part of the energy of the next laser shot (Figure 13.7, right). The induced pressure level is therefore attenuated after each laser shot. A system of ventilation or aspiration can be used for the evacuation of this plasma [MAL 00].
Figure 13.7. Modification of the induced signal due to the ablation of a volatile target submitted to 1Hz laser shots (left) and due to the formation of a plasma in front of a volatile target (right) [MAL 00] (a.u. = arbitrary units)
13.6. Examples of use of the method
Figures 13.8 and 13.9 report a few examples of measurements carried out on different types of solid insulators.
Figure 13.8. Left: evolution of a space charge in low density polyethylene (V=50 kV, T=20°C, d=1 mm) [MAL 96]. Right: evolution of the total accumulated charge in XLPE and LDPE polyethylenes as a function of the applied voltage and frequency (20 kV peak sine voltage; T=60°C) [FAN 01]

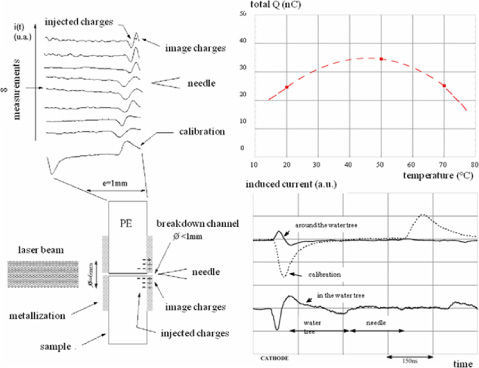
Figure 13.9. Left: “Post mortem” measurements of the space charge in polyethylene insulators broken under a 50 Hz sine voltage [MAL 05]; top right: evolution of the total charge accumulated in a silicone gel (encapsulation) of a high-voltage transistors module versus temperature [BRE 02]; bottom right: measurement of the space charge formed in a water tree [MAL 96]
13.7. Use of the LIPP method for surface charge measurement
In certain conditions, the LIPP measurement technique is also applicable to the determination of surface charges, as proposed by [ALQ 82], which opens its application field to the electrostatic domain [MAL 04] and the study of partial discharges [MAL 99], [MAL 02].
13.8. Perspectives
The LIPP method is currently widely used in the study of low and high-voltage insulators, electrets, piezoelectric and pyroelectric materials. In addition to these classic uses, this technique is being developed in the domain relative to surface charges (electrostatic, partial discharges, etc.). Further, it was recently validated for the study of semi-conductors [HOL 04]. Its strong potential therefore traces a future for the method just as successful as the past 20 years have been.
13.9. Bibliography
[AND 70] ANDERHOLM N.C., “Laser-generated stress waves”, Appl. Phys. Lett., vol. 16, no. 3, p. 113–115, 1970.
[AIN 99] AÏNOUCHE L., ALQUIÉ C., “Application of the pressure wave propagation method for adhesion defects detection and quantification in balayer structures”, J. Appl. Phys., vol. 86, no. 2, p. 1156–1166, 1999.
[ALQ 81] ALQUIÉ C., DREYFUS G., LEWINER J., “Stress wave probing of electric field distributions in solid dielectrics”, Phys. Rev. Lett., vol. 47, no. 20, p. 1483–1487, 1981.
[ALQ 82] ALQUIÉ C., CHARPAK G., LEWINER J., “Pulsed laser determination of surface electric charge distribution”, Journal de Physique-Lettres, vol. 43, p. no. 19, 687–693, 1982.
[ALQ 83] ALQUIÉ C., Détermination de la distribution du champ électrique par perturbation locale induite par laser, PhD thesis, Pierre and Marie Curie University, Paris, 1983.
[BER 95] BERT C., HENNION C., LEWINER J., ALQUIÉ C., HAMPTON N., FREESTONE J., VERNE S., “Measurement of space charge distributions under 50Hz AC electric stresses using the LIPP method”, Proceeding of the 4th International Conference on Insulated Power Cable, p. 95–98, SEE Edition, June 25–29, Versailles, France, 1995.
[BIR 76] BIRAUD Y.G., “Les méthodes de déconvolution et leurs limitations fondamentales”, Revue de Physique appliquée, vol. 11, no. 2, p. 203–206, 1976.
[BOU 87] BOUILLIER G., Etude d’une méthode de mesure des distributions de charges électriques dans des structures métal-isolant-semiconducteur, PhD thesis, Pierre and Marie Curie University, Paris, 1987.
[BRE 02] BREIT F., MALEC D., LEBEY T., “Investigations on DC conductivity and space charge in silicone gel”, Proceeding of the Conference on Electrical Insulation and Dielectric Phenomena, p. 48–51, IEEE Edition, October 20–24, Cancun, Mexico, 2002.
[DAR 80] DARMON D., Etude d’une méthode de détermination des potentiels dans un diélectrique, PhD thesis, Pierre and Marie Curie University, Paris, 1980.
[DER 94] DE REGGI A.S., “Effects of the measuring circuit on broadband piezo and pyroelectric measurements”, IEEE Trans.Diel.Elec.Ins., vol. 1, no. 1, p. 146–152, 1994.
[DIT 90] DITCHI T., Perfectionnement de la méthode de l’onde de pression. Application à l’étude des structures isolantes à base de polyéthylène, PhD thesis, University of Paris VI, Paris, 1990.
[DIT 93] DITCHI T., ALQUIÉ C., LEWINER J., “Broadband determination of ultrasonic attenuation and phase velocity in insulating material”, J. Acoust. Soc. Am., vol. 94, no. 6, p. 3061–3066, 1993.
[DRE 73] DREYFUS G., LEWINER J., “Electric fields ad currents due to excess charges and dipoles in insulators”, Phys. Rev. B, vol.8, no. 6, p.3032–3036, 1973.
[FAIR 74] FAIRAND B.P., CLAUER A.H., JUNG R.G., WILCOX B.A., “Quantitative assessment of laser-induced stress waves generated at confined surfaces”, Appl. Phys. Lett., vol. 25, no. 8, p. 431–433, 1974.
[FAN 01] FANJEAU O., Etude de la formation des charges d’espace dans les isolants pour câbles d’énergie sous champ électrique alternatif 50Hz, PhD thesis, University of Paul Sabatier, Toulouse, 2001.
[HO 02] HO Y.F.F., CHEN G., DAVIES A.E., SWINGLER S.G., SUTTON S.J., HAMPTON R.N., HODBELL S., “Measurement of space charge in XLPE under a 50Hz AC stress”, IEEE Trans. Diel. Elec. Ins., vol. 9, no. 3, p. 362–370, 2002.
[HOL 04] HOLÉ S., LEWINER J., “Direct measurement of trapped and free charges distributions in semiconductors”, Appl. Phys. Lett., vol. 84, no. 8, p. 1308–1310, 2004.
[LAU 76] LAURENCEAU P., BALL J., DREYFUS G., LEWINER J., “Une méthode nouvelle de détermination de la distribution spatiale des potentiels dans les diélectriques”, C.R. Acad.Sc., vol. 283, no. 8, p.135–138, 1977.
[LAU 77] LAURENCEAU P., DREYFUS G., LEWINER J., “New principle for the determination of potential distributions in dielectrics”, Phys.Rev.Lett., vol. 38, no. 1, p.46–49, 1977.
[MAH 91] MAHDAVIS., ALQUIÉ C., LEWINER R J., “Mesure directe de la charge d’espace dans les câbles à isolation synthétique par la méthode de l’onde de pression”, Proceeding of the 3rd International Conference on Insulated Power Cable, p. 534–541, SEE Edition, June 24–28, Versailles, France, 1991.
[MAL 96] MALEC D., Etude du rôle des charges d’espace dans la rupture diélectrique des isolants solides par la méthode d’onde de pression induite par impact laser: réalisation technologique et étude théorique, PhD thesis, University of Paul Sabatier, Toulouse, 1996.
[MAL 99] MALEC D., LEBEY T., “Coupled measurements of partial discharges and space charge in a polyethylene model sample under a 50Hz AC field”, Proceeding of the Conference on Electrical Insulation and Dielectric Phenomena, p. 235–238, IEEE Edition, October 17–20, Austin, USA, 1999.
[MAL 00] MALEC D., “Technical problems encountered with the laser induced pressure pulse method in high voltage cable insulators studies”, Meas. Sci. Technol., vol. 11, no. 5, p. N76–N80, 2000.
[MAL 02] MALEC D., LEBEY T., “Laser induced pulse as a tool to determine surface charges in inhomogeneous (solid–gas) dielectric”, Appl. Phys. Lett., vol. 80, no. 8, p. 1421–1423, 2002.
[MAL 04] MALEC D., “Study of static electricity using the laser induced pressure pulse method”, Meas. Sci. Technol., vol. 15, no. 1, p. N1–N5, 2004.
[MAL 05] MALEC D., MARY D., FANJEAU O., “Relationship between charge injection and dielectric breakdown of polyethylene”, Proceeding of the Conference on Electrical Insulation and Dielectric Phenomena, p. 67–70, IEEE Edition, October 16–19, Nashville, USA, 2005.
[MAX 72] MAS J., Traitement du signal, Masson, Paris, 1972.
[QIN 99] QIN X., SUZUKI K., TANAKA Y., TAKADA T., “Three-dimensional space charge measurement in a dielectric using the acoustic lens and PWP method”, J. Phys. D: Appl. Phys., vol. 32, no. 2, p. 156–160, 1999.
[ROZ 79] ROZNO A.G., GROMOV V., “Measurement of the space charge distribution in a solid dielectric”, Phys. Rev. Lett., vol. 5, no. 5, p. 266–267, 1979.
[SES 81] SESSLER G.M., WEST J.E., GERHARD-MULTHAUPT R., “Measurement of charge distribution in polymer electrets by a new pressure pulse method”, Polym. Bull., vol. 6, no. 1–2, p. 109–111, 1981.
[VON 77] VON GUTFELD R.J., MEICHER R.L., “20Mhz acoustic waves from pulsed thermoelastic expansions of constrained surfaces”, Appl. Phys. Lett, vol. 30, no. 6, p. 257– 259, 1977.
[WHI 63] WHITE R.M., “Elastic wave generation by electron bombardment or electromagnetic wave absorption”, J. Appl. Phys., vol. 34, no. 7, p. 2123–2124, 1963.
[YAN 74] YANG L.C.,”Stress waves generated in thin metallic films by a Q-switched ruby laser”, J. Appl. Phys., vo. 45, no. 6, p. 2601–2608, 1974.
1 Chapter written by David MALEC.