Chapter 16
ATM Volatility and Correlation
Correlation is an important measure within FX derivatives. The ATM volatility and correlation framework is often used to calculate ATM volatility in cross-currency pairs. Dephased vega exposures are also calculated within the same framework.
ATM Volatility Triangles
In trigonometry, the cosine rule relates the lengths of sides of a triangle to the cosine of one of its angles as shown in Exhibit 16.1. If the length between point A and point B is denoted AB, the cosine rule states that:

Exhibit 16.1 Cosine rule triangle
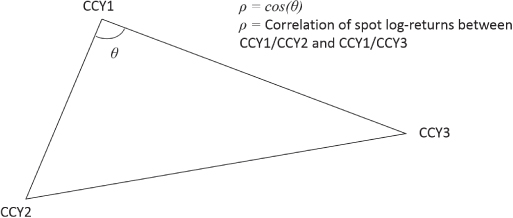
The cosine rule can also be applied to ATM implied volatility in three currency pairs at the same tenor as shown in Exhibit 16.2. The distance between EUR and USD represents EUR/USD ATM volatility; the longer the length, the higher the ATM volatility. The angle θ is the inverse cosine (![]() ) of the correlation (ρ) between spot log returns in EUR/USD and GBP/USD. Going forward, ρ is described as the correlation between the major currency pairs (EUR/USD and GBP/USD in this example) and the output pair (EUR/GBP) is called the cross-currency pair. Beware of the overlap in symbols between correlation and rho exposure (see Chapter 14); the correct meaning should be obvious from the context.
) of the correlation (ρ) between spot log returns in EUR/USD and GBP/USD. Going forward, ρ is described as the correlation between the major currency pairs (EUR/USD and GBP/USD in this example) and the output pair (EUR/GBP) is called the cross-currency pair. Beware of the overlap in symbols between correlation and rho exposure (see Chapter 14); the correct meaning should be obvious from the context.

Exhibit 16.2 ATM implied volatility triangle
A proof that this transformation from trigonometry to ATM volatility is valid can be found in Iain J. Clarke's book, Foreign Exchange Option Pricing: A Practitioners Guide (John Wiley & Sons, 1st Edition, 2010).
The cosine rule for ATM volatilities is therefore, for example,
Rearranging:
These formulas can be used to calculate the ATM volatility in cross-currency pairs where a limited number of contracts are traded in the interbank broker market. The framework can also be used to calculate an implied correlation from three ATM volatilities.
Example: Calculating 1mth AUD/CAD ATM:
Therefore:

Note that the negative correlation is used in the formula to take the currency pair quotation order into account. The formula takes correlation between AUD/USD and CAD/USD (the common currency as CCY2 in both cases). However, since the market quotes AUD/USD and USD/CAD, the negative of the correlation is used.
When correlation is an input to the formula, it is often not straightforward to determine what value to use. The implied correlation between tenors is often fairly consistent so interbank broker prices in the cross-currency at other tenors could be used to calculate it. If market prices are not available, traders often assess the historical spot correlation using different sample windows, and then take an average adjusted for any strong recent trend in the data as per Exhibit 16.3.

Exhibit 16.3 Realized AUD/USD versus USD/CAD historical spot correlation
If correlation is more unstable, this implies that a wider bid–offer spread should be applied in the cross-currency pair.
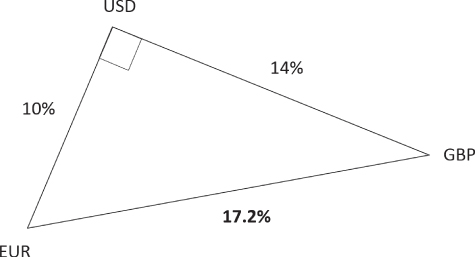
The triangle representation of implied ATM volatilities explains the link between cross volatility and correlation. If the correlation between major pairs is 0%, the angle within the triangle is 90 degrees (cos−1 0 = 90o). This is shown in Exhibit 16.4. Note that the cosine rule reduces to Pythagoras's Theorem in this case.

Exhibit 16.4 ATM implied volatility with zero correlation
As the correlation between major pairs goes higher, the angle within the implied volatility triangle tightens as per Exhibit 16.5.

Exhibit 16.5 Correlation and inverse cosine function
As the angle tightens, with the major lengths remaining constant, the cross-currency ATM volatility (EUR/GBP) reduces as shown in Exhibit 16.6.

Exhibit 16.6 ATM implied volatility triangle with correlation above zero
If the correlation is 100%, the angle is 0 degrees and the lines will be on top of each other as shown in Exhibit 16.7. Put another way, when EUR/USD and GBP/USD spots move perfectly together the cross-currency pair EUR/GBP will be static.

Exhibit 16.7 ATM implied volatility triangle with 100% correlation
If EUR/USD and GBP/USD ATM volatilities are not equal but their correlation is 100%, the cross-volatility formula breaks due to square-rooting a negative value. In effect, ATM implied volatility levels create bounds on the correlation.
As the correlation between major pairs goes lower, the angle widens and the major lengths stay constant; hence the cross-ATM volatility increases as shown in Exhibit 16.8.

Exhibit 16.8 ATM implied volatility triangle with correlation below zero
If the correlation between major pairs is –100%, the angle is 180 degrees and the cross ATM volatility is the sum of the two major ATM volatilities since –100% correlation implies EUR/USD and GBP/USD spots move in perfectly opposite directions as shown in Exhibit 16.9.

Exhibit 16.9 ATM implied volatility triangle with –100% correlation
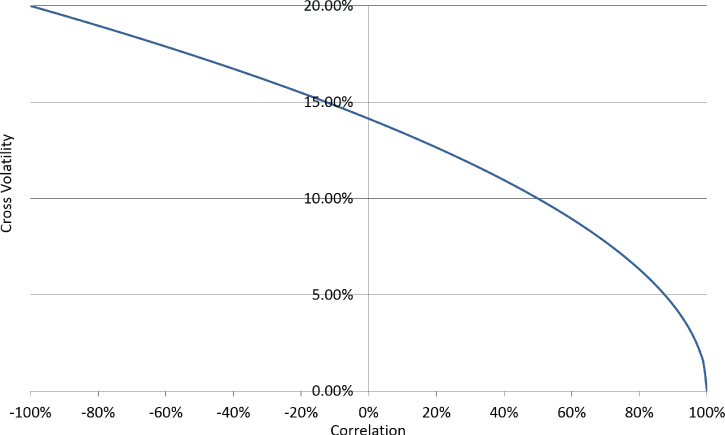
If EUR/USD ATM volatility is 10% and GBP/USD ATM volatility is 10%, the relationship between correlation and cross volatility is shown in Exhibit 16.10.

Exhibit 16.10 Cross-currency ATM volatility versus correlation profile
This is a key result: Correlation and cross volatility move in opposite directions:
- Higher correlation between major pairs → tighter angle in ATM volatility triangle → lower cross volatility
- Lower correlation between major pairs → wider angle in ATM volatility triangle → higher cross volatility
In practice, this framework is often used to generate ATM curves in cross-currency pairs using the ATM curves in the two major currency pairs and a term structure of implied correlation maintained by traders. Within this framework it is important to correctly adjust for events. For example, if EUR/USD and AUD/USD ATM at the same tenor are both raised due to an important USD event, the EUR/AUD ATM should disregard the effect of the USD event.
Dephased Vega
The same ATM volatility triangle framework can be also used to calculate dephased vega exposures. Dephasing is a term from physics that roughly means “shifting an exposure into its core constituents.”
For example, the vega on a EUR/AUD contract can be split into equivalent EUR/USD and AUD/USD vega exposures plus an exposure to the EUR/USD versus AUD/USD correlation. This transformation is particularly useful in less liquid cross-currency pairs or when risk in many currency pairs is being considered simultaneously. Usually the cross pair is split into two USD pairs but this is not always the case; for example, USD/PLN would most naturally be split into EUR/USD and EUR/PLN.
Within the dephasing calculation, the system of ATM volatilities and correlations is kept constant except for one element, which is flexed. Given two major currency pairs, CCY1/CCY2 and CCY1/CCY3, and a vega exposure in the cross currency pair: CCY2/CCY3, as shown in Exhibit 16.11:
 only is flexed a small amount and the impact on
  is calculated; that is, one major ATM volatility is flexed and its impact on the cross-ATM volatility is measured using:
  . The magnitude of
  therefore depends on the correlation between pairs CCY1/CCY2 and CCY2/CCY3. The higher the correlation, the more CCY2/CCY3 cross vega will dephase into CCY1/CCY2 vega.
 only is flexed a small amount and the impact on
  calculated; that is, the other major ATM volatility is flexed and its impact on the cross-ATM volatility is measured using
  . The magnitude of
  therefore depends on the correlation between pairs CCY1/CCY3 and CCY2/CCY3. The higher the correlation, the more CCY2/CCY3 cross vega will dephase into CCY1/CCY3 vega.
- The sensitivity to changes in correlation ρ is also calculated. The major ATM implied volatilities (
 and
and  ) are held constant and hence the dephased correlation causes a change in the cross-ATM volatility (
 ) only, which changes contract values.

Exhibit 16.11 ATM implied volatility triangle
Example: Consider 1yr EUR, USD, and CNH ATM volatility. USD/CNH has a low ATM volatility and the correlation between EUR/USD and USD/CNH is small negative. Therefore, EUR/CNH has an ATM volatility similar to EUR/USD as shown in an ATM volatility triangle in Exhibit 16.12.

Exhibit 16.12 1yr ATM implied volatility triangle containing EUR, USD, and CNH
The sharpness of the angle at ![]() shows the high correlation (95%) between EUR/USD and EUR/CNH. Therefore, the majority of EUR/CNH vega will dephase into EUR/USD rather than USD/CNH as shown in Exhibit 16.13. Note that the dephased vegas do not necessarily sum to equal the cross vega.
shows the high correlation (95%) between EUR/USD and EUR/CNH. Therefore, the majority of EUR/CNH vega will dephase into EUR/USD rather than USD/CNH as shown in Exhibit 16.13. Note that the dephased vegas do not necessarily sum to equal the cross vega.

Exhibit 16.13 Dephased vegas from a 1yr EUR/CNH vega exposure
Managing Cross-Currency Positions
It is important that traders understand how to manage exposures in cross-currency pairs. Sometimes, exposures are moved directly into more liquid currency pairs. For example, in the above EUR/USD/CNH example, the EUR/CNH Greek exposures might be viewed as EUR/USD exposures, in effect assuming that USD/CNH doesn't move (a fairly reasonable assumption given the low implied volatility in USD/CNH).
When managing cross-currency positions, traders often transact delta hedges and then split the risk into two separate currency pairs. For example, if the JPY trader is long EUR/JPY delta and short CHF/JPY delta, they may sell EUR/CHF spot and split it into short EUR/JPY and long CHF/JPY spot trades, with offsetting JPY amounts.
Gamma positions in cross-currency pairs produce deltas that are often hedged in the major currency pairs for convenience or due to larger spot bid–offer spreads in cross-currency pairs. Consider a long EUR/CAD gamma position. If EUR/USD spot moves higher in isolation, EUR/CAD gets pulled higher and EUR/CAD gets longer delta from the long gamma. This is equivalent to getting longer EUR/USD delta and longer USD/CAD delta so spot can be sold in both major currency pairs to rebalance the deltas.
If USD/CAD goes higher in isolation, again, EUR/CAD gets pulled higher and EUR/CAD gets longer delta from the long gamma. This is equivalent to getting longer EUR/USD delta and longer USD/CAD delta so spot can be sold in both major currency pairs to rebalance the delta.
Risk managing cross-gamma positions becomes a multidimensional problem when the exposures are moved into the major currency pairs. Continuing the EUR/CAD example, the USD/CAD delta is no longer driven only by USD/CAD spot; it now also depends on EUR/USD spot. Therefore, it is no longer sufficient to view, e.g., USD/CAD delta as a single number. It should be ideally viewed as a two-dimensional grid for changes in both EUR/USD spot and USD/CAD spot. This is very similar to how multi-asset exotic contracts are risk managed (see Chapter 30).
