4
Overview of Drilling and Hydraulic Fracture Stimulation Techniques for Tight Oil and Gas Shale Formations
4.1 Introduction
The development of extended and accurate horizontal drilling and high‐volume hydraulic fracturing (HVHF) stimulation techniques with specialized chemicals is directly related to the types of geologic targets and production methods needed to extract unconventional petroleum deposits. Unconventional petroleum resources allow for reconsidering aspects focused on for conventional oil and gas plays: the natural processes of biomass accumulation and burial, hydrocarbon generation, expulsion and migration of the hydrocarbons, entrapment, and alteration. A variety of unconventional and alternative energy resources have entered the marketplace in recent years, competing aggressively with conventional fuels such as coal, and oil and gas, produced from conventional reservoirs (Lehr and Keeley 2016). Some of the more common unconventional hydrocarbon resources are:
- Oil sands: Extra heavy crude oil or crude bitumen trapped in unconsolidated sands. Examples include the Athabasca Basin tar sands in the McMurray Formation, Alberta, Canada, and the Orinoco Basin heavy oil belt in Venezuela. Oil sands are extracted using surface mining and in situ steam‐assisted gravity drainage (SAGD), and significant post‐extraction processing is required, which is energy intensive.
- Oil shale: Organic‐rich shales and fine‐grained rocks containing significant volumes of kerogen. Oil shale is extracted in open‐pit mines and in situ. An example of oil shale is the thick deposits of the Piceance Basin, which were historically mined as the Colony Shale Oil Project near Parachute Creek, Colorado. Southwestern Wyoming, northwestern Colorado, and northeastern Utah host some of the largest deposits of oil shale in the world, which formed in lake basins in the early Cenozoic. One such lacustrine oil shale is the Eocene Green River Formation. Significant post‐extraction processing is required, which is energy intensive. The oil shale is heated up to about 932 °F (about 500 °C) in the absence of oxygen as part of the energy‐intensive post‐extraction processing.
- Natural gas hydrates: Called methane clathrate and methane hydrate, this unconventional hydrocarbon resource consists of methane (CH4) trapped within the crystal structure of water, forming a solid similar to ice. Significant deposits on Earth have been identified under sediments on the ocean floors. Extraction is technically difficult and environmentally risky, with depressurization, thermal injection, and inhibitor injection methods being considered.
- Coalbed methane (CBM): Natural gas associated with coal seams. Removal of methane prior to mining has been ongoing for decades (Elder and Deul 1974; Levine 1993; Rice 1993). A common method of extraction, hydraulic fracturing, and horizontal wells has been designed for CBE projects to maximize the intersections of the natural fractures found in coal. Water is coproduced with the methane. In the early 1980s, methane was extracted from the bituminous coalbeds in the Black Warrior Basin in Alabama. Other areas of coalbed methane include the San Juan Basin and Raton Basin in Colorado and New Mexico and the Powder River Basin in Wyoming.
- Residual oil zones (ROZs): When large paleo traps of crude oil are regionally tilted, crude oil and natural gas can migrate updip, leaving residual oil saturation trapped below the current water zone. Well‐documented ROZs exist in the Permian Basin in west Texas in the San Andres dolomites (Vance 2011) as well as near Prudhoe Bay on the North Slope of Alaska. The fairways between oil fields can also contain ROZs. ROZ formations, which are now a target for unconventional oil production, appear in cores and geophysical logs as a partially produced oil field with a portion of residual oil left in place. Initial production of ROZs requires enhanced recovery technologies such as secondary recovery waterflood methods, or tertiary recovery carbon dioxide injection, and other techniques. ROZs are frequently produced in areas with (i) existing oil production infrastructure and (ii) a large number of existing wells and geologic data, which lowers the exploration risk of a dry hole. The unconventional oil and gas production methods of horizontal drilling combined with high‐volume hydraulic fracturing using specialized chemicals can be used with ROZ production targets (McEwen 2015). More information about ROZs is described below.
- Biogenic gas: Methane commonly formed at shallow depths and low temperatures, generally <167 °F (<75 °C) by anaerobic microbial decomposition of sedimentary organic matter. Natural biogenic deposits occur in the Cook Inlet, Alaska, West Siberian basin, Russia, and the Po Valley, Italy. Landfills also generate large quantities of biogenic gas from anthropogenic sources associated with the anaerobic decomposition of municipally collected organic wastes. Capping of landfills and extraction of the landfill methane using piping systems and blowers have become profitable in some settings.
- Other unconventional hydrocarbon accumulation systems: Although uncommon, unusual hydrocarbon accumulations in unconventional reservoirs located in rare geologic settings can exist (Zou et al. 2013):
- Fracture‐cavity carbonate gas and oil.
- Volcanic pore‐fracture gas and oil.
- Metamorphic fracture gas and oil.
- Tight oil: Light to medium crude oil trapped in shales and low‐permeability sands require hydraulic fracture stimulation, horizontal drain holes, and specialized extraction chemicals to extract. The Bakken Formation in the Williston Basin in North Dakota, Montana, Saskatchewan, and Manitoba is an example.
- Tight gas: Gas produced from regional sandstones and carbonate reservoirs with low porosity. These reservoirs contain the gas that migrated into the tight formation generally having <0.1 millidarcy (mD) matrix permeability and <10% matrix porosity but were sourced from other formations (Law and Curtis 2002; Law and Spencer 1993; Sharif 2007). Horizontal drilling has been used successfully to extract the tight gas. Zones within the Mesaverde Group in the Piceance Basin in Colorado are tight gas formations.
- Shale gas: Thermogenic methane and natural gas in black shales with high organic content. The extraction of the shale gas requires hydraulic fracture stimulation, horizontal drain holes, and specialized extraction chemicals. The example is the Marcellus Formation in Pennsylvania and several other states within the Appalachian Basin.
A review of unconventional hydrocarbon resources suggests that there is high variability in the economics and potential of these energy sources. The energy required for extraction and production of these resources varies, as well as the associated environmental issues. This chapter focuses on horizontal drilling, HVHF stimulation, and the production of tight oil and shale gas from horizontal drain holes using hydraulic fracture stimulation methods and specialized extraction chemicals; associated topics include the geophysical data acquisition, drilling, hydraulic fracturing, and oil and gas production activities.
4.1.1 Overview of the Exploration–Production Life Cycle
Before oil or gas production starts, an unconventional geologic prospect in the Marcellus Formation or Bakken Formation was already developed by geologists and engineers supported by field activities: geophysical surveying, area‐wide leasing, drill pad construction and rig mobilization, well drilling, HVHF stimulation, and well completion. This chapter describes the activities and technologies involved with the exploration and production of specific unconventional petroleum resources: tight oil and shale gas.
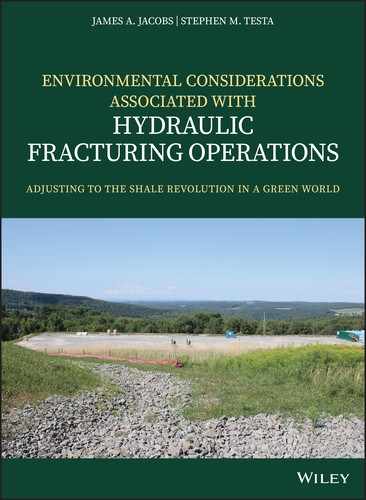
A three‐dimensional (3D) visualization of the production well in the tight oil Bakken Formation in the Williston Basin in North Dakota (Figure 4.1) shows the horizontal well production and a significant depth of the reservoir about 9 000 ft (2 743 m) to 10 000+ ft (3 048+ m) from the surface. The timing of the entire exploration–production life cycle is estimated to be about 45 years for the Bakken Formation (Figure 4.2). This figure also shows the length of time required for the HVHF stimulation operations, which is about two weeks to two months. Compared with a potential oil production period of 45 years (540 months), the duration of the initial fracking operations is 0.37% of the total exploration–production life cycle. Even though oil production for the Bakken example (Figure 4.2) declines rapidly from an initial high of 904 barrels per day (bpd) to <50 bpd in about 48 months, the total oil production is projected to last for decades. As oil production declines, water production increases greatly.

Figure 4.1 Example from the Bakken Formation in North Dakota shows the isolation of overburden from the target zone. A close‐up shows the perforations from the production casing into the rock, with the induced fractures. * Devonian‐Mississippian Bakken Formation is broken into the Lower Shale Member, the Middle Bakken Member (sandstone, dolomite, siltstone and shale) and the Upper Shale Member. Most of the Bakken Formation wells are drilled and completed in the Middle Bakken Member.
Source: Modified after EERC/DOE; http://www.undeerc.org/bakken/completiontechnologies.aspx.
Figure 4.2 The estimated timing for operations for well drilling and oil production activities over the next 50 years from the Bakken Middle Member (US DOE 2009).
4.1.2 Phases of Activity
The exploration–production life cycle (Table 4.1) consists of seven phases.
Table 4.1 General project phase and description of unconventional oil and gas production activities.
| Phase no. | Description |
| Phase 1 | Prospect generation (geochemistry studies and geophysical surveys) |
| Phase 2 | Planning (lease acquisition and site preparation) |
| Phase 3 | Drilling |
| Phase 4 | Well completion and hydraulic fracture stimulation |
| Phase 5 | Fluid recovery and waste management |
| Phase 6 | Oil and gas production |
| Phase 7 | Well abandonment and site restoration |
For unconventional resource exploration, the process starts with developing an overall geologic concept for the oil or gas prospect (Table 4.2).
Table 4.2 Project phase and description of unconventional oil and gas production activities and approximate duration.
| Project phase | General description | Approximate durationa |
| 1. Prospect generation | Development of unconventional hydrocarbon accumulation prospect (tight oil or shale gas) | 3 to 12+ months |
| 2. Planning | 10 to 12+ months | |
| 2a. Pre‐drilling | Geophysical surveys | 3 to 12+ months |
| 2b. Lease acquisition | Land surveys; acquire leases; hold public meetings; prepare environmental impact report; permitting | 6 to 12+ months |
| 2c. Site preparation | Build drill pad and access roads and construct mud pit | 1+ month |
| 3. Drilling | Mobilize rig and drill prospect; collect core samples and fluid samples; run casing and cement; drill to target | 1–2 months |
| 4. Well completion and high‐volume hydraulic fracturing (HVHF) stimulation | Set up water tanks, pumps, blenders, command center, and other equipment. Transport water, chemicals, and proppant to site. Run production casing, install wellhead, test well, perforate casing, if needed, and perform hydraulic fracture stimulation (injection of fracturing fluids in multiple stages); removal of equipment | 1–2 weeks for hydraulic fracture stimulation |
| 5. Fluid recovery and waste management | Recovery, storage, and treatment or reuse or disposal of flowback fluids. Collect on‐site in lined pits, or better, tanks, and recycle or dispose of waste fluids properly | Most of the flowback fluids return to the wellhead in 7–10 days while the remaining flowback fluids are produced within 3–4 weeks. Eventually flowback fluid is replaced by formation oil and gas and produced water |
| 6. Oil and gas production | Install piping or tanks for storage and transportation of produced oil and gas. After initial production, use enhanced oil or gas recovery techniques and workovers to optimize production | 5 to 45+ yearsb |
| 7. Well abandonment and site restoration | Destroy well and restore site | 1–2 months: well destruction (2–4 weeks); site restoration (2–4 weeks) |
a Specific projects will vary based on regulatory requirements, community issues, availability of subcontractors, and other factors.
b Longevity of production is affected by many factors.
Many unconventional oil and gas resources reside in basin‐wide, continuous petroleum accumulations within rock, which coexists as both source and reservoir. Pore throats for generally tight formations which are common to unconventional resources are estimated to be nanometer sized. For comparison, a clean, well‐sorted sandstone as might be found in a conventional reservoir (Magoon and Dow 1994) would have millimeter‐sized to micrometer‐sized pore throats (Zou et al. 2013). Permeabilities are measured in the porous portion of the rock. Shales and fine‐grained rocks have natural fractures and microfractures, and hydraulic fracture stimulation opens these fractures and initiates new interconnected fractures to allow petroleum hydrocarbons to drain from the horizontal wells.
The smaller pore size in the coexisting source and reservoir rock of the unconventional oil and gas prospect will not allow petroleum to naturally flow from these rocks without advanced drilling and complex extraction methods. Horizontal wells and large‐scale hydraulic fracturing are needed to develop unconventional petroleum deposits. The hydraulic fracturing creates or enhances existing fractures, providing connected flow pathways in the rocks combined using water under high pressure, with a minute amount of specialized chemicals and fine‐grained proppants.
Hydraulic fracture stimulation is required for low‐permeability to extremely tight rocks (Figure 4.3) with a permeability of <1 millidarcy (mD) or ~1 μm2. Some conventional reservoirs with larger permeability values can optimize production using horizontal well technology to increase the net reservoir thickness and the hydraulic fracture stimulation to reduce formation damage and increase hydrocarbon flow into the well.

Figure 4.3 Generalized permeability range of oil and gas producing formations for unconventional and conventional reservoirs.
4.2 Phase 1: Prospect Generation for Unconventional Oil and Gas Targets
Oil and gas prospecting starts with a geologic concept about a prospective area. For conventional petroleum reservoirs, a structural or stratigraphic trap (Berg 1986) is needed to contain the crude oil or gas. For unconventional oil and gas targets, the deep, typically anoxic deep marine basin sediments are the source rocks, and through hydraulic fracturing, they also become the reservoir rocks.
An example of a conventional oil field where the source rock and the brittle and naturally fractured reservoir rock lie within the same geologic formation is the unusually prolific Miocene Monterey Formation in California. This formation is both the primary source rock and the primary reservoir rock in several oil and gas fields, notably, the Cat Canyon, Lompoc, and Orcutt Oil Fields in the Santa Maria Basin. Nearby, the offshore Point Arguello Field in southern California also produces from the Monterey Formation. The source rock potential of the Monterey Formation is seen in natural oil seeps all along the California coast where the rocks are exposed or have contact with the surface. A northern California seep from the Monterey Formation is visible at Point Arena, California (Figure 4.4). The Monterey is a prolific tight oil source rock for significant California oil production and also serves as both source and reservoir rock in some fields in southern California.

Figure 4.4 Naturally occurring heavy oil seeps from the Miocene Monterey Formation exposed at the beach in Point Arena in northern California show an immature oil source rock.
Source: Image from James Jacobs.
The kerogen type, burial history, and other factors affect the type of petroleum produced. In many deep sedimentary basins, thermogenic gas is produced as the petroleum is well below the oil window and breaks down into methane, as in the case of the Marcellus Formation in the Appalachian Basin. In the Bakken Formation in the Williston Basin, oil is produced. Once the prospect for an unconventional target has been developed, the planning phase is implemented.
4.2.1 Unconventional Resource Prospecting
In the past, tight, organic‐rich shale deposits were viewed as potential source rocks for conventional hydrocarbon reservoirs. Now these same formations are being seen for their huge potential for in situ oil and gas production. The natural permeability of shales is on the order of a few hundred nano‐darcies (0.0001 md) to a few millidarcies (0.001 md), and the efficient recovery of the oil held in the shale matrix requires long horizontal wells to drain the hydrocarbons and intensive well stimulation completion techniques using hydraulic fracturing and specialized chemicals to recover the oil and gas.
The economics of an oil or gas prospect relates to the volume of recoverable hydrocarbons that are present, the costs of extraction, and the associated economics of conveying the extracted oil and gas to customers. For the unconventional prospect, the volume and maturity of the total organic carbon is evaluated as well as the ability to create an effective fracture network within the reservoir to drain the oil and gas from the source rock. The ability to fracture the reservoir for an unconventional oil or gas prospect relies on the brittleness of the rock formation. Detailed lithology, mineralogy, and directionality of the natural in situ rock stresses also require study to optimize production (Holden et al. 2013). Creating hydraulic fractures that are perpendicular to existing natural fractures allows for maximum fracture connectivity near the well. A detailed technical assessment requires several key steps (US EIA 2013).
4.2.2 Geologic and Reservoir Study
Prospecting involves conducting preliminary geologic and reservoir characterization of potential shale basins and formations:
- Depositional environment of shale (marine versus nonmarine).
- Depth (to top and base of shale interval).
- Porosity and permeability.
- Regional fracture orientation and continuity.
- Ability of the target zone to be fractured.
- Structure, including major faults.
- Regional and local fracture systems.
- Gross shale interval.
- Reservoir pressure and temperature.
- Burial history.
- Specific formation thickness within each zone in well.
- Organically rich gross shale thickness in well.
- Total organic content (TOC) by weight.
- Thermal maturity‐the proxy is vitrinite reflectance (Ro).
4.2.3 Evaluation of Areal Extent
The prospect is refined by establishing the areal extent of the major shale gas and shale oil formations. In many deep basins, there might be several prospective zones:
- Evaluate technical literature as to regional and local geologic cross sections and basin studies.
- Generate new cross sections and basin maps based on published information and proprietary data.
4.2.4 Site‐Specific Technical Details
The next phase in unconventional prospect generation requires developing technical details for the specific area and the associated geochemical and geological conditions for each shale gas and shale oil formation within the basin:
- Evaluating the depositional environment for promising conditions (lowers risks).
- Depth criteria for the prospective area (generally >3 300 ft (1 006 m) and <16 500 ft (5 029 m)). Prospects deeper than 16 500 ft (5 029 m) that have lower permeability likely have higher drilling and production costs (raises risks).
- Higher reservoir pressures help drive oil and gas recovery (lowers risks).
- Presence of site‐specific TOC (>2%) and carbon type (types I and II) (lowers risks).
- Optimum thermal maturity (lowers risks).
- Site‐specific geographic location in geologically stable area with easy access to oil and gas conveyance system (lowers risks).
- Identify less prospective areas, high grading certain areas (lowers risks).
- High clay content in nonmarine shales from lacustrine or fluvial settings, which are more ductile and generally less responsive to hydraulic fracturing (increases risks).
- High geologic complexity with thrusts and high lateral reservoir stress (increases risks).
4.2.5 Geochemistry and Basin History
As the conversion of sediments into sedimentary rocks occurs, organic matter is turned into kerogen through diagenesis. Diagenesis of kerogen takes place generally at <2 km or 60 °C, and most of the hydrocarbon production is microbially produced methane, also called biogenic gas.
Kerogen, a precursor to petroleum compounds and bitumen, consists of organic matter, which is generally insoluble and is formed under low pressure and low temperature conditions in shallow sediments and sedimentary rocks. If sediments containing kerogen remain shallow and not deeply buried, the characteristics of the kerogen will generally remain intact (Tissot and Welte 1984).
An early coal and chemical engineer, Dirk Willem van Krevelen (1914–2001) studied kerogen sources and the maturity characteristics and temperature ranges of kerogen and petroleum. Studies of coal grades, spore color index, and vitrinite reflectance (Ro) were also studied by early coal and oil researchers trying to understand hydrocarbon maturation.
Heat causes organic matter in sediments to change into the waxy substance known as kerogen, then into crude oil, and later into natural gas as the temperature increases. Thermal maturity is a measure of the extent to which the organic material has been converted into more mature hydrocarbons. Vitrinite is a type of kerogen, and vitrinite reflectance (Ro, mean value of vitrinite reflectance of vitrinite particles in a sample) is a proxy to thermal maturity. The higher the Ro percentage (measurement in percentage of incident light reflected from vitrinite particles in a sample) value of the rock sample, the higher the maturity (US EIA 2017). Some thermal maturity indicators and associated parameters for the Ordovician Utica Formation in Ohio in the Appalachian Basin in the eastern United States are provided in Table 4.3.
Table 4.3 Maturity indicators for the Ordovician Utica Formation, Ohio.
Source: Unless noted, US EIA (2017)
| Parameter | Oil window | Wet gas window (wet gas) | Dry gas window (dry gas) | Over mature |
| Vitrinite reflectance (Ro)a,b | 0.6–1.1% Ro | 1.1–1.4% Ro | 1.4–3.2% Ro | East of production area, Ro = 4.93% |
| Method of assessment maturity | Ordovician conodonts and bitumen reflectance data | |||
| Temperature (°F; °C) | 140–248 °F 60–120 °C |
212–392 °F 100–200 °C |
Not available | |
| Subsea depth (ft) | −4 000 to −8 000 ft (−1 219 to −2 438 m) | −7 000 to −12 000 ft (−2 134 to −3 658 m) | ||
| General gas/oil ratio (GOR) | <10 000 scf bbl−1 oil from −4 500 to −7 000 ft (−1 372 to −2 134 m) | >10 000 scf bbl−1 oil from −7 000 to −9 500 ft (−2 134 to −2 896 m) | ||
| Total organic carbon (TOC) | 1–3.5% | |||
| Average carbonate content | 25% | |||
The van Krevelen diagram (Figure 4.5a) is used to assess the origin and maturity of kerogen material and petroleum hydrocarbons. The diagram compares two atomic ratios of carbon compounds: the hydrogen index, which is the hydrogen to carbon ratio, is cross‐plotted against the oxygen index, the ratio of oxygen to carbon. Van Krevelen diagrams are used to plot atomic ratios of carbon compounds from individual wells or data from entire basins to identify source materials: algae, plankton, land plants and carbonized materials, and kerogen.

Figure 4.5a An example van Krevelen diagram of kerogen maturation is based on plotting the hydrogen index (H/C) as a function of the oxygen index (O/C) to assess the origin and maturity of kerogen and petroleum hydrocarbons (Kansas Geological Survey 2017).
The main oil generation zone, called the oil/gas window, is dominated by catagenesis (Figure 4.5b). Below the oil window, the thermogenic gas zone, called the gas window, represents the thermal cracking of larger‐chain hydrocarbons by temperature and pressure into hydrocarbon gases, eventually leaving only thermogenic methane and graphite deep in the basin. A burial of sediments with depth chart (Figure 4.6) can be developed from specific well data based on geochemical analysis, spore color index, and vitrinite reflectance (Ro). This US Geological Survey (USGS) plot shows the onset of oil generation, the main oil window zone, and the deeper post‐peak oil generation zone (Pollastro et al. 2013).

Figure 4.5b Diagram showing depth and temperature of kerogen as it is converted into oil and eventually with increased temperature into thermogenic gas.

Figure 4.6 An example of a generalized burial history curve showing the burial of sediments with depth and associated hydrocarbon generation. The USGS chart shows a maximum Bakken Formation burial at about 50 million years ago in a 7969‐ft (2429‐m) ‐deep well in the high maturity Poplar dome area of Roosevelt County, Montana.
Source: Modified after Pollastro et al. (2013).
4.2.6 Unconventional Resource Issues
When developing an unconventional oil or gas prospect, understanding the overall geologic complexity and lithology/mineralogy play a key role in evaluating the potential success. For geologic complexity, extensive faulting in the target shale beds can reduce recovery by limiting the potential productive length of the horizontal well. Both thrust and normal faulting can reduce individual well potential by removing reservoir sections from the adjacent productive zone.
In planning for well design, 3D seismic surveys can provide some information about the location and orientation of fault systems. Faults can also introduce water into the shale matrix, lowering the effective permeability and flow capacity. In compressive tectonic settings, thrust faults are an indication of a basin with high lateral reservoir stress, a feature that can reduce the permeability of the shale matrix and lower flow capacity (US EIA 2013).
Lithology and mineralogy are an indicator of how efficiently the induced hydraulic fractures will be able to drain the reservoir rock. Brittle shales have a high percentage of quartz and carbonate and tend to shatter easily. A vast array of small‐scale hydraulically induced fractures can form during hydraulic fracture stimulation in brittle shales, which create flow paths to drain oil and gas from the reservoir to the wellbore. Low clay content marine shales, which are more common in deep basins, shatter more easily than the high clay content nonmarine shales, which tend to be more ductile and to deform instead of shattering (US EIA 2013). Ternary diagrams showing quartz–calcite–clay ratios are frequently used to classify the mineral content of shales.
4.2.7 Estimating Oil and Gas
Developing the economics of the prospect requires evaluating the prospect risks and estimating oil and gas in place, as well as recoverable oil and gas. Original oil in place (OOIP) and gas in place (GIP) values for shale reservoirs relate primarily to net organically rich shale thickness and oil‐filled porosity or gas‐filled porosity. Other factors include reservoir pressure and temperature, as well as the thermal maturity (Ro) and burial history of the reservoir. Surface volume shrinkage for oil is the volume change oil undergoes when brought to the surface due to dissolved gas coming out of solution at surface pressures. The resource estimation equations are based on Dean (2008).
4.2.8 Original Oil in Place (OOIP)
The imperial unit is measured in stock tank barrels (STB) or in metric units in cubic meters (m3).

where
Imperial:
OOIP in STB
- Rock volume (RV) in acre‐feet = A × h × 7758
- A = drainage area in acres
- H = net pay thickness in feet
- 7758 = imperial rock volume constant: 7758 barrels per acre‐foot (API barrels (bbl); converts acre‐feet to stock tank barrels
- 1/Bo = shrinkage (STB per reservoir barrel)
Metric:
OOIP in m3
- Rock volume (RV) in m3 = A × h × 104
- A = drainage area in hectares
- h = net pay thickness in meters
- 104 = metric rock volume constant
- 1/Bo = shrinkage (stock tank m3 per reservoir barrel)
- A = drainage area of reservoir in acres for English units
- RVC = rock volume constant: 1.0 m3 for metric units
- h = net organically rich shale thickness in feet
- φ = porosity (dimensionless), values from cores, logs, published values, or estimates
- So = porosity filled by oil
- Sg = porosity filled by free gas
- Sw = porosity filled by interstitial water
- Bo = initial formation volume factor
- 1/Bo = shrinkage factor
To calculate recoverable oil volumes, the OGIP is multiplied by a recovery efficiency factor.
4.2.9 Original Gas in Place (OGIP)
The imperial unit is measured in standard cubic feet (SCF) or in metric units in 103 m3 or standard cubic meters (SCM).
For gas reservoirs, the volumetric calculation of the original gas in place (OGIP), also called free gas, is:
Imperial:
where
- Rock volume (acre‐feet) = A × h
- A = drainage area, acres (1 acre = 43 560 ft2)
- h = net pay thickness, feet
- ϕ = porosity, fraction of rock volume available to contain fluids
Metric:
where
- Rock volume (m3) = 104 × A × h
- A = drainage area, hectares (1 ha = 104 m2)
- h = net pay thickness, meters
- φ = porosity, fraction of rock volume available to store fluids
- 1/Bg = gas volume factor in cubic feet per standard cubic feet. Includes gas deviation factor (dimensionless) to adjust for ideal compressibility related to pressure, absolute temperature and volume of the gas.
where
- Ts = base temperature, standard conditions, degree Kelvin (273° + 15 °C)
- Ps = base pressure, standard conditions, (101.35 kPaa)
- Tf = formation temperature, degree Kelvin (273° +°C at the formation depth)
- Pi = initial reservoir pressure, kPaa
- Zi = compressibility at Pi and Tf
- Sg = volume fraction of porosity filled with free gas
- Sw = volume fraction of porosity filled with interstitial water
Imperial:

where
- Rock volume (acre‐feet) = A × h
- A = drainage area, acres (1 acre = 43 560 ft2)
- h = net pay thickness, feet
- ϕ = porosity, fraction of rock volume available to contain fluids
- Sw = volume fraction of porosity filled with interstitial water
- Ts = base temperature, standard conditions, degree Rankine (460° + 60 °F)
- Ps = base pressure, standard conditions, 14.65 psia
- Tf = formation temperature, degree Rankine (460° + °F at formation depth)
- Pi = initial reservoir pressure, psia
- Ti = initial temperature of the reservoir in degrees Rankin = reservoir temperature °F + 460°
- Pi = initial pressure of reservoir in psia
- zi = compressibility factor at Pi and Ti
To calculate recoverable gas volumes, the OGIP is multiplied by a recovery efficiency factor.
A standard cubic foot of gas (at 14.73 psi and 60 °F) is equivalent to 0.028 305 855 7 standard cubic meters (at 101.325 kPa and 15 °C). A simple way to estimate gas reserves based on calculated oil reserves is the gas/oil ratio (GOR). An example ratio might be a reservoir with a GOR of 400 scf bbl−1.
4.2.10 Risk Factors
Oil and gas extracted at economic flow rates will be determined by the evaluation of geologic or production‐related factors, such as shale mineralogy, reservoir properties, and geologic complexity. Each of these factors will have to be weighed to estimate the risk factors – a risk factor for each parameter such as thermal maturity, reservoir thickness, organic content, etc. (weighted from 0 to 1) as to the likelihood of the factor being optimal (value = 1) or inhibiting unconventional oil and gas production (value = 0):
- Thermal maturity and basin history.
- Optimal mineralogy for brittleness.
- High organic content.
- High reservoir thickness.
- Limited faulting.
- Large prospect area available.
- Optimal reservoir pressures.
- Surface access for operations.
- Surface access for distribution of produced oil and gas.
- Cooperative regulatory and political climate.
Conventional and unconventional oil and gas recovery through production is a percent of the total reserves in place. Unconventional oil and gas recovery estimates are summarized in Table 4.4.
Table 4.4 Production recovery estimates for unconventional oil and gas fields.
| Oil and gas recovery estimates | Percent recovery oil in place efficiency factor (US EIA 2013) | Percent gas‐in‐place recovery efficiency factor (US EIA 2013) | Examples |
| Favorable oil or gas recovery | 6% recovery efficiency factor for oil in place | 25% recovery efficiency factor for gas in place | Shale oil basins and formation with:
|
| Average oil or gas recovery | 4–5% recovery efficiency factor for oil in place | 20% recovery efficiency factor for gas in place | Shale gas basins and formations with:
|
| Less favorable oil or gas recovery | 3% recovery efficiency factor for oil in place | 15% recovery efficiency factor for gas in place | Shale gas basins and formations with:
|
| Exceptionally high recovery efficiency | Up to 8% recovery efficiency factor for oil in place | 30% recovery efficiency factor for gas in place |
|
| Exceptionally low recovery efficiency | 2% recovery efficiency factor for oil in place | 10% recovery efficiency factor for gas in place |
|
Oil and gas recovery and economics (US EIA 2013) in the prospecting phase can be changed based on:
- Closer well spacing.
- Continued technological improvements in oil and gas recovery methods.
- Completion of more of the vertical net pay encountered in the well.
- Development of multiple production zones, some being less productive than the primary target.
Once the overall concept for the tight oil or shale gas prospect has been developed, the planning phase allows for the refinement of specific areas of the basin to explore or specific leases to acquire. The initial basin information may be sparse, and data might come from USGS, or other government agencies, a university graduate thesis, or research from private consultants.
Geological Information Sources
- National geological survey, such as the USGS.
- State geological survey, such as the Texas Bureau of Economic Geology.
- Private sources, such as petroleum geology consultants.
- University geology department dissertations.
- Published stratigraphic test wells.
- Geological societies publications and field trip guidebooks.
- Oil, gas, and water well logs.
- Public or private seismic data.
Rock outcrops, maps of current and past oil and gas production, and natural oil or gas seeps in the area are compiled. Conventional oil and gas fields are associated with many of the basins now being explored for shale gas and tight oil. Some of the first information may include stratigraphic information from historic oil and gas wells in the basin. Older geophysical data or geochemical studies may provide enough hints of oil and gas potential to warrant conducting additional studies. In other countries with a shorter history of oil and gas exploration, subsurface data may be limited, and wells information may not be easily available. Ultimately after the data are compiled and reviewed, if the areas remain prospective, operators will start to lease acreage from the mineral owners or bid on tracts at a government lease sale.
4.2.11 Geochemistry Studies
Geologists start with a literature search and will review published reports. In the United States, that will include obtaining reports and data from the state geological surveys, the state department of oil and gas, the USGS and other public agencies, or university publications or dissertations. Once the base maps are prepared, geologists may perform field work integrating stratigraphic information from available wells and collecting rock samples for geochemical analyses of the prospective source/reservoir rock outcrops in the basin. For unconventional source/reservoir rocks, outcropping frequently does not occur because the source/reservoir rocks lie at the deepest part of the basin trough. Surface geochemistry studies using passive vapor samplers or other techniques may be used to better evaluate subsurface conditions or document background petroleum hydrocarbon leaks in the shallow subsurface.
4.2.12 Geophysical Data Acquisition
Early in the prospecting process, geophysical data acquisition takes place, providing important subsurface information before drill bits are used to pierce the surface. One of the key questions is whether preexisting fracture zones in a prospective tight oil or shale gas formation will reopen or remain closed after hydraulic fracture stimulation. Exploration in shale gas and tight oil formations commonly uses 2D and 3D seismic surveys. The use of advanced geophysical and petrophysical techniques with a focus on the prediction of rock anisotropy, identifying the three principal stresses, and characterizing natural fracture patterns and other rock properties assists in developing geologic models for identifying the optimal available drilling locations. The prospecting phase includes the integration of geophysical data, petrophysical information from nearby wells, and geochemistry reports.
4.2.12.1 Types of Geophysical Surveys
A variety of geophysical surveys are used in unconventional resource evaluation:
- Gravity surveys
- Geomagnetic surveys
- Seismic reflection surveys
Gravity surveys detect micro‐variations in gravitational attraction caused by the differences in the density of various types of rock. Gravity data are used to generate anomaly maps from which faults and general structural trends can be interpreted and oil and gas prospects generated (BLM 2014).
Geomagnetic surveys, a more economical alternative to conventional seismic surveys, are commonly used for locating metallic ore bodies, using an instrument called a magnetometer to detect small magnetic anomalies caused by mineral and lithologic variations in the crust of the Earth. Geomagnetic surveys are used to a limited extent in unconventional oil and gas exploration in locating the shape of the basin and the approximate depth to basement rocks.
Seismic reflection surveys are the best and most common indirect method used for locating subsurface structures and stratigraphy when prospecting in tight oil and shale gas formations. Seismic energy via shock waves is induced into the Earth using one of several methods (Figure 4.7). As these seismic waves travel downward and outward into the subsurface, they encounter various rock layers, each having a different seismic velocity characteristic associated with density and other lithologic characteristics. As the wave energy encounters the interface between the rock layers, where the lower layer is of lower seismic velocity, some of the seismic energy is reflected upward. A typical seismic survey (Figure 4.8) may use four to five trucks moving behind each other and placing their vibrating plates every 75 ft (25 m) to send the seismic wave through the layers of rock. An alternative to using a vibrator truck, setting explosives in boreholes is another method of creating seismic waves for seismic reflection surveys.

Figure 4.7 Seismic survey diagram showing a truck with an energy source such as a vibrator, with an example of a seismic section above (Kansas Geological Survey 2001).

Figure 4.8 Vibrating trucks used as an energy source in acquiring field data for a seismic reflection survey.
Source: From USGS; http://earthquake.usgs.gov/research/groundmotion/field/evergreen.
With the information from geological information sources augmented with seismic data and geochemical studies, an oil and gas prospector searching for unconventional oil and gas plays can develop a drilling prospect. To develop a prospect plan, the following activities are performed:
- Research of permit requirements, setbacks and federal, state and local regulations, and an updated list of drilling moratoriums or limitations.
- Identify subsurface drilling hazards in the area such as underground mines, historic wells, and buried pipelines.
- Develop a prospect specification with a formation target zone and depth.
- Design the detailed well plans usually with a petroleum engineer.
- Evaluate property access and subsurface mineral rights status.
4.3 Phase 2: Planning Phase
Lease acquisition is the first part of the planning process. The planning phase also includes holding public meetings, permitting the project, performing environmental impact reports, and developing a series of engineering plans, such as drilling plan, cementing plan, erosion control plan, dust control plan, etc. Site preparation consists of constructing the drill pad as well as the access road.
4.3.1 Leases
Once oil and gas prospects have been developed, leases are purchased from the mineral rights owner, sometimes the landowner, or in areas with a long history of exploration and production, frequently another company. In addition to the leases, rights of way may be needed negotiated for production wells, facilities, tank batteries, pipelines, power lines, and access roads. Leases frequently come with operator obligations to drill a well and establish production within a period detailed in the lease. Surface rights and mineral rights may be owned by different owners, creating an uncomfortable situation and possible disruption for the uncompensated landowner when drilling and production begins.
4.3.2 Drilling Permit Process and Public Participation
Drilling permits are part of the field planning process after detailed prospect evaluation has occurred. After an operator decides to drill a well, the exploratory well, the access road, and tank storage or pipeline must be designed, surveyed, and staked. Numerous local, state, and possibly federal permits may be required. Production of environment impact reports and establishing and documenting background conditions should be integrated into the planning phase of the project. Water sourcing and waste disposal issues must be addressed during this phase. Notifications and environmental documents may be produced. Public meetings and community outreach should be part of the planning process, and good communications, transparency of decisions, and disclosing all chemicals used on‐site or in well stimulation techniques increase the chances of more favorable community reception.
Many of the tools and equipment used in conventional drilling (Baker 1979) are also used for unconventional oil and gas targets. Unlike conventional drilling programs and production, which are generally limited to geologically smaller structural areas, such as an anticline, shale gas and tight oil production occurs over entire basins and may exist in dozens of contiguous counties. Drilling and production are large‐scale industrial processes, which can be the source of excessive noise, odors, dust and air emissions, traffic, and other forms of pollution. Due to the high cost of drilling in labor, equipment rental, and supplies, drilling operations are usually running continuously, 24 hours a day, 7 days a week with the potential to tax local infrastructure, create significant nuisances for nearby landowners and residents, and impact available resources. Public meetings and discussions should focus on impact mitigation measures, environmental protection planning, health and safety issues, and pollution prevention.
4.3.3 Drilling Pad Construction
After the permit has been issued, but before the pad is constructed, baseline environmental conditions (drainage, vegetation, faults, erosion, acid drainage, environmental damage, etc.) verified with photographs are identified during an initial pre‐construction inspection, prior to any surface disturbance. Later inspections by a competent person, during construction and drilling, documents that surface activities and disturbance are within the limits established by the drilling permit.
Once the permits are approved, a variety of earth moving equipment including track hoes, track‐mounted and rubber‐tired bulldozers, scrapers, and motor graders are used to construct the drilling pads and any additional access roads.
Moving equipment to the construction site requires moving several loads, and frequently some of the equipment is overweight and over width for traveling over public and private roads. Existing roads and vehicle routes may require improvements in places, and occasionally, culverts and cattle guards may be needed to be installed.
The length of the access road varies. Generally, the route is selected to reduce impacts. Environmental factors or the preferences of the landowner might dictate a longer route. Roads are usually constructed 14 ft (4 m) wide for single lane or 24 ft (7 m) wide for double lane. Other design decisions are whether to construct a single‐well pad or a multiple‐well pad. Soil texture, steepness of the topography, and moisture conditions might require surfacing such as gravel, rather than native soil. Erosion and dust control should be implemented for the well pad and access road.
The amount of area disturbed for construction of the drill pad depends largely on the steepness of the slope. Sites on flat terrain usually require only slight removal of the topsoil material and vegetation. Drilling sites on ridge tops and hillsides are constructed by cutting and filling portions of the location, which is more costly and of longer duration. The majority of the excess cut material is stockpiled in an area that will allow easy recovery for site restoration. Casting removed soil down hillsides or into drainage areas creates erosion potential and unstable soil surfaces. Since the exploration–production process (see Figure 4.4) ends with site restoration, all soil material suitable for plant growth is removed and stockpiled in a designated area for later reuse.
The amount of level surface required for safely assembling and operating a drilling rig varies with the type of rig, the depth, type of the well, and the projected number of wells on the drilling pad. The size of a drilling pad is primarily determined by the capacity of the reserve pits to hold the cuttings from all wells drilled on the pad, as well as having sufficient room for drilling and well completion operations. Although variations will exist, a reasonable size for a single‐well pad is ~4 acres (1.6 ha), about 8 acres (3.2 ha) for an eight‐well pad, and about 12 acres (4.9 ha) for a 16‐well pad. The locations of well pads, roads, drainages, and utilities should be carefully optimized.
4.4 Phase 3: Drilling
Drilling includes the mobilization and setup of the drilling rig and drilling pad, spudding the well, collecting rock and fluid samples, logging, installing casing, as needed, and drilling to the target zone.
The drilling system consists of several main components or services:
- Drilling rig
- Circulation system
- Logging equipment
- Fluid management system
- Drill string
- Casing system
- Cementing system
4.4.1 Drilling Rig
Rotary drilling rigs (Figure 4.9) exert downward pressure on rotating drill rock bit at the bottom of the borehole (Figure 4.10). The derrick and associated hoisting equipment bear a majority of the weight of the drill string during the drilling process. The drill string consists of the drill pipe and the bottom‐hole assembly. The drill pipes are about 30 ft (9 m) in length, although longer drill pipes have been used for deeper holes. The bottom‐hole assembly generally consists of drill collars, subs (including stabilizers), reamers, shocks, hole openers, connection adapters, measuring and steering tools, and the drill bit. Downhole drilling motors can also be used to assist in steering for directional or horizontal drilling. The combination of the rotary motion of the drill string and the weight on the bit and the rotary action gouges the rock at the bottom of the open borehole. Powered by a series of diesel engines, a square or hexagonal rod, called a kelly, creates the downhole rotary motion of the drill string. The kelly fits through a square or hexagonal hole in a large turntable, called a rotary table. The action on the drilling rig floor is dominated by the spinning rotary table, and as the drill bit advances, the kelly slides down through it. When the kelly has gone as deep as it can, about the depth of the drill pipe, it is raised, and a new piece of drill pipe is attached in its place. (A variety of compounds are commonly found at drilling and production sites (Table 4.5)).
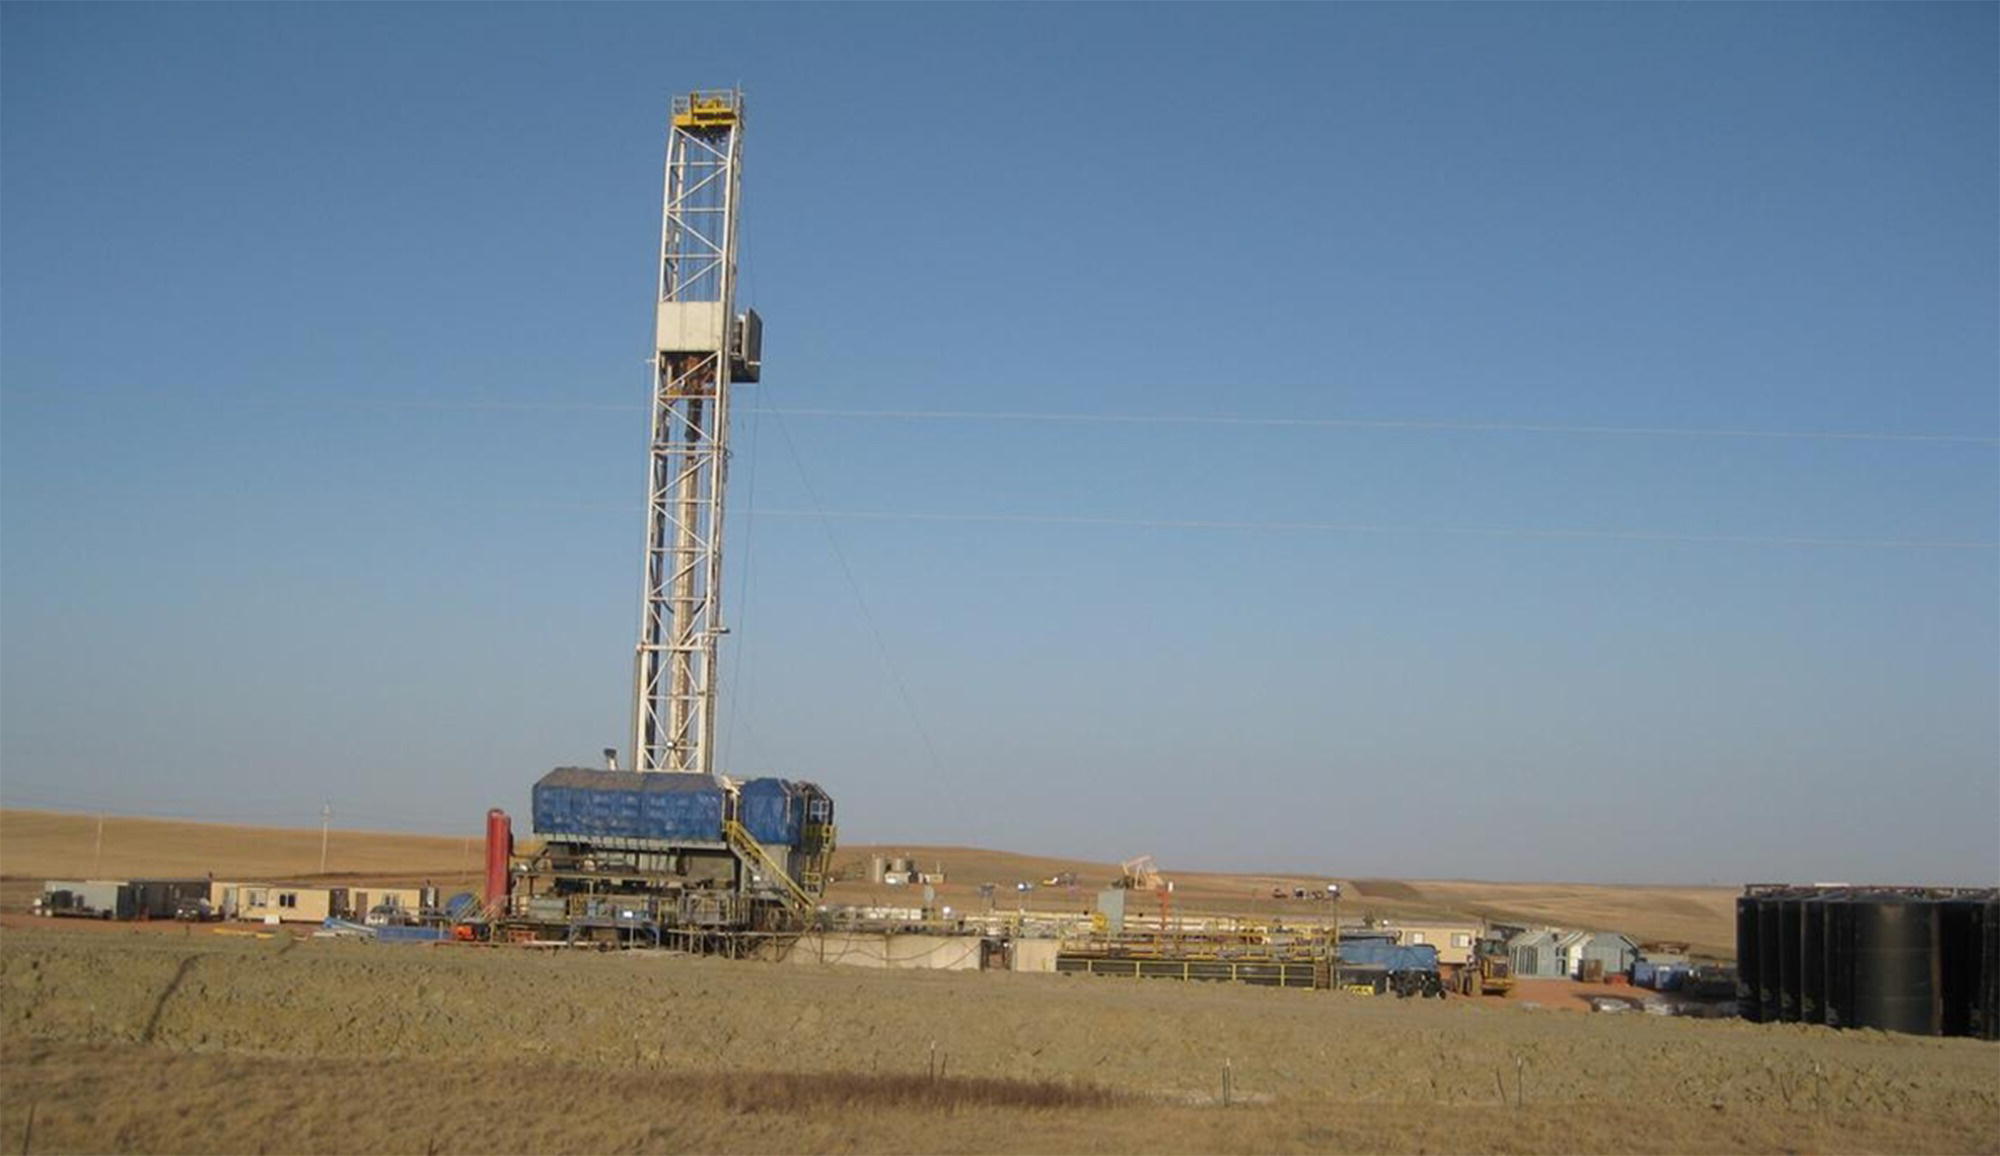
Figure 4.9 Typical drill pad with rotary rig and fluid tanks in March 2016 in the Bakken oil field in western North Dakota.
Source: Image from Stephanie Gaswirth, USGS.
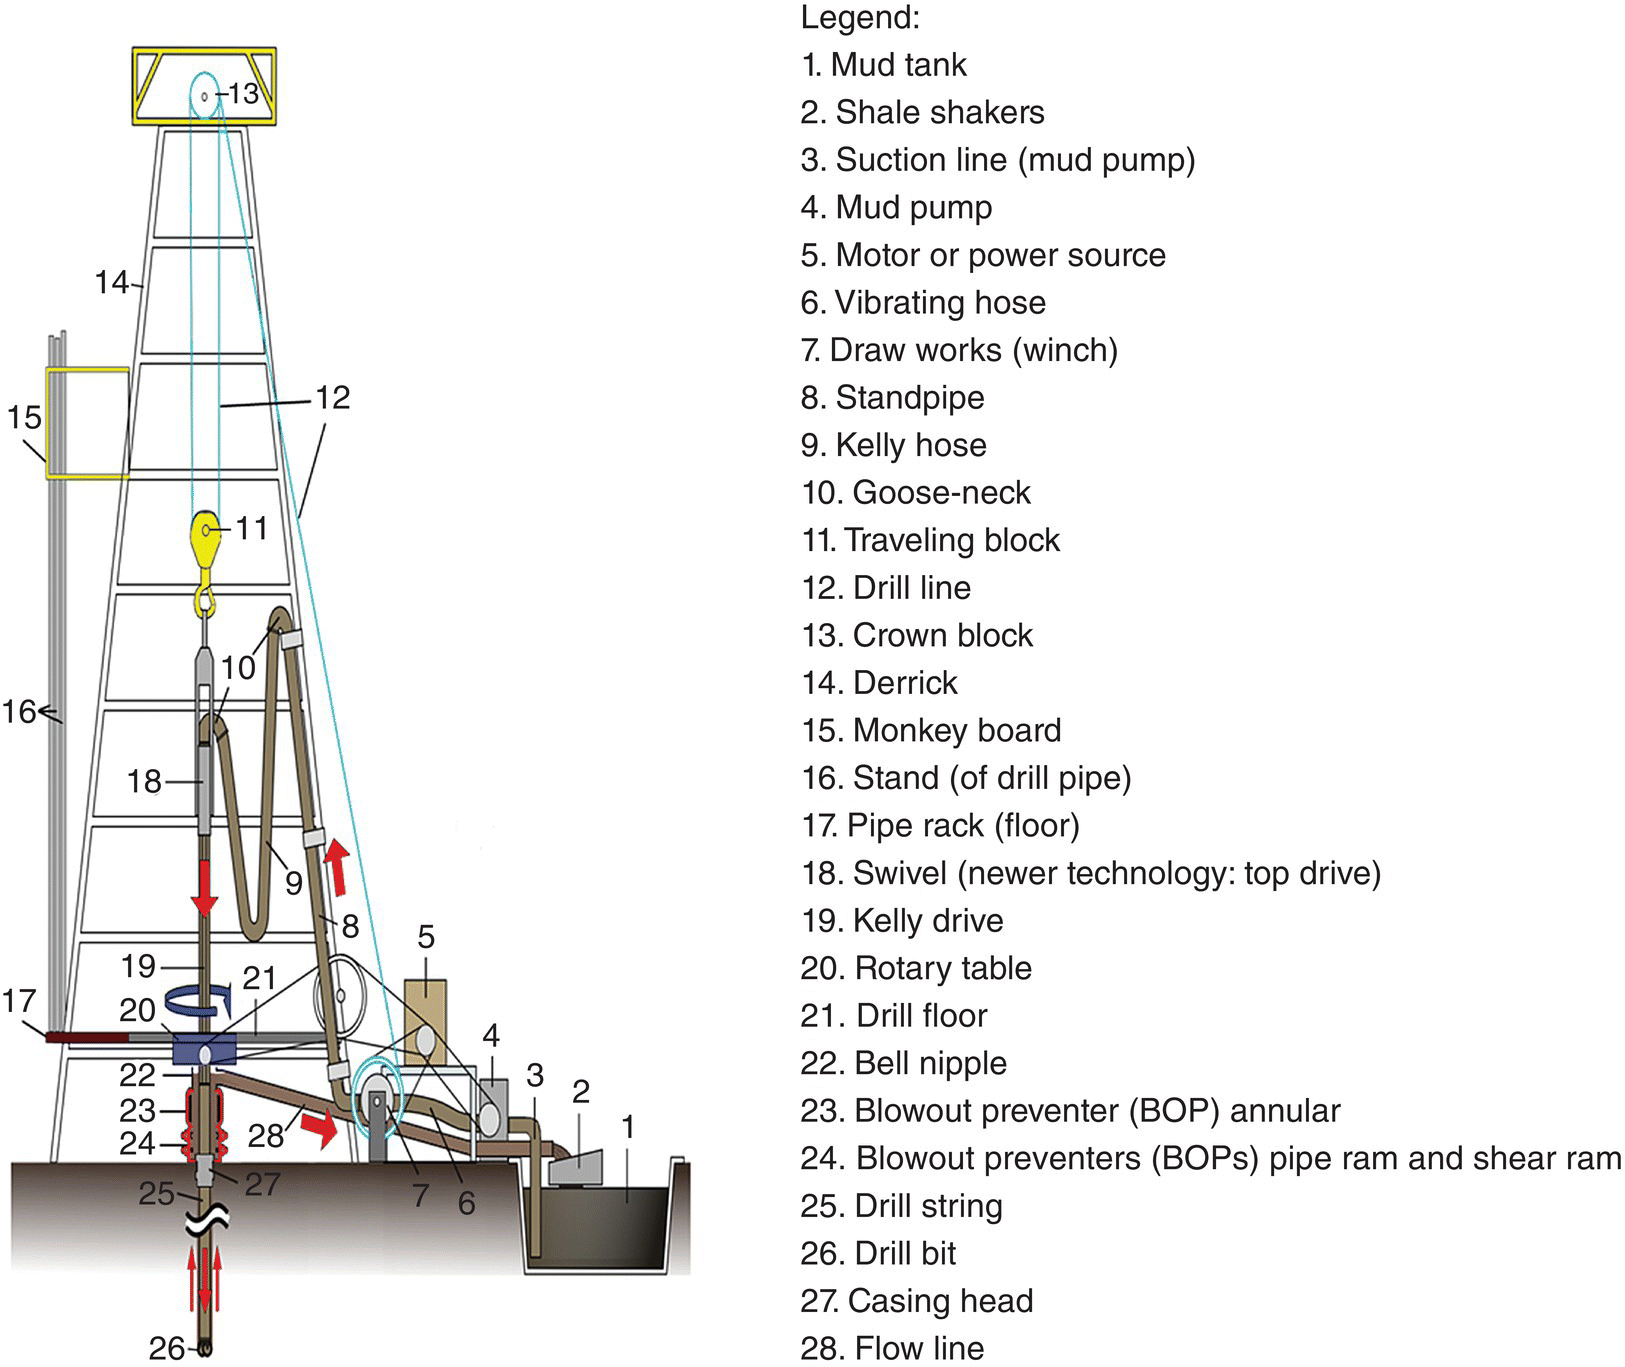
Figure 4.10 Circulatory pattern on a mud rotary drilling rig showing the direction of mud flow and main drilling components (BLM (2013) from BLM (1996)).
Table 4.5 Summary of the classes of compounds commonly found at drilling and production sites.
| Operation | Class of compounds |
| Drilling | Drilling fluid additions: petroleum hydrocarbons (diesel or mineral oil used in some drilling fluids); weighting compounds, corrosion inhibitors, dispersants, flocculants, surfactants, biocides, fluid loss reducers |
| Hydraulic fracturing | Acids, biocides, breakers, clay control compounds, corrosion inhibitors, crosslinkers, emulsifiers, foaming agents, friction reducers, gelling agents, iron control agents, pH control compounds, proppants, resin curing agents, scale inhibitors, solvents |
| Collection and disposal of backflow and drilling wastes | Petroleum hydrocarbons, acids, biocides, breakers, clay control compounds, corrosion inhibitors, crosslinkers, emulsifiers, foaming agents, friction reducers, gelling agents, iron control agents, −7 pH control compounds, resin curing agents, scale inhibitors, solvents, NORM, metals, brines |
| Production fluids | Petroleum hydrocarbons; NORM, brines, additives listed above |
| Equipment and vehicle maintenance | Petroleum hydrocarbon fuels (gasoline, diesel), motor oil, greases, hydraulic fluids, lubricants |
| Industrial compounds for rig and equipment maintenance | Asbestos (historic), cleaners, degreasers (chlorinated solvents), herbicides, lead in paint (historic), PCBs in transformers (historic), pesticides, paints, welding gases and supplies, misc. compounds |
Rotary drilling is an iterative process, and the drill pipe is then lowered into the borehole and the kelly is reattached, and drilling recommences. When the bit becomes dull, it is necessary to remove the drill string and replace the bit. This is a time‐consuming process called tripping and consists of withdrawing three drill pipes in 90 ft (27 m) sections until the old drill bit is out of the hole. Another rotary method uses a powerful (1000 hp) top drive motor suspended from the top of the derrick to rotate the drill string during the drilling process. Drilling bits (Figure 4.11) are carefully selected for the formation and depth and to optimize drilling safety and speed. Coring tools with hardened teeth cut rock cores (Figure 4.12) for lithologic characterization and testing.
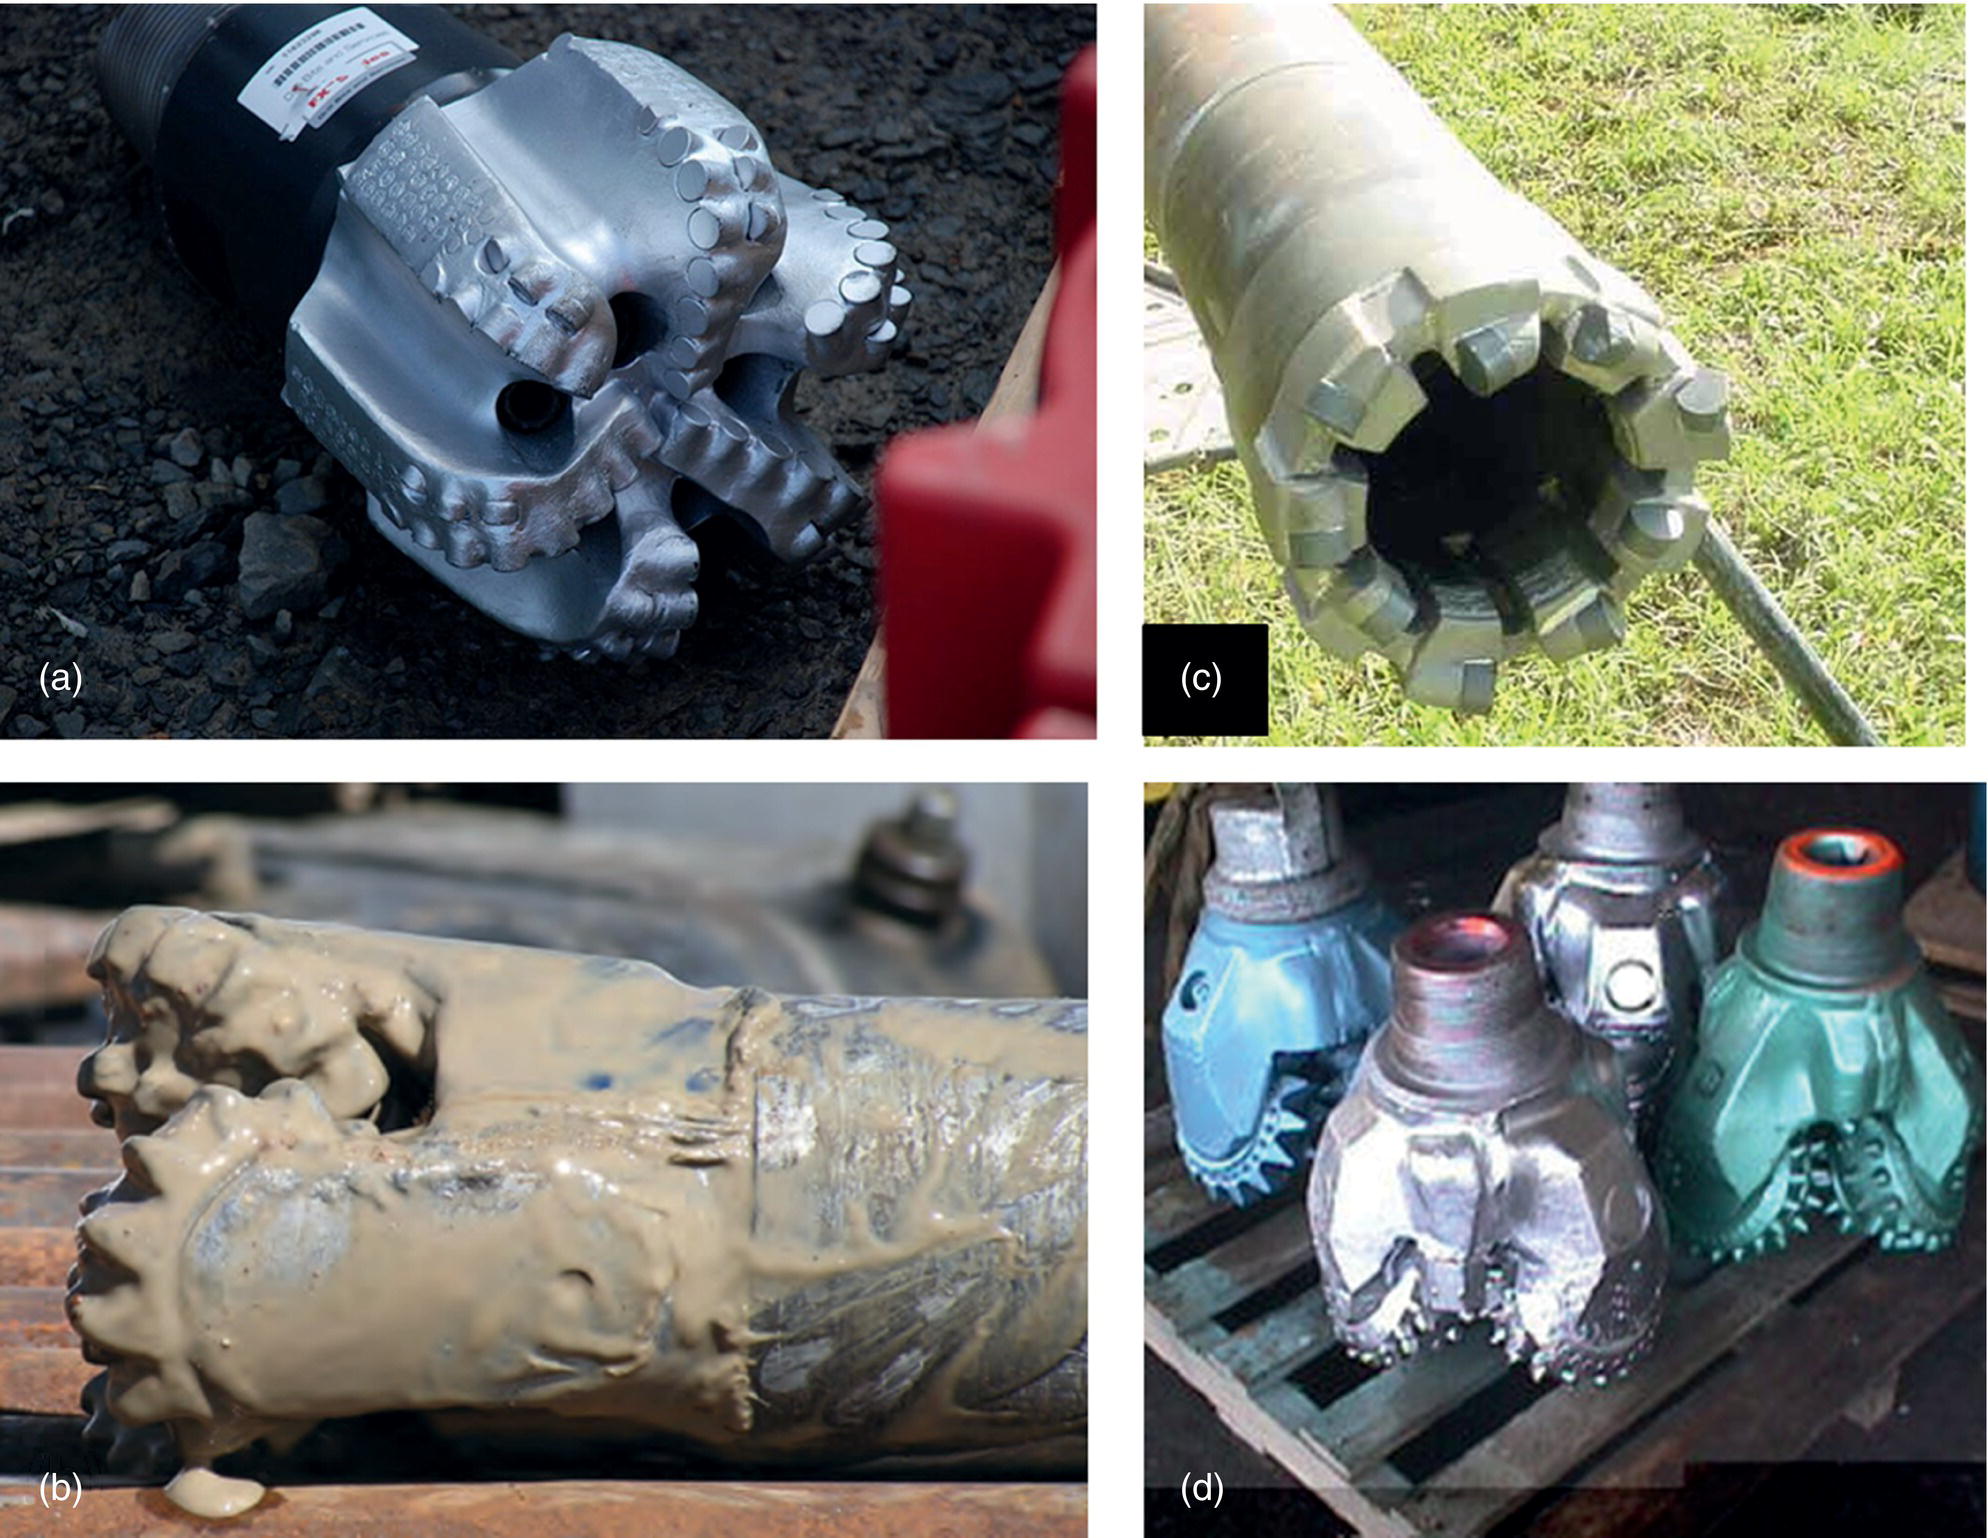
Figure 4.11 Drilling bits used in the oil and gas industry. (a) Fixed cutting bit with nozzles, (b and d) tricone bits, and (c) coring tool with hardened teeth for lithologic core collection (OSHA 2018; USGS 2013).
Source: https://www.osha.gov/SLTC/etools/oilandgas/drilling/casing.html.

Figure 4.12 Core samples of a shale, placed and labeled in a core box from a drill site in Utah. Note the brittle nature of many of the zones.
Source: From US DOE; http://rmccs.org/sitecharacterization/experimental1.html.
Additions to the general theme of rotary drilling include coiled tubing drilling, which has found use in horizontal wells. Coiled tubing drilling or flexible hose drill string refers to a very long bendable metal pipe, normally 1″ (2.5 cm) to 3.25″ (8.3 cm) in diameter, which is supplied spooled on a large reel for specific drilling situations such as directional drilling and well workover processes. Originally developed in the 1920s, and improved upon continuously since, coiled tubing has been used for both conventional and unconventional oil and gas production. Coiled tubing fracturing provides the ability to accurately select fracture multiple zones during the hydraulic fracturing process.
4.4.2 Circulation System
The drilling fluid circulation system consists of a series of pumps, pipes, and tanks to circulate the drilling fluid, also called drilling mud. Drilling mud is circulated through the drill pipe to the bottom of the hole, through the bit (Figure 4.13), up the annulus, which is the space between the outside of the drill pipe and the borehole. The drilling mud provides important functions in the drilling operation:
- Lubricate and cool the bit and drill string.
- Remove and transport rock cuttings up the annulus to the surface.
- Provide borehole stability.
- Help with suspending the weight of the drill string and casing.
- Suspend solids in the drilling mud.
- Control subsurface pressure.
- Transmit hydraulic energy to the downhole tools and instruments.

Figure 4.13 Schematic of the mud circulating system including the drill bit, drill collar, annulus, drill pipe, kelly and swivel.
Source: Modified after OSHA (2014); https://www.osha.gov/SLTC/etools/oilandgas/drilling/kickback_final.html.
The drilling mud moves up the annulus to the top of the well across the shale shaker, which is a screen that separates the rock cuttings from the drilling fluid. The drilling mud flows into holding tanks from which the finer sediments settle from the drilling fluid before it is pumped back down into the well. The drilling mud is maintained at a required weight and viscosity to cool and lubricate the bit, reduce the drag of the drill pipe on the sides of the borehole, seal off any porous zones, counterbalance the formation pressure while drilling and contain formation fluids to prevent a blowout, prevent the uncased or open borehole from collapsing, and bring the rock fragments to the surface for lithologic characterization, analysis, and disposal. Should the mud chemistry or density of the fluid be calculated incorrectly, dangerous well conditions such as loss circulation (low pressure in well) or well kicks (high pressure in well) can occur.
Various drilling fluids and chemical additives (Table 4.6) are used in maintaining the mud at the appropriate viscosity and weight and to counter the extreme temperature, pressure, and geochemical conditions in the subsurface (OSHA 2014). Some of the compounds are the same chemicals used in the hydraulic fracture stimulation operations. Most of the drilling fluid consists of a base or carrier liquid, such as water, oil‐based muds (diesel or mineral oil), or synthetic compounds. A synthetic compound‐based drilling fluid was recently developed to replace oil‐based muds and will have generally oleaginous or oil‐like characteristics combined with specific additives. Due to their lower cost, water‐based drilling fluids are most commonly used. Weighting or density additives include barium sulfate or barite and clays such as bentonite or attapulgite. Other chemicals used in drilling muds include corrosion inhibitors, which decrease the corrosion rate of steel and iron drilling tools; flocculants, which cause suspended particles to group together, so they can be removed from the fluid at the surface; and dispersants, which improve the separation of particles to prevent settling or clumping. Biocides control microbial growth and help reduce the fermentation of drilling mud. Fluid loss reducers and lost circulation materials limit the loss of drilling fluid into an underpressurized or high‐permeability formation. Many of these chemical additives are used together in customizing the drilling fluid characteristics for a particular subsurface condition.
Table 4.6 Summary of the types of drilling fluids and additives.
| Class of compounds used in drilling muds | Examples | Purpose |
| Water‐based drilling fluids | Freshwater based, saltwater based | Drilling mud: lubricate bit, borehole control, bring cuttings to surface, etc. |
| Oil‐based drilling fluids | Diesel based, mineral oil based, kerosene based, selected crude oils, selected mineral oils | See above |
| Synthetic drilling fluids | Ethers, internal olefins, linear alkylbenzenes, linear alpha olefins, poly‐alpha‐olefins, synthetic paraffins, vegetable esters, others | See above |
| Other lower density drilling materials | Air, foam, other gases | These fluids are less dense than standard liquid drilling fluids. Air and foam fluids typically do not contain many additives because the additives are either liquid or solid and will not mix with air and foam drilling fluids. Environmental impacts of synthetic‐based drilling fluids are described in Neff et al. (2000) |
| Weighting agents | Barium sulfate (barite) (BaSO4), hematite (Fe2O3), bentonite (absorbent aluminum phyllosilicate, mostly montmorillonite), calcium carbonate (CaCO3); galena (PbS), dissolved salts | Density compounds to increase mud weight |
| Viscosifiers | Bentonite (absorbent aluminum phyllosilicate, mostly montmorillonite), attapulgite (hydrous magnesium aluminum silicate; summary of drilling fluids in saltwater drilling fluids; polymers are also used as viscosifiers | Density compounds to increase mud weight |
| Thickeners | Carboxymethylcellulose, glycol, guar gum, polyanionic cellulose (PAC), starch, xanthan gum | Thickeners are added to the drilling mud to adjust the viscosity of the fluid |
| Polyacrylic acid | Sodium polyacrylates [(‐CH2‐CH(CO2Na)‐]n | Control yield strength, gel strength, and fluid loss |
| Flocculants | Acrylic polymers, calcium hydroxide (CaOH)2, hydrated lime, gypsum (CaSO4·2H2O), sodium tetraphosphate (Na12O16P4), sodium chloride (NaCl), salt or brine | Flocculants cause suspended particles to group together, so they can be removed from the fluid at the surface |
| Deflocculant | Iron lignosulfonates (calcium, modified sodium, etc.), lignites, tannins (quebracho, hemlock trees), sodium polyphosphates | Deflocculants, also called thinners, are low molecular weight compounds such as anionic polymers designed to break up solid clusters of materials in the drilling mud into small particles, so they can be carried by the fluid. These compounds disperse solids by deflocculating associated clay particles by neutralizing the positive charges on the suspended particles |
| Foaming agents | Diethylene glycol (C4H10O3), ethylene glycol monobutyl ether (C6H14O2) | These products are designed to foam in the presence of water and allow air or gas drilling through formations producing water |
| Defoaming agents | Aluminum stearate (C54H105AlO6), sodium aryl sulfonate | Defoamers are used to reduce foaming action that occurs particularly in reducing conditions typical of brackish waters and saturated saltwater muds |
| Emulsifiers | Amine condensate, oil‐based anionic products, ethylhexanol (C8H18O), 2‐ethylhexanol, fatty acids, rosin and other neutral compounds, modified lignosulfonate compounds, nonionic products, silicone compounds | Emulsifier additives are used to create a homogeneous mixture of two or more liquids, smoothing out the texture and consistency of the drilling mud for better flow characteristics |
| Dissolved salts | Sodium chloride (NaCl), calcium chloride (CaCl2), calcium chloride/calcium | Drilling and workover fluids |
| Iron controlling agents | Citric acid (C6H8O7), hydrochloric acid (HCl) | Oil and gas are extracted from environments that are typically reducing. Iron controlling agents, also called stabilizing agents, are used to inhibit precipitation of soluble iron compounds in the formation fluids by keeping them in solution |
| Scale inhibitors | Ethylene glycol (C2H6O2) | Scale inhibitors are used to control the precipitation of certain carbonate and sulfate minerals |
| Shale control inhibitors | Gypsum (CaSO4·2H2O), calcium hydroxide (CaOH)2, hydrated lime, calcium oxide (CaO), lime, potassium chloride (KCl), sodium chloride (NaCl), salt, sodium silicate (Na2O3Si), specific polymer compounds, other salts | Shale control inhibitors, also called borehole control inhibitors, reduce the potential for borehole wall collapse, caused by swelling or hydrous disintegration of shales |
| Calcium removers | Sodium bicarbonate (NaHCO3), bicarbonate of soda, sodium carbonate (Na2CO3), soda ash, sodium hydroxide (NaOH), caustic soda, polyphosphates | Calcium removers control the calcium buildup that can prevent the proper functioning of the drilling equipment |
| Lubricants | Graphite powder, hydrocarbons, mineral oils, soaps, vegetable oils | Lubricating compounds are added to the drilling fluids to reduce friction between the drill bit and the formation |
| Other compounds used above or as an additive | ||
| Thinners | Lignites (humic acids) | Thinners and emulsifiers and fluid loss reducers |
| Corrosion inhibitors | Iron oxide (Fe2O3), aluminum bisulfate (Al(HSO4)3), amine‐based filming compounds, calcium hydroxide (Ca(OH)2), slaked lime, N,N‐dimethylformamide (HCON(CH3)2), phosphorus‐based compounds, potassium thiocyanate (KSCN), inhibitor for zinc brines, zinc carbonate (ZnCO3), zinc chromate (ZnCrO4) | Corrosion inhibitors protect pipes and other metallic components from acidic compounds encountered in the formation |
| Polymers | Natural organic polymers, synthetic organic polymers | Viscosity and filtration control |
| Surfactants | Detergents, fatty acids, soaps | For water‐based muds, aids in dropping sand from drilling mud; surfactants defoam and emulsify the drilling fluid |
| Biocides | Organic amines, chlorophenols, alkylamines, bromine‐based solutions, calcium oxide (CaO), lime, glutaraldehyde, iron‐based compounds for hydrogen sulfide (H2S) scavenger, paraformaldehyde and formaldehyde compounds, polysaccharide‐based preservatives (C6H10O5)n, corn starch, guar gum, sodium hydroxide (NaOH), caustic soda, sulfite and ammonium bisulfite‐based oxygen scavengers | Prevents organic additives from microbial degradation. Biocides, also called antibacterial agents, are compounds to reduce microbial growth and fermenting processes called souring in the drilling fluids. Oxygen scavengers, such as ammonium bisulfite, are added to the drilling fluids to prevent degradation of the steel well casing |
| Fluid loss reducers | Bentonite clays, cellulose polymers: sodium carboxymethylcellulose (CMC), hydroxyethyl cellulose (HEC), pregelatinized starch, sulfonated phenolic resin compounds | Filtrate loss reducers are added to the drilling fluids to prevent the invasion of the liquid phase into the formation. A larger particle size version of filtrate loss reducers for plugging formation pores are the compounds described as loss circulation materials |
| Loss circulation materials | Walnut shells, fibrous materials (cedar bark, shredded cane, wood chips, stalks, mineral fiber, animal hair), flake materials (mica flakes, pieces of plastic, cellophane sheeting), granular materials (ground and sized limestone or marble, wood, nut hulls, formica, corncobs, cotton hulls), leather bits, organic polymers, sawdust, perlite, shredded rubber, wood | Provide drilling stability by plugging voids in the borehole walls. Lost circulation materials are used to limit the loss of drilling mud to underpressurized or high‐permeability formations. Some of these compounds are also used as thickeners |
| Acids | Hydrochloric acid (HCl) | Lower pH of drilling fluids |
| Alkalinity control additives | Calcium carbonate (CaCO3), limestone, calcium hydroxide (Ca(OH)2), slaked lime, calcium oxide (CaO), lime, potassium hydroxide (KOH), caustic potash or potash lye, sodium bicarbonate (NaHCO3), bicarbonate of soda, sodium carbonate (Na2CO3), soda ash, sodium hydroxide (NaOH), caustic soda | Raise pH of drilling fluids |
| Special additives | Flocculants, corrosion control compounds, defoamers, pH control agents | Increase control on drilling fluid characteristics |
Regardless of the type of drilling mud used, typical contaminants of interest that require periodic monitoring for significant changes are pH, electrical conductivity, sodium adsorption ratio (SAR), cation exchange capacity (CEC), exchangeable sodium percentage (ESP), and total metals. Other constituents of concern include oil and grease and total petroleum hydrocarbons. Drilling fluids usually have a pH that falls within the alkaline range (pH > 10). This high pH is a result from the addition of lye, soda ash, and other caustics, which allows for the dispersion of clay and increased effectiveness. Weathering and aging causes a decrease in the overall pH. Soil salinity is measured by determining the electrical conductivity. This is an important test for soils and waste because of the potential for high brine content that adversely affects plant growth and water quality. Soils exhibiting an electrical conductivity more than 8.0 mmhos cm−1 usually require some manner of management or remediation. SARs are determined to assess potential sodium damage from a waste material. Used in conjunction with electrical conductivity, potential damage associated with sodium salts can be ascertained. An SAR < 3 can restrict such materials for land disposal. Acceptable metal loading in muds are evaluated for CEC. Measured in meq/100 g, CEC values are required to estimate the ESP. Excess sodium typically results in a general lack of structural stability among soil particles and impeded water infiltration. Combined excess salinity and sodic conditions can limit remediation efforts (i.e. remove excess salts from the root zone) due to inherent slow infiltration and percolation characteristics.
Total metal analysis provides a good indication for all metals except barium that is best analyzed under the protocol set forth by the Louisiana Department of Natural Resources. Total metals include arsenic, barium, cadmium, chromium, mercury, lead, selenium, and zinc. Although seldom a significant problem, elevated concentrations of certain metals in soil or waste materials are labile. The metals of most concern in drilling muds are barium, chromium, lead, and zinc.
The presence of petroleum hydrocarbons in drilling muds or waste is typically due to the introduction of crude oil from a producing formation and diesel or mineral oil that is added to drilling muds. Although diesel is likely to be the most common contaminant, diesel‐affected soil and waste materials can be easily remediated via a variety of options. Subsurface biogeochemistry is complex, and the variations in drilling fluid additives reflect adjustment to changes in redox chemistry, pressure, temperature, pH, etc. The same compounds may be used for a variety of different purposes.
The drilling mud circulating system, a key system on the drilling rig, includes the drill bit, drill collar, annulus, drill pipe, kelly, and swivel. The mud flows through the mud return line upon its return to the surface from the borehole to the shale shaker and then to the adjacent desander, desilter, and degasser back to the mud tank. Rock cuttings are collected from the shale shaker for inspection to evaluate lithology, drilling mud characteristics, and evidence of hydrocarbons. The drilling mud then passes through the suction line, and the mud pump circulates the mud through the discharge line, the stand pipe, through the rotary hose and the swivel, back to the kelly and into the drill pipe.
4.4.3 Logging Equipment
Logging provides a prime example of the difference between raw data and useful information. It is only with a competent log analyst that data from mud logging, wire line logging, and logging while drilling (LWD) can be integrated to develop site‐specific information about reservoir conditions and unconventional oil and gas potential. Downhole logging data can also be used for detailed reservoir modeling and rapid economic projections. A variety of key reservoir characteristics as summarized by Bateman and Alzahabi (2016) can be estimated from these types of logging methods:
- Overall geologic characterization.
- Geochemistry.
- Isotope ratios, such as Th/U.
- TOC.
- Thermal maturity level of the hydrocarbons.
- Types of fluids and gases present.
- Lithologic characteristics.
- Mineralogy.
- Sedimentary analysis.
- Porosity and permeability.
- Gas saturation and GOR.
- Structural features and layering.
- Structural features.
- Stress determination and fracture analysis and orientation.
- Effectiveness of well stimulations and completions.
- Optimal azimuthal horizontal lateral well placement.
4.4.3.1 Mud Logging
Lithologic logging of a borehole is performed by closely examining the drill cuttings brought to the surface when using circulating mud rotary drilling. The cuttings are usually collected in the shale shaker. The technician may use a microscope to inspect rock samples, looking for grain characteristics, minerals, and oil staining and organic matter. The detailed lithologic log record includes rock and mineral characteristics by depth. A mobile gas chromatograph (GC) may be used to screen for the presence of notable oil or gas in the circulating mud, called “shows.” Traditionally, the mud logging company is usually an independent third‐party firm contracted by the well operator, usually the oil company.
4.4.3.2 Wire Line Logging
Downhole logs (Figure 4.14) are obtained by running various petrophysical tools into the borehole on a wire cable to identify rock properties of the subsurface and delineate specific geologic units. Logs are usually run at specific target depths usually where casing strings are installed (Table 4.7). Some logs are run before the casing (such as caliper logs, gamma, resistance, spontaneous potential, temperature, and television logs), while cased logs are used to evaluate characteristics not affected by steel casing and can provide evidence of the casing‐cement bond and cased borehole conditions. Logging tools are used to measure water resistivity, hydrocarbon saturations, natural gamma radiations, porosity by density, fracture identification from image logs, nuclear magnetic receptivity and sonic measurements, permeability, pressure, temperature, borehole geometry, and subsurface location. Logs are used to evaluate whether the borehole has the potential for a successful well completion or is a dry hole. Lithologic interpretation is used to differentiate between: sandstones, shales, carbonates, coals, and other minerals. Logs are also used to delineate the various geologic horizons and characteristics; porosity, thickness, and saturation of hydrocarbon zones; and location and thickness of fresh, usable, and unusable water. Prospective intervals containing hydrocarbons are identified and measured on logs, and the formation is perforated and stimulated during the completion program at these zones, based on the log interpretation.

Figure 4.14 Example of the configuration of wire line logging tool commonly used when drilling for oil and gas with signal logging string (SLS) (a) and vertical seismic profiling (VSP) tool (b) (US DOE 2007). The log suite on the right (c) is just a small portion of data from a logging run (USGS).
Table 4.7 Common geophysical logs used in drilling operations.
Source: From Lapham et al. (1995, 1997) as modified from Keys (1990), table 2.
| Type of log | Varieties and related techniques | Properties measured | Potential applications | Required hole conditions | Other limitations |
| Spontaneous potential (SP) | Basic SP log | Electric potential caused by differences in borehole and interstitial fluids | Lithology, shale content, water quality, freshwater versus saline water | Uncased hole filled with conductive fluid | Salinity difference needed between borehole fluid and interstitial fluids correct only for NaCl fluids |
| Single‐point resistance | Conventional and differential | Resistance of rock, saturating fluid, and borehole fluid | High‐resolution lithology, fracture location by differential probe | Uncased hole filled with conductive fluid | Not quantitative; hole diameter effects significant |
| Multielectrode | Normal, focused, or guard | Resistivity, in ohm‐meters, of rock and saturating fluids | Quantitative data on salinity of interstitial water, lithology | Uncased hole filled with conductive fluid | Normals provide incorrect values and thicknesses in thin beds |
| Gamma | Gamma spectral | Gamma radiation from natural or artificial radioisotopes | Lithology; may be related to clay and silt content and permeability; spectral identifies radioisotopes | Any hole conditions, except very large, or several strings of casing and cement | One of the most commonly run logs in the suite |
| Gamma–gamma | Compensated (dual detector) | Electron density | Bulk density, porosity, moisture content, lithology | Optimum results in uncased; qualitative through casing or drill stem | Severe hole diameter effects |
| Neutron | Epithermal, thermal, compensated activation, and pulsed | Hydrogen content | Saturated porosity, moisture content, activation analysis, lithology | Optimum results in uncased; can be calibrated for casing | Hole diameter and chemical effects |
| Acoustic velocity | Compensated wave form, cement bond | Compressional wave velocity | Porosity, lithology, fracture location and character, cement bond | Fluid filled, uncased, except cement bond | Cannot be used to identify secondary porosity; cement bond and wave form require expert analysis |
| Acoustic televiewer | Acoustic caliper | Acoustic reflectivity of borehole wall | Location, orientation, and character of fractures and solution openings, strike and dip of bedding, casing inspection | Fluid filled, 3–16 in diameter | Heavy mud or mud cake attenuate signal; very slow logging |
| Caliper | Oriented, four‐arm high‐resolution bow spring | Borehole or casing diameter | Borehole diameter corrections to other logs, lithology, fractures, hole volume for cementing | Any conditions | Significant resolution difference between tools |
| Temperature | Differential | Temperature of fluid near sensor | Geothermal gradient, in‐hole flow, location of injection water, correction of other logs, curing cement | Fluid filled | Accuracy and resolution of tools varies |
| Conductivity | Resistivity | Most measure resistivity of fluid in hole | Quality of borehole fluid, in‐hole flow, location of contaminant plumes | Fluid filled | Accuracy varies, requires temperature correction |
| Flow | Spinner, radioactive tracer, thermal pulse | In borehole flow | In borehole flow, location and apparent hydraulic conductivity of permeable interval | Fluid filled | Spinners require higher velocities; needs to be centralized |
| Radar | Single‐borehole reflection, cross‐hole tomography, borehole‐to‐surface measurements | Radar wave reflection | Rock structure | Dry or fluid filled, uncased or PVC‐cased (water well) borehole | Metal affects measurements |
| Electromagnetic induction | Induction log | Electromagnetic conductivity | Lithology, water quality | Fluid filled, uncased or PVC‐cased (water well) borehole | Metal affects measurements |
4.4.3.3 Logging While Drilling
For rapid real‐time data collection, logging while drilling (LWD), also called measurement while drilling (MWD), has been used in the oil and gas industry for several decades. LWD uses sensors integrated into the well string which measure porosity, resistivity, borehole direction, and weight on bit in real time during the drilling process. The advantage of LWD is that lithologic measurements can be made without lowering a suite of specialized wire line tools into the borehole. Horizontal drilling relies on LWD to steer while drilling into thin reservoir targets. More information about LWD is described below (see Figure 4.18).
4.4.4 Fluid Management System
Fluid management is one of the most critical environmental aspects of drilling and hydraulic fracture stimulation. Drilling‐derived and well‐derived liquids and solids include drilling muds and cuttings, flowback waters (flowback), production water, equipment cleaning waters, and cooling waters (Table 4.6). The purpose and examples of specific compounds show that some operations such as drilling and hydraulic fracturing can use the same chemicals for different functions, such as biocides and corrosion inhibitors.
Drilling muds consist of a base fluid, a weighting agent, flow agents, and other compounds to optimize drilling, control bacteria, and limit corrosion. Details of the specific chemicals used in drilling and hydraulic fracture stimulation are found later in the chapter. Regardless of the specific compounds used in the drilling muds or hydraulic fracturing fluids, the standards of liquid and solid waste management have evolved over time:
- Open fluid impoundments
- Closed containment systems
- Closed‐loop system
Open fluid impoundments have been used for over 150 years in the oil and gas industry. Historically, unlined pits were used to store drilling‐derived wastes, and leakage of toxic chemicals near and beneath unlined reserve pits at exploration and production sites is common. Many current operators use lined fluid impoundments, reserve pits, or mud pits, which are constructed close to the rig (Figure 4.15). The pits are usually square or oblong, but sometimes in another shape to accommodate the lease shape or topography. A reasonable reserve pit depth is about 8 ft (2.4 m) to 12 ft (3.7 m) deep, but it could be deeper (with smaller length and width) to compensate for deeper drilling depths (with a need for a larger capacity). A minimum of 2 ft (0.6 m) to 3 ft (0.9 m) of freeboard is recommended, and the open pits should be covered with bird netting. Lined pits have at least two layers of liners, with a leak detection and alarm system between the liners. The synthetic flexible geomembranes, such as impermeable chemically resistant chlorosulfonated polyethylene (CSPE) and high density polyethylene (HDPE) liners must have the seams sealed and inspected during installation (Figure 4.16). Lined ponds, whether containing drilling fluids (double lined), dairy wastes (double lined), industrial chemicals (double lined), or stormwater (single lined), frequently use 60‐mil HDPE liner material sealed with a wedge seamer joining the panels together. The seaming of double liners creates an air gap between the two seams. The air gap is sealed on both ends of the seam and tested to hold pressure of 25–30 psi (172–207 kPa) for 5 minutes. Pond liner standards have been developed by a variety of organizations, including ASTM International and the Geotextiles Institute. Natural liners, such as clay with a hydraulic gradient of 1.0 × 10⁻⁷ cm s−1, have been used on drill sites. As with any fluid containment system, inspections and monitoring should be performed daily or more frequently, as needed. Lined fluid impoundments are not a best management practice for safely storing drilling muds, hydraulic fracture stimulation liquids, flowback, or production fluids.

Figure 4.15 A water impoundment at a natural gas drilling site in the Marcellus Shale gas play of southwestern Pennsylvania.
Source: Image from Doug Duncan, USGS; http://gallery.usgs.gov/photos/03_08_2013_gLcn1RQ118_03_08_2013_0#.U1awrfldVsI.

Figure 4.16 Pond liner regulations vary by state but are critical in protecting groundwater.
Source: Photo courtesy of Tennessee Valley Authority, TVA.gov.
For significantly better control of fluids on the drilling pad, some operators use a variety of closed containment tanks, which have a higher initial cost than lined pits. The system uses tanks to store fluids generated on the drill pad. For control and storage of flowback water during the hydraulic fracture stimulation process, dozens of side‐by‐side steel fluid tanks are used by some operators (Figure 4.17). Each fluid tank commonly has 21 000 gal (80 000 liter) capacity, and tanks can store drilling fluids, frac fluids, flowback, or production liquids. Some regulatory agencies require best management practices for drilling fluid management. In the state of New Mexico, lined pits are not allowed, and all aboveground tanks containing fluids other than freshwater must be contained in an impermeable bermed enclosure to contain a volume of one‐third more than the total volume of the largest tank or of all interconnected tanks. All below‐grade tanks in New Mexico must have secondary containment and a leak detection system. When the tank system is full and needs pumping, the fluids are extracted in a batch process and usually transported off‐site for treatment, reconditioning, and possible reuse or off‐site disposal.

Figure 4.17 Side‐by‐side fluid storage tanks with top covers having secondary spill containment berms in northeast Pennsylvania.
Source: Image from James Jacobs.
The best and the highest initial cost option for fluid management at a drill pad is the closed‐loop drilling system, also called pitless drilling. This integrated system reduces the amount of drilling waste, recycles drilling fluids, reduces drilling costs, conserves water, and minimizes soil and groundwater contamination from drilling wastes. Closed‐loop drilling uses centrifuges that separate solids (cuttings) from the drilling mud liquids (Rogers et al. 2006, b). If shallow groundwater is encountered while digging the reserve pit, a closed‐loop drilling system is recommended. On Bureau of Land Management leases, closed systems are mandatory for operators using oil‐based mud. In addition, the mud and cuttings must be recycled or disposed of in an approved manner (BLM 2014).
Rigs used for drilling into tight oil and shale gas formations are portable and include tall derricks that handle the tools and equipment that descend into the borehole or well. The modular drilling equipment is transported to the drill site by trucks or barges. Moving a land‐based drill rig might require 30–40 truck trips of construction equipment over public highways and private roads.
Water for drilling and well completion may be hauled or piped to drilling pad locations. Water sources are usually commercial water sources or recycled water if drilling is below the surface casing and freshwater aquifer zones. When drilling commences, and as long as it progresses, water is continually transported to the rig location, unless an adequate water well exists or can be drilled on‐site, which is rare. Roughly 5 000 barrels of water is required to drill and 23 000 barrels required for completion operations for an oil or gas well to the depth of 9 000 ft (2 750 m) or greater. Generally, water required for completion operations is recycled to the extent practical. More water would be required if circulation is lost, or permeable zones that cannot withstand the pressure of the drilling fluid are encountered (BLM 2014), and as such, adequate water storage areas need to be designed.
4.4.5 Drill String
The drill string is the column of pipe that conveys the drilling fluid through the mud pumps and transmits the torque through the kelly drive or top drive to the drill bit at the bottom of the borehole. The bottom‐hole assembly includes the drill bit, drill collars, drilling stabilizers, and MWD tools. A series of heavy thick‐walled drill collars near the bit provides additional weight on the drill bit. Stabilizers keep the bottom‐hole assembly centered in the borehole. A heavyweight transition drill pipe may be used between the bottom‐hole assembly and the drill pipe. The drill pipe consists of the majority of the drill string and consists of pieces typically about 30 ft (9 m) in length. To save time tripping in or out of the hole, 90 ft (27 m) stands consisting of three 30 ft (9 m) drill pipes joined together are handled by larger, modern drill rigs. Fishing tools (for lost or separated drill pipe in the borehole), jars (to loosen stuck drill pipe), and other drilling specialty tools are added to the drill string to address specific downhole conditions. The significant advances in downhole directional steering have been a significant drilling advancement, allowing for the production of unconventional oil and gas resources.
Directional drilling and horizontal drilling use a hydraulic downhole motor powered by the flow of drilling mud down the drill pipe. The downhole motor can rotate the drill bit without rotating the entire length of drill pipe between the drill bit and the surface. The separation of rotation motion of the downhole motor and the drill bit allows the bit to drill a path that deviates from the orientation of the drill pipe. Horizontal wells or production drain holes, used almost exclusively for drilling targets in tight oil and shale gas formations, begin at the surface as vertical wells. The drilling progresses, and conductor pipe and surface casing are installed to protect and seal off shallow aquifers and deeper aquifers, respectively, from the much deeper natural gas, crude oil, and brines. When the drill bit is a few hundred feet above the target zone in a vertical well, the drilling is stopped.
While the drilling is stopped, the drilling mud continues to be circulated to maintain subsurface control. Then the drill string is removed and reinstalled with a hydraulic motor attached between the drill bit and the drill pipe. After the downhole motor is installed between the drill bit and the drill pipe, the newly reconfigured drill string is lowered back down the borehole at the kickoff point. The drill bit creates a path that steers the borehole from vertical to horizontal over only a few hundred feet. Once the borehole has been steered to the proper angle, straight‐ahead drilling resumes and the borehole follows the designed trajectory to the producing zone. Keeping the well within a target zone of a thin rock unit, such as 100 ft (33.5 m), requires careful navigation. Downhole instruments are used to determine the azimuth and orientation of the drilling. This information is used to steer the drill bit.
Horizontal drilling is significantly more expensive than installing a vertical well in the same formation; however, the amount of net pay is greatly increased. When combined with hydraulic fracturing stimulation, an unconventional oil or gas well can cost up to three times as much per foot as drilling a vertical well. The extra cost is usually recovered by increased production from the well. Depending on local geologic conditions, these drilling and production methods can multiply the yield of natural gas or crude oil from a horizontal well by up to 10–20 times compared with a vertical well completed in a similar manner in the same zone. Directional drilling includes not only the subsurface motors and controls, such as MWD, but the oil and gas industry has developed several technologies to improve overall efficiency, such as using advanced drill sensors and global positioning technology to ensure the success at locating and producing from distant target zones, as thin as 9 ft (3 m) thick (Figure 4.18). Rapidly developing and continuously improving drilling and production technology has paid off for oil and gas operators by precisely controlling the direction and depth of each completed producing well. Other tools such as whipstocks, bottom‐hole assembly configurations, 3D measuring devices, and other specialized drill bits and motors have enabled a single surface drilling pad to service multiple wells drilled at various angles, tapping into formations containing crude oil and natural gas reserves more than a mile deep and miles away from the surface rig location.
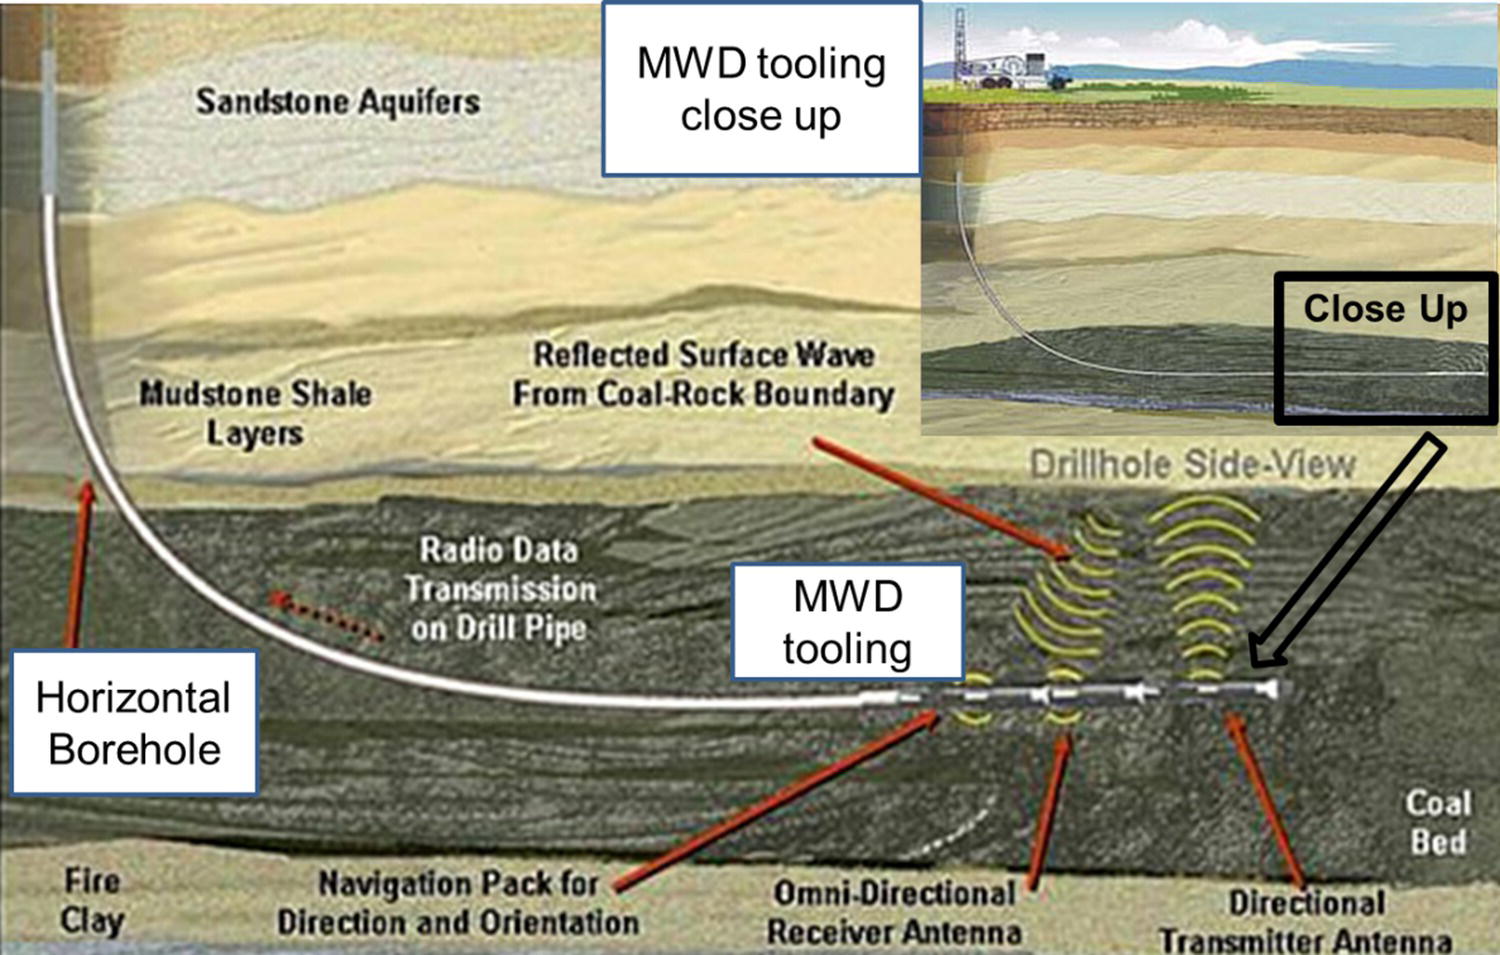
Figure 4.18 Measurement while drilling (MWD) has been used for decades to aid in directional drilling.
Source: From US DOE; http://www.netl.doe.gov/research/oil‐and‐gas/project‐summaries/completed‐ep‐tech/de‐fc26‐03nt15477.
4.4.6 Casing System
A series of nested steel casing strings separated by specialized cement isolates productive hydrocarbon zones from unproductive formations and protects groundwater resources. The casing strings are installed from the largest‐diameter to the smallest diameter casing and usually consist of conductor, surface, intermediate, and production strings placed in the drilled borehole to provide a conduit for completion operations and production, to attach subsequent casing strings, to provide borehole stability, to isolate specific formations or zones, and to connect the blowout preventer (BOP) at the surface. Casing consists of steel pipe composed of ~40 ft (12 m)‐long pipes that are threaded together and are used for subsurface control. Casing is cemented into the walls of the borehole to protect against migration of gases and fluids within the open borehole and to isolate the productive hydrocarbon zones, so they can be completed and produced without interference from water zones or nearby underpressured or overpressured formations. The casing (Figure 4.19) and cement design should include borehole deviation, casing depth, borehole conditions and environment, and placement of centralizers. For horizontal or angled boreholes, casing centralizers are placed on the outside of the casing to center the casing string in the center of the borehole.

Figure 4.19 Schematic of horizontal well with casing strings. No scale implied.
Source: Modified after US DOE (2009).
Conductor casing protects the borehole from sloughing of unconsolidated surface sediments and isolates the shallowest groundwater from the contents of the borehole. Also called conductor pipe, this is the largest‐diameter casing and is designed to be large enough to allow subsequent smaller casing strings to be installed as the borehole is drilled deeper. The conductor casing is installed from the surface to about 80 ft (25 m) to 150 ft (45 m) below ground surface. The conductor casing is not always required.
Surface casing is installed for well control and to protect deeper but important water sources from subsurface contamination by oil and gas drilling and production operations. Surface casing is highly regulated and should always be set to a depth greater than the deepest reasonably developed freshwater aquifer. Usable water resources could exist at great depths. Deeper water zones that are not considered important groundwater resources frequently have high total dissolved solids (TDS) and high salinity or are brines. The surface casing can be set on the bottom from about 2000 ft (600 m) or more, and the casing is run to ground surface. The surface casing is lowered into the borehole from the surface to just above the bottom of the borehole, leaving a space at the bottom of the casing string. The cement is pumped down inside the casing string and enters the open borehole space at the bottom of the casing string. Pressure from the pumps forces the cement up from the bottom of the casing string into the annular space between the outside of the surface casing and the borehole walls. Continued circulation until the cement returns to the surface ensures that the entire annular space is filled with sealing material and no voids exist. For the surface casing to protect and isolate important aquifers from deeper hydrocarbon zones, a strong cement bond between the casing and the borehole wall must be confirmed. A cement bond logging tool is run in the cased hole, and the logs are interpreted for evidence of the quality of the annular seal, inspecting for possible cement defects including voids, bridging, or cracks. The cementing process is used for the other casing strings as well.
The installation and cementing of the surface casing is a critical aspect of environmental protection of local groundwater resources. The depth of hydraulic fracturing and production zones in a basin should be compared with the depth of groundwater resources and the installation of surface casing.
Intermediate casing is generally cemented in place after the surface casing and before the production casing is installed. The intermediate casing string is designed to provide protection against borehole instability caused by sloughing of abnormally pressured or weak formations. Intermediate casing allows engineers to change the density and characteristics of the drilling fluids necessary for the borehole control of deeper rock formations. In some situations, intermediate casing may not be needed.
Production casing is usually installed from the surface down to the top of or into the producing zone. The production casing string is set across the target zone and connects the producing formation and the primary completion components. Production casing is also used to pump hydraulic fracture stimulation fluids into the producing formation without contacting other formations in the borehole. If the petrophysical logs do not indicate that economic amounts of hydrocarbons were discovered, the borehole is abandoned or plugged and the time‐consuming and expensive task of installing production casing is not expended. Specialized tubing may also be used under certain situations. Production may be directly from the formation or open hole, without casing or through perforations in the production casing.
Blowout preventer is an important piece of safety equipment to prevent overpressured fluids or gases from reaching the surface. Cement is placed in the annulus of the surface casing from the casing shoe (at depth) to the ground surface. The surface casing is the first string on which BOP equipment is installed. The BOP equipment allows the well to be shut in at any time that conditions warrant, protecting against unanticipated formation pressures and allowing safe control of the well. BOP equipment is tested and inspected regularly by both the rig personnel and regulatory agencies.
4.4.7 Cementing System
Cementing is one of the most important engineering design and field implementation projects for subsurface environmental protection available on the drill pad. Cement fills and seals the annulus between the casing strings and the borehole. If done correctly, an impermeable seal created by the cement will keep the casing string stable and strong, isolate and contain production fluids from leaking into shallow aquifers, and prevent casing corrosion. If done poorly, or if the cement develops cracks or microfractures over time, the sanitary seal between the surface and the production fluids can be compromised.
Placing cement in the annulus between the casing and the borehole walls is a critical factor in providing a hydraulic seal and protecting water resources. Cementing systems and cementing design can be used to isolate specific oil or gas production zones, isolate saltwater brines from the production zone, or protect water resources. In addition, the casing protects the casing from corrosion and provides structural support for the casing and acts to centralize the casing in the borehole. Cementing also isolates the casing seat for subsequent drilling. Casing can be moved into optimal position while cementing by drill string rotation; raising or lowering the drill string is called reciprocation. A written cementing plan should describe the borehole environment and downhole conditions, well type, borehole conditioning and mud properties, casing and cement program, type of well completion or abandonment procedures, circulation rate, filter cake removal, and any special issues, such as fluid loss zones and high‐pressure zones.
4.5 Brief Overview of Hydraulic Fracturing
Many of the crude oil and natural gas production stimulation techniques have been used in the industry for decades. The current version of these methods and techniques has been improved over time to optimize well production. Hydraulic fracturing as a production technique was first used in an oil and gas well in 1948. The types and use of various fracturing fluids have evolved greatly over the past 70 years and continue to evolve for advanced hydraulic fracturing technology (US EPA 2004a, b). The US oil and gas industry has used fluids for fracturing geologic formations since the early 1940s (Ely 1985). The Medina Sandstone, a tight gas reservoir, underwent extensive hydraulic fracture stimulation in western New York and Pennsylvania during the 1970s. Now, it is estimated that hundreds of thousands of oil and gas wells have their production enhanced with hydraulic fracture stimulation techniques. Horizontal drilling, like the hydraulic fracture stimulation techniques, is also over half a century old. The first horizontal well was drilled in Kansas in 1948. The first shale gas well was drilled in the Antrim Shale in Michigan in 1988. Although Mitchell Energy drilled for Barnett Shale gas in Texas in 1981, it only became economic after a slick water frack in the late 1990s. More directional control in navigation and steerable drilling technologies provided the tools for angle and horizontal drilling to capture more production potential per foot drilled.
Hydraulic fracturing is the process of creating small cracks, or fractures, in deep underground geological formations to liberate oil or natural gas and allow it to flow up the well for capture. Published microfracture data is based on observations, sophisticated measurements, and modeling (Warpinski 2009; Warpinski et al. 2012) and is summarized in Figure 4.20. The distance between underground drinking water resources (UDWR) and zones of HVHF stimulation varies with location.
Figure 4.20 Diagram showing fracture height (Fisher and Warpinski 2012) is on the left and chart showing top fracture height frequency (right) is from Davies et al. (2012). The collected figure was in US EPA (2016b).
To fracture the rock formation, fracturing fluids that consist of ~99.5% water and sand, with the remaining percentage of ~0.5% chemical additives, are injected down the borehole into the formation. The fluid, injected under high pressure, causes the rock to break or fracture along weak zones, usually consistent with existing regional microfracture orientation. These fractures typically range from 0.1 in (0.25 cm) to 0.3 in (0.76 cm) in width, 20 ft (6 m) to 300 ft (91 m) in height, and 300 ft (91 m) to 1500 ft (460 m) in length (BLM 2014). When the fractures are complete, and pressure is relieved, the flowback fluids migrate up the well where they are contained and stored for later treatment or disposal. As the fluids flow back up the well, the sand remains in the newly enhanced fractures and props the rock open to allow for hydrocarbon production. This allows the oil and gas to seep from the rock into the pathway, up the well, and to the surface for collection. In many areas, the targeted formations for hydraulic fracturing are often more than 7000 ft (2130 m) underground and some 5000 ft (1520 m) or more below any drinking water aquifers (BLM 2014).
4.6 Operators and Contractors
The operator has the ultimate responsibility for drilling success, safety, and environmental stewardship on‐site; besides the company supervisor, the geologist, and engineer, most of the other workers are contractors, including the drilling company that owns and operates the drilling rig. Other special services provided by contractors include wire line operations, well logging, perforating, cementing, hydraulic fracture stimulation, swabbing, hot oiling, snubbing, and coil tubing. The well completion process begins when the borehole has been completed to the target depth and location. The drill rig is no longer needed and is removed, and a temporary wellhead is installed. A variety of pumps, mixers, and hoses mobilize on‐site with truck‐mounted equipment to perform the hydraulic fracturing (Figures 4.21 and 4.22).
Figure 4.21 Representation of common equipment at a shale gas drilling pad.
Source: From US DOE (2014); http://energy.gov/sites/prod/files/2013/04/f0/how_is_shale_gas_produced.pdf.

Figure 4.22 A hydraulic fracturing operation is underway at this drilling pad in the Marcellus Shale gas play in southwestern Pennsylvania.
Source: Image from Doug Duncan, USGS (2012); http://gallery.usgs.gov/images/03_08_2013/v0Qd72Gts4_03_08_2013/large/Hydraulic_Fracturing_In‐Progress.jpg.
4.7 Phase 4: Completion
Completion of a tight oil or shale gas well includes hydraulic fracture stimulation. The process starts with the setup of water tanks, pumps, blenders, and other equipment. A command center is placed on‐site for process direction. A large number of commercial trucks, including tankers and semitrailer trucks, transport water, chemicals, and proppant to the site. The hydraulic fracture stimulation process is commonly performed over a one‐ to two‐week period.
New completion methods and tools are continuously being developed and tested. Three common well completion concepts (Figure 4.23) illustrate the cemented casing completion, the formation packer completion, and the open hole completion. Details in the production zone of the Bakken Formation show five well completion methods, including the cemented casing completion method (Figure 4.24), open borehole completion method (Figure 4.25), uncemented pre‐perforated liner method (Figure 4.26), positive annular isolation method (Figure 4.27), and the sliding sleeve method (Figure 4.28).
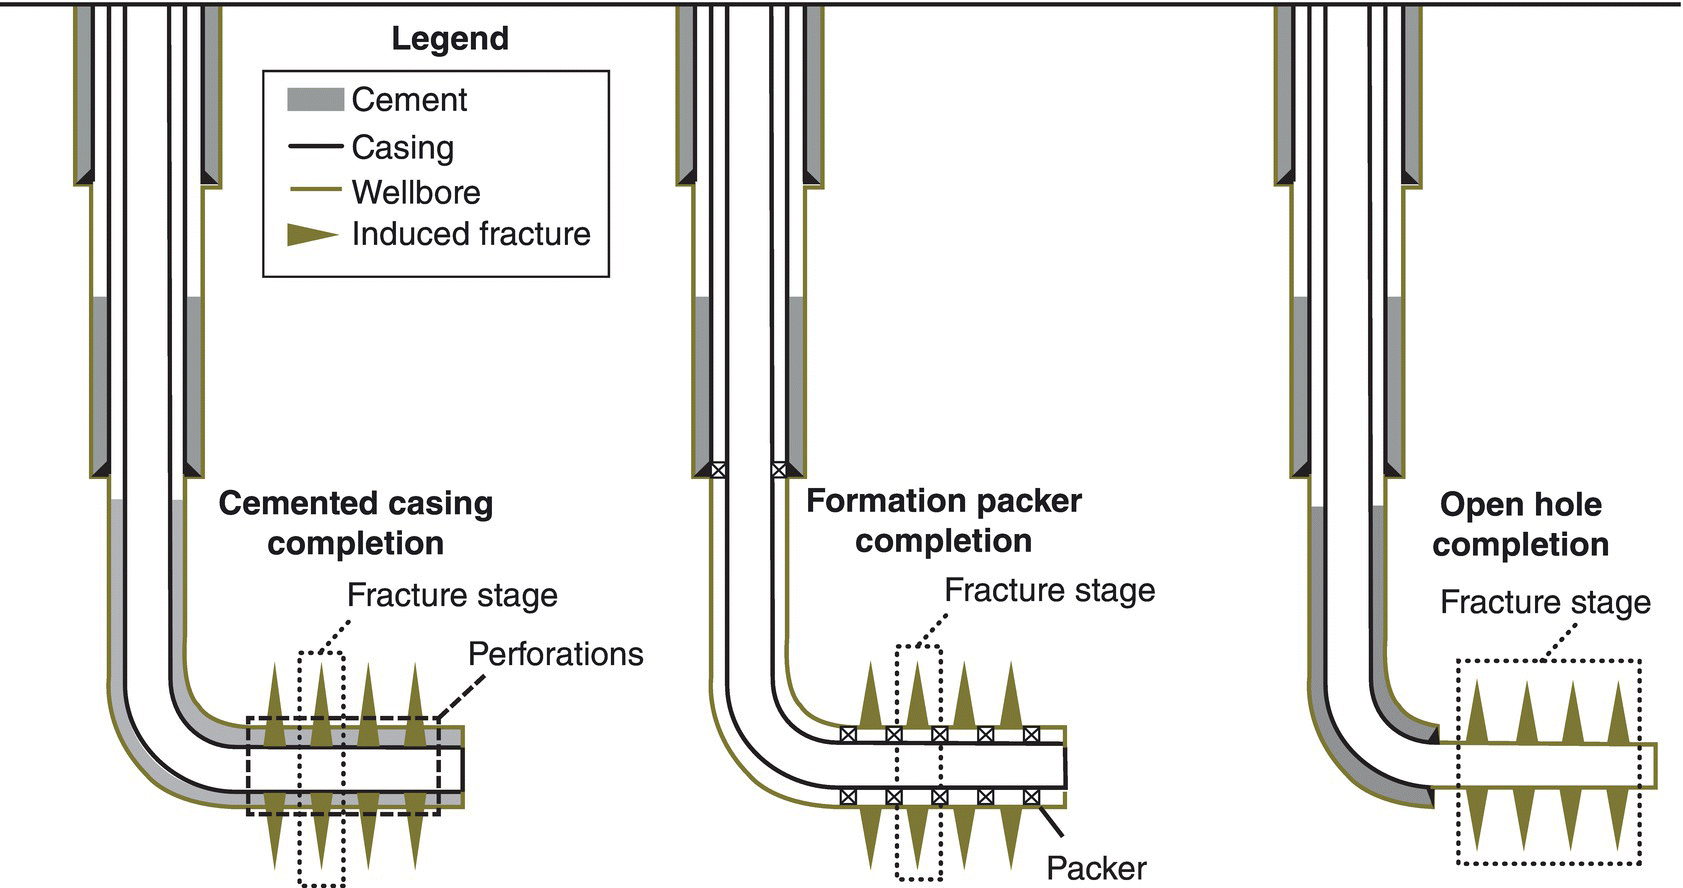
Figure 4.23 Three well completion concepts: the cemented casing completion (left), the formation packer completion (center), and the open hole completion (right). Notes: not to scale; conductor casing not shown (US EPA 2015c).
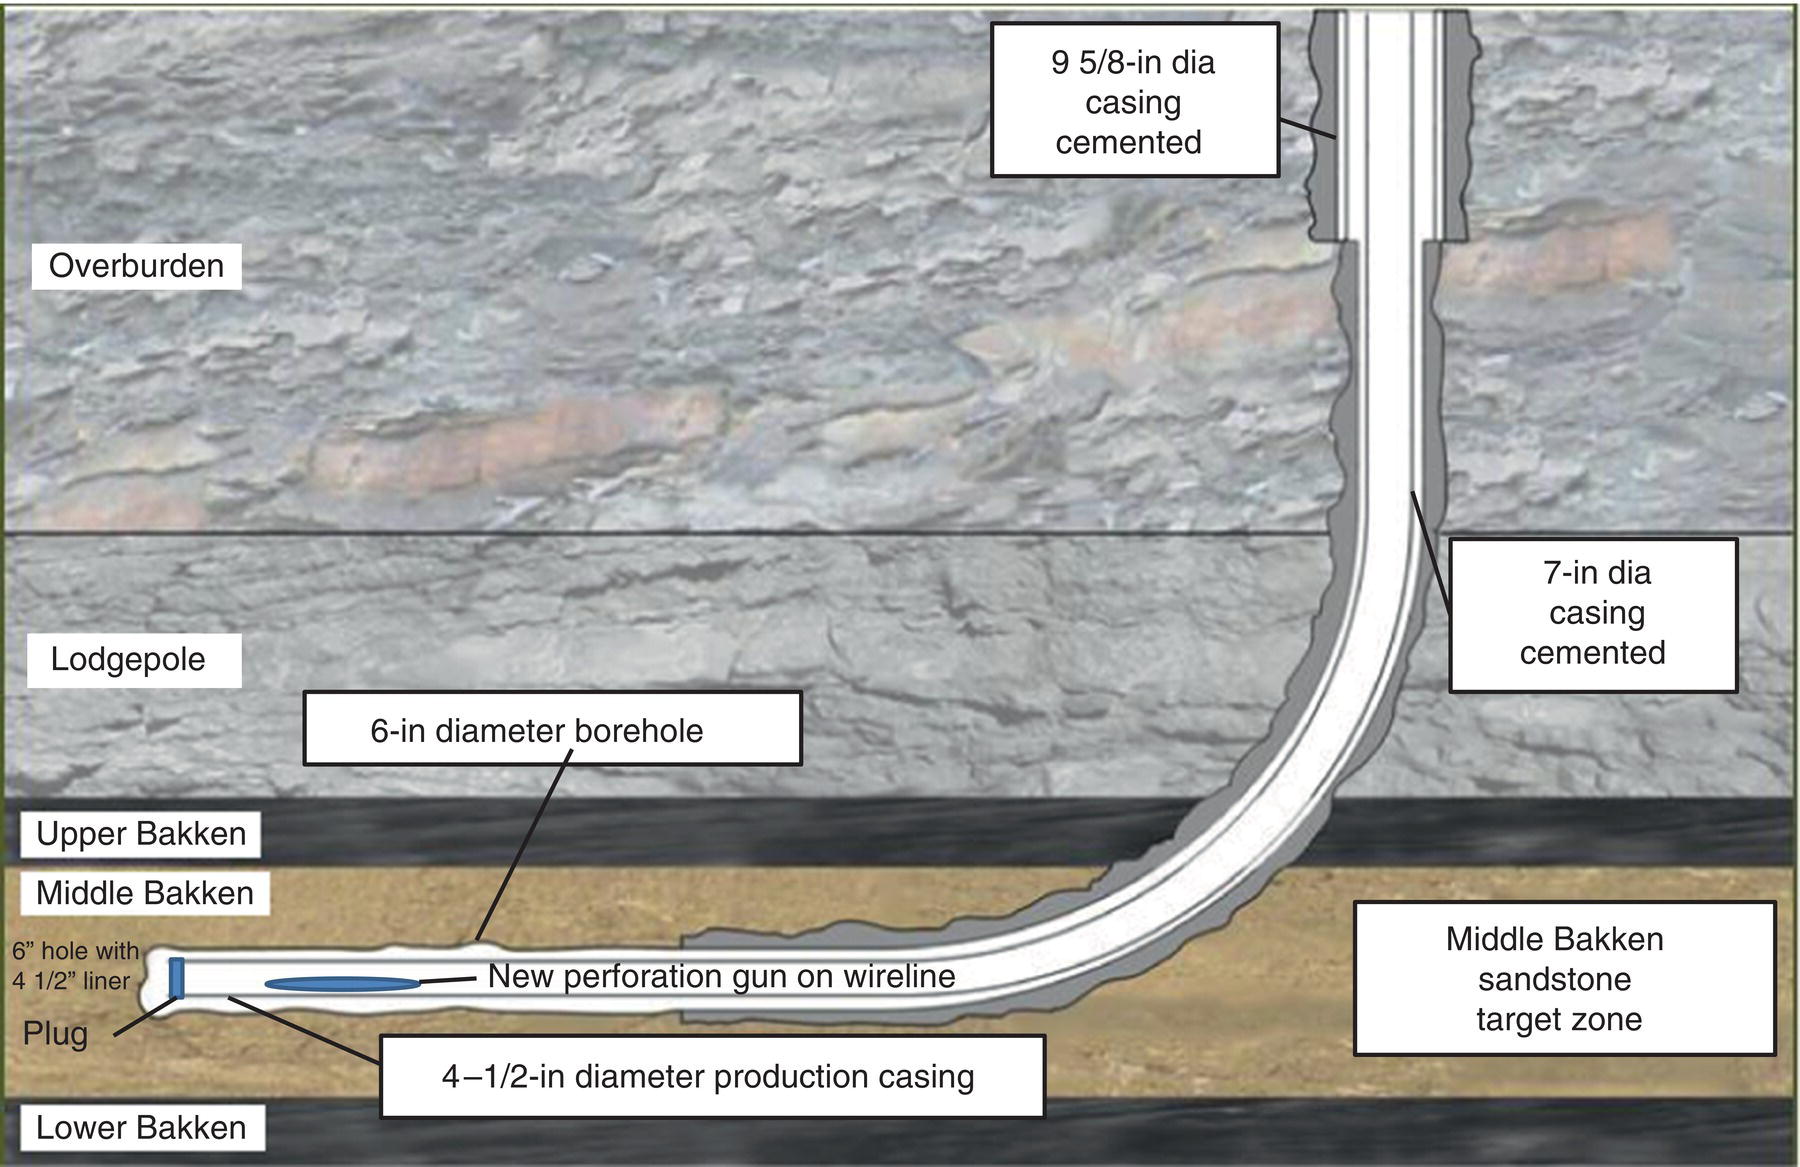
Figure 4.24 Cemented casing completion method provides better well serviceability than open hole completions. This method may seal off natural fractures that could contribute to production. Example from the Bakken Formation in North Dakota.
Source: Modified after EERC/DOE; http://www.undeerc.org/bakken/completiontechnologies.aspx.
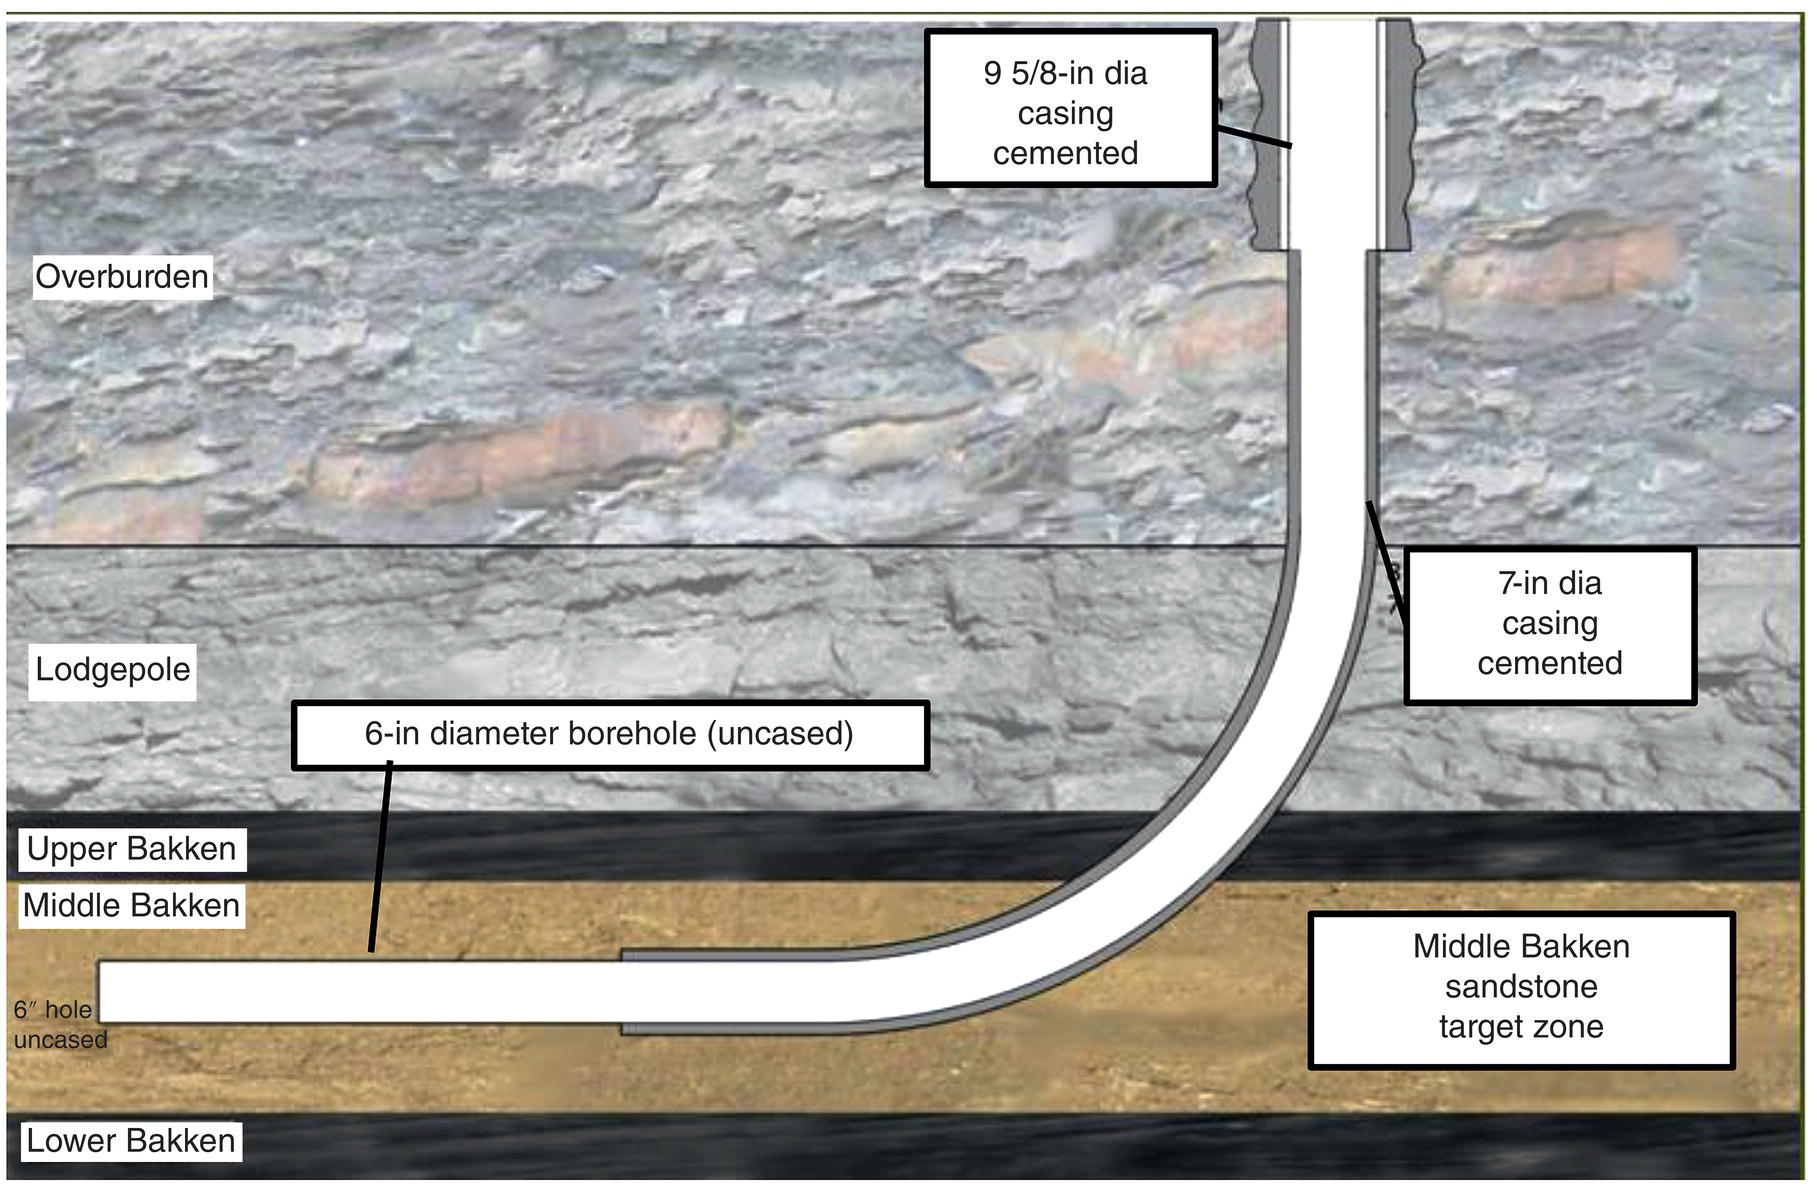
Figure 4.25 Open borehole completion method has 7‐in‐diameter casing and then horizontal uncased 6‐in‐diameter open borehole. This fast and low‐cost method uses a single fracture treatment with little control. Example from the Bakken Formation in North Dakota.
Source: Modified after EERC/DOE; http://www.undeerc.org/bakken/completiontechnologies.aspx.

Figure 4.26 Uncemented, pre‐perforated liner method without annular isolation allows fluids to migrate inside or outside the liner. Perforations can be made with a perforation gun. Example from the Bakken Formation in North Dakota.
Source: Modified after EERC/DOE; http://www.undeerc.org/bakken/completiontechnologies.aspx.
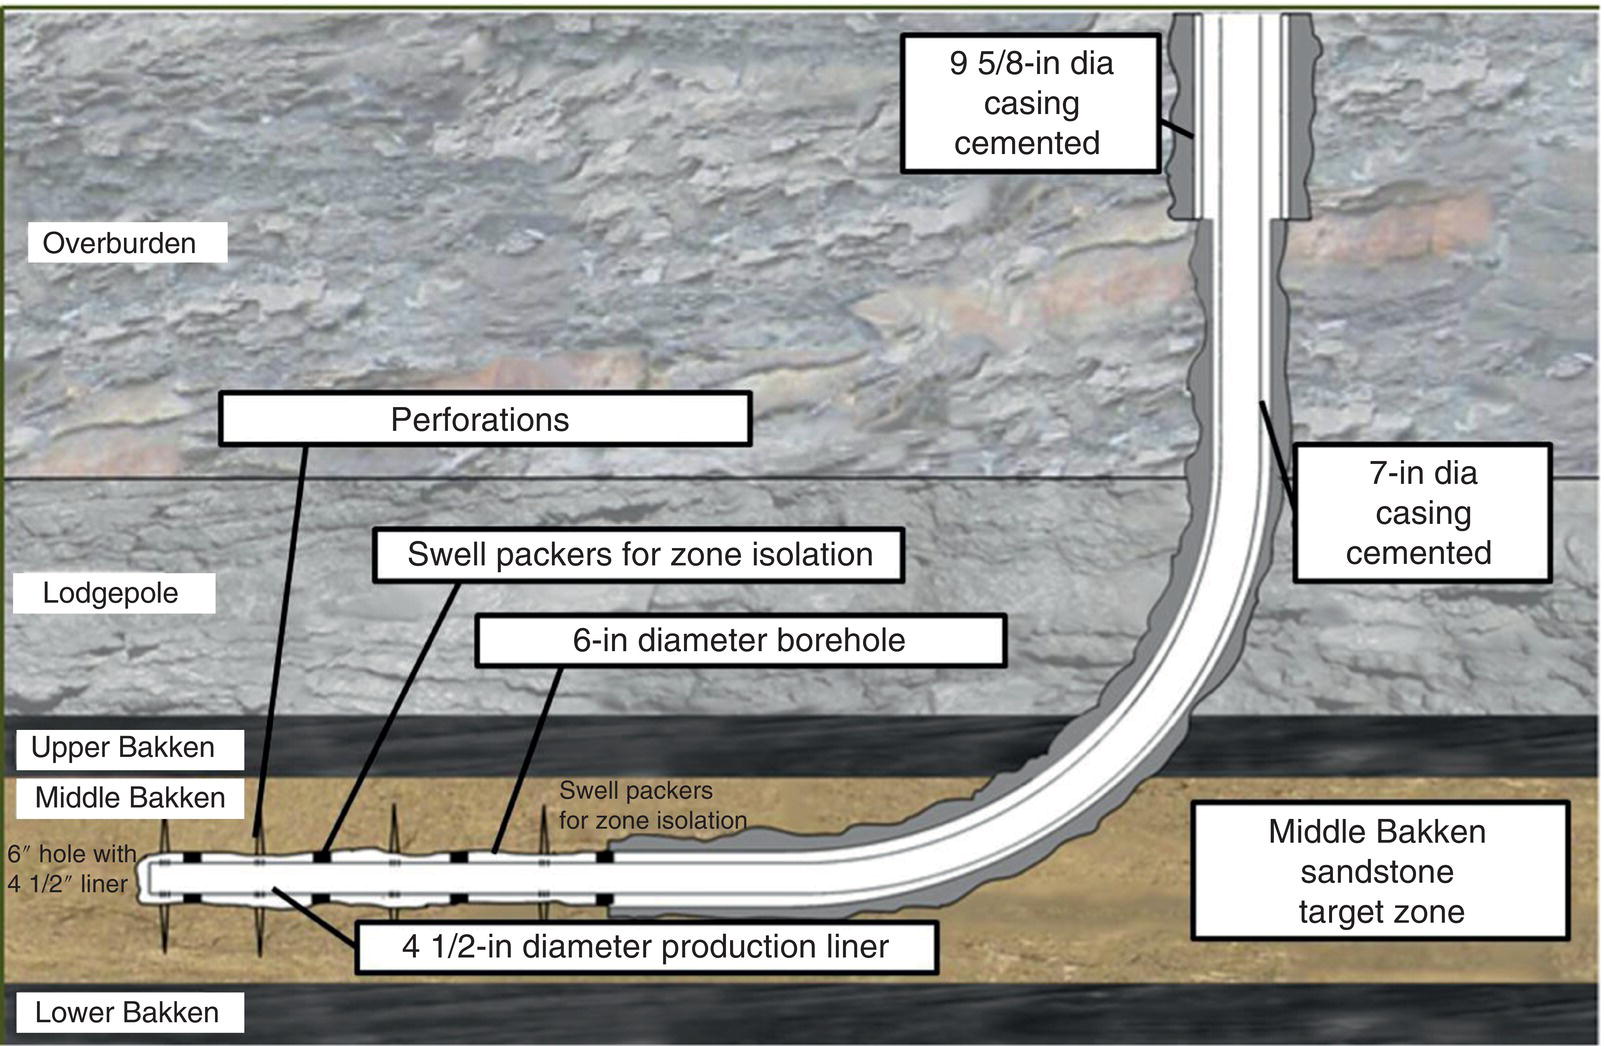
Figure 4.27 Positive annular isolation method uses an uncemented liner and swell packers, creating various stages. Example from the Bakken Formation in North Dakota.
Source: Modified after EERC/DOE; http://www.undeerc.org/bakken/completiontechnologies.aspx.
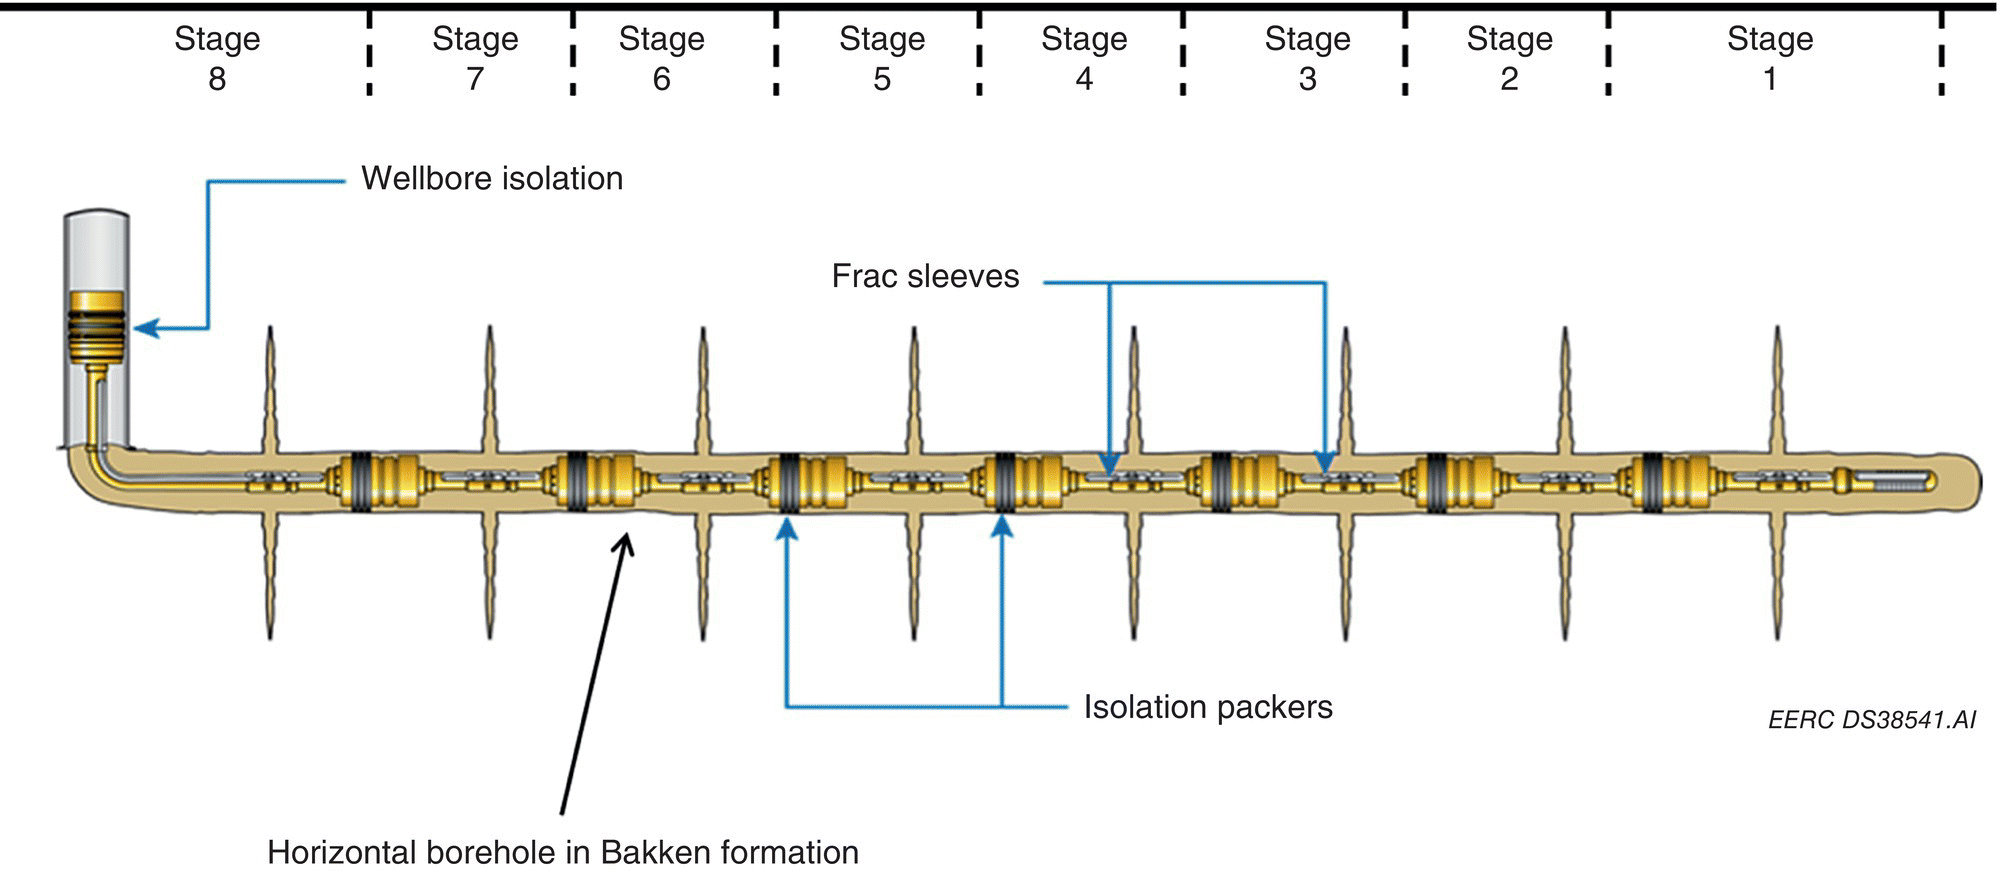
Figure 4.28 Sliding sleeve method uses ball‐actuated sliding sleeves that are mechanical isolation devices to allow for better control of the injection fluids during the hydraulic fracturing process. Example from the Bakken Formation in North Dakota. Stages start at the farthest end of the wellbore and work toward the kickoff point.
Source: Modified after EERC/DOE; http://www.undeerc.org/bakken/completiontechnologies.aspx.
The hydraulic fracturing process starts with perforation. A perforating gun (Figure 4.29) is lowered by wire line into the target interval. An electrical current is sent down and sets off a charge that shoots small holes through the casing and cement (or open hole) and into the formation (Figure 4.30). The perforation gun is then retrieved from the borehole. Perforating is critical to the success of the formation fracturing that continues with a series of hydraulic flushing events in the borehole with water mixed with proppants and a minute volume of specialized chemical additives in a meticulously designed manner. The pore pressure response (Figure 4.31) in the borehole during perforation shows the pressure building back up to formation pore pressure after the gun is fired.

Figure 4.29 Photo of downhole perforating gun used for hydraulic fracturing of a shale, in this case the Marcellus Shale in Pennsylvania. Reduction in hole area from inner to outer string is common. Retrieval of a perforation gun with significant burrs on the outside can damage packers, plugs, and seals.
Source: Image from Bill Cunningham; USGS; http://gallery.usgs.gov/images/03_08_2013/v0Qd72Gts4_03_08_2013/large/Perforating_Gun.jpg.

Figure 4.30 Schematic of a perforation from a perforation gun (left) through the steel production liner, into cement, and into shale (right), creating perforation. Later slickwater with proppant will keep the perforation open and enlarge the fractures that will emanate from the perforation tip.
Source: Modified after King (2009).

Figure 4.31 Pore pressure response in borehole during a perforation. SWB = static wellbore pressure starts at 5000 psi; formation pore pressure is about 4000 psi.
Source: Modified after King (2009).
4.8 Overview of Hydraulic Fracturing Process
There is a difference between conventional low‐volume hydraulic fracturing that has been used for decades to stimulate high‐permeability reservoirs for a single well and unconventional high‐volume or “massive” hydraulic fracturing, used in the completion of tight oil and shale gas wells, most of which rely on horizontal drain holes (Table 4.8).
Table 4.8 General comparison of low‐volume and high‐volume hydraulic fracturing.
| Hydraulic fracturing | Target | Type of wells | Use |
| Low‐volume hydraulic fracturing (LVHF) | Conventional reservoirs | Single vertical well in conventional field | 1950s to present |
| High‐volume hydraulic fracturing (HVHF) | Unconventional tight oil and shale gas reservoirs | Multiple wells with horizontal drain holes | 1980s to present |
This book describes the high‐volume hydraulic fracturing process. The hydraulic fracturing process (Figure 4.32) has five main tasks (US EPA 2015d):
- Water acquisition.
- Chemical mixing in specialized mixing tanks or trucks with the chemical additives.
- Well injection into the formation creating fractures.
- Monitoring flowback and production waters.
- Wastewater treatment (recycling) and waste disposal.
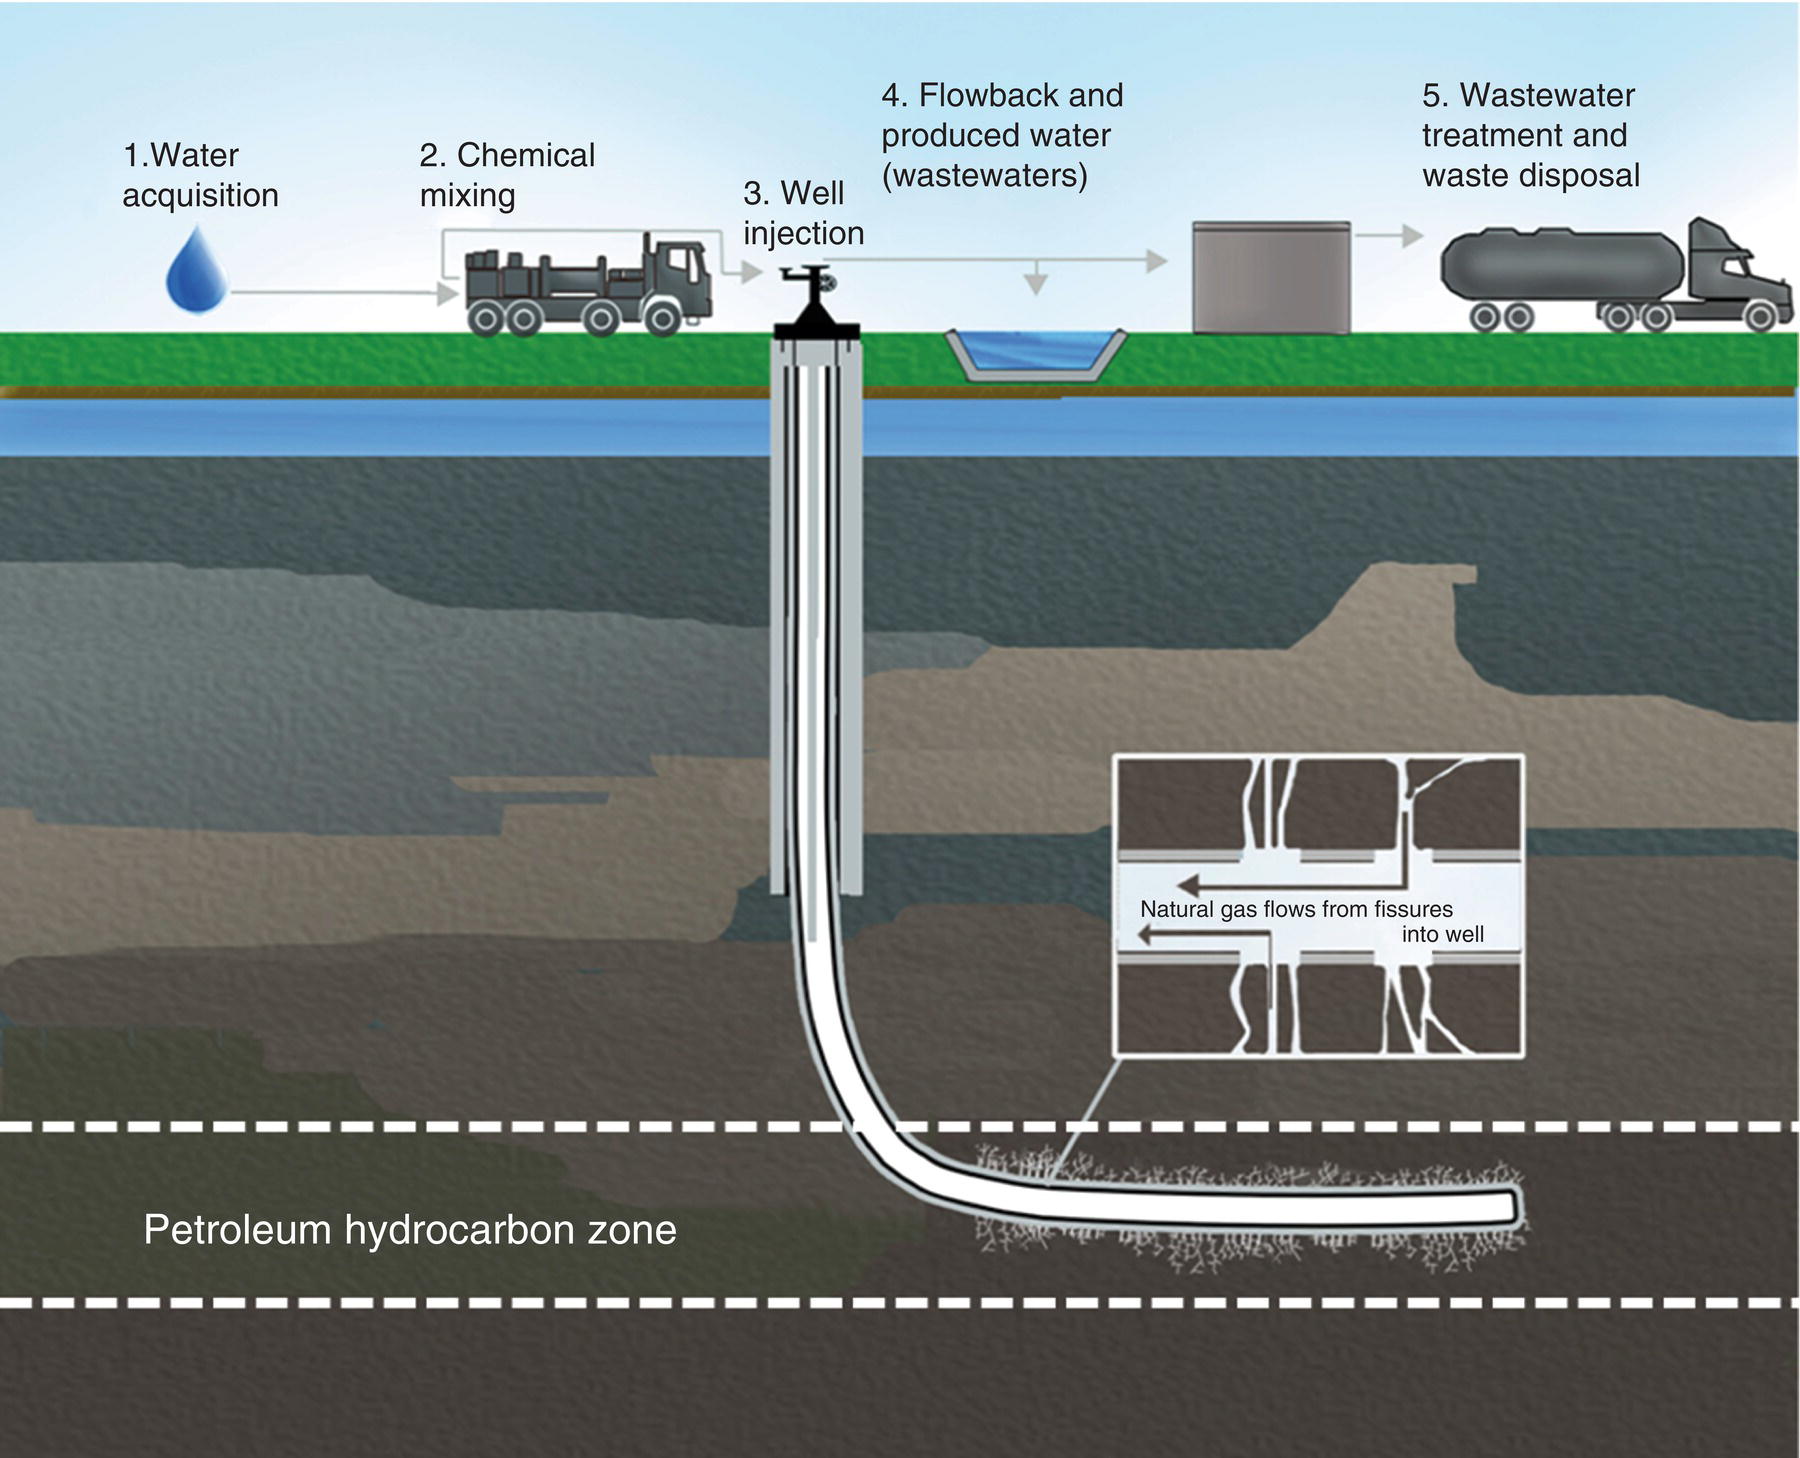
Figure 4.32 Summary of hydraulic fracturing process.
Source: Modified after US EPA (2016b); http://www2.epa.gov/hfstudy/hydraulic‐fracturing‐water‐cycle.
The hydraulic fracturing fluid is designed to:
- Extend the fractures or microfractures.
- Transport the proppant.
- Add lubrication.
- Change gel strength.
- Clean the reservoir formation prior to flowback.
Fractures occur when the fluid pressure in the hydraulic fluid overcomes the confining force of the surrounding reservoir rock. After the reservoir rock fractures, the crude oil or natural gas are released and begin to flow through the connected fractures into the drain hole and up the wellbore to the surface. The goal of the hydraulic fracturing and flushing process is cleaning the formation, removing drilling‐related debris, increasing rock porosity and permeability, and allowing the maximum volume of hydrocarbons to be released from the source rock:
- Increase the drainage area and optimize the draining potential of the slanted or horizontal well.
- Optimize flow rate of hydrocarbons from low‐permeability reservoirs or damaged wells.
- Connect the natural fractures in the source rocks to the borehole.
- Minimize paraffin, asphaltene, and sand production by decreasing the pressure drop around the borehole.
There are several media that can be pumped into a rock formation under great pressure to enhance permeability in rock formations creating or enhancing existing fractures and microfractures (Figure 4.36). Two processes can be used to create permeability and fractures in rocks: (i) hydraulic processes use fluids under pressure, and (ii) pneumatic processes use air, nitrogen gas, carbon dioxide gas, and other compounds. In addition, there are also gels and foams that have been used for the fracturing enhancement process. The most commonly used fracture method in the oil and gas industry is hydraulic, since water is generally available, can be recycled or treated, is generally inexpensive, and is an uncompressible compound. Water can withstand pressures and temperatures found in the subsurface at depth, and water can double as a carrier fluid for chemical additives and proppants. Public pressure on operators to conserve or recycle water resources during the hydraulic fracturing operations has been well documented and will continue. Fortunately, continuous improvements in the efficiency of the hydraulic fracturing process with the addition of green chemicals, gases, foams, and gels can optimize water resources during the fracturing operations. Due to the widespread use of hydraulic fracturing techniques in the production from tight oil and shale gas formations, the discussion below is focused on water‐based fracture stimulation methods. The hydraulic fracturing operation lasts for several days to about two weeks compared to the production of the well, which could last decades (Figure 4.33).
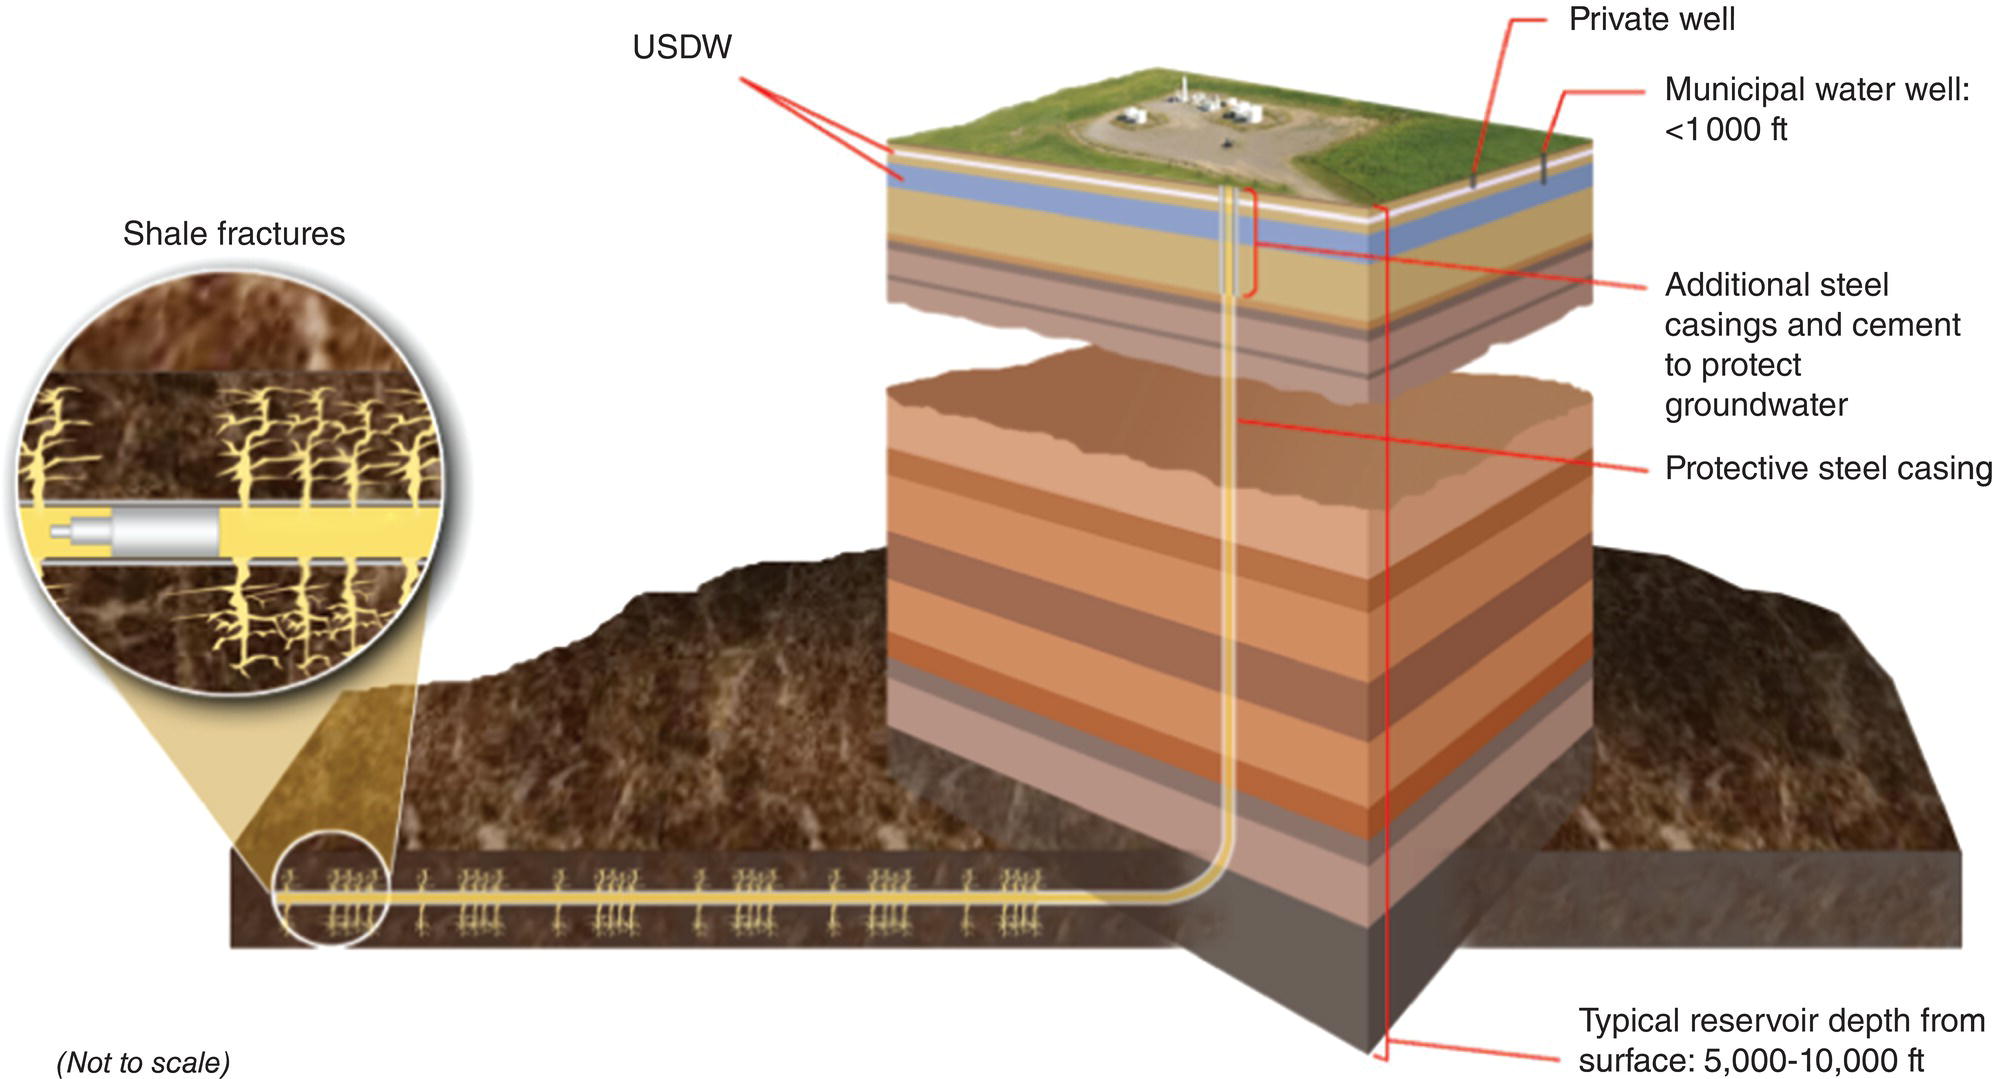
Figure 4.33 Detail of shale fractures in unconventional reservoir. Each group of closely spaced fractures is a stage, separated by the other stages when fractured by a plug, packer, or ball. The fracturing process usually starts at the end of the well first, returning to the kickoff point.
Source: From US DOE (2014); http://energy.gov/fe/shale‐gas‐101.
4.8.1 Technology Improvements
The general theme of high‐volume hydraulic fracturing has remained the same for over a decade. Technological improvements will continue to be made with dramatic production results. Nowhere are these improvements more apparent than in the Bakken Formation production area in North Dakota. Over nine years (2006–2014), data from the North Dakota Department of Mineral Resources (NDDMR) shows the increase of the average lateral length of the drain hole and an increase in the number of fracture stages. These two improvements allow for increases in the volumes of fluid injected per well. The average lateral length of the well drain hole in 2006 was 6200 ft (1890 m), and by 2014, the same average length was 9700 ft (2957 m), an increase of 56%. Due to the increased horizontal drain hole length, average fracturing fluid volume also increased from 9 900 bbls (1 574 m3) in 2006 to 89 700 bbls (14 261 m3) in 2014, an increase of 9 times (EERC 2016). These technology improvements allow for more drainage per well, lower overall costs of resource extraction per field, and the need for less well pads and wells. Below is a description of the hydraulic fracture stimulation process.
4.9 Single‐Stage Treatment
Each horizontal well might have a dozen or more stages. The first stage (stage 1 as shown in Figure 4.27) starts at the farthest area or toe of the horizontal well. The entire hydraulic fracture stimulation process is computer controlled. The hydration and blender equipment come on separate trucks. The hydration unit is designed to optimize hydraulic fluid performance and is used to mix water and the specialty chemical additives that make up the hydraulic fluids. Flow rates for an industrial hydration unit might be 16 m3 min−1 at 6 kg m−3 (100 barrels min−1 at 50 lb per 1000 gal). Blenders prepare the fracturing slurries and gels by mixing in liquid carbon dioxide (CO2) or other compounds and proppants. Flow rates for a blender unit might be 10 m3 min−1 (65 barrels min−1). Multiple truck‐mounted hydration and blender units are used on hydraulic fracture stimulation projects.
4.9.1 Four‐Phase Treatment
A single stage of sequenced hydraulic fracture treatment consists of generally four phases with associated substages; however, specific phases can be repeated. The four phases or substages are:
- Phase 1: Acid injection.
- Phase 2: Slickwater injection.
- Phase 3: Proppant sequence injection broken into numerous subphases.
- Phase 4: Flushing phase.
After the documentation and detailed testing of the hydraulic pumps and other equipment has been completed, the hydraulic fracturing process begins. An example of a single‐stage fracture treatment event from the Marcellus Formation in western Pennsylvania shows a total volume of 538 000 gal of injected water (2.0 million liters) (Table 4.9) (US DOE (2009) as seen in Arthur et al. (2008)). If the well has 5000 linear feet (1524 m) of horizontal borehole, there might be five stages, each about 1000 linear feet long. If there are 5 stages and each stage uses about 500 000 gal (1.9 million liters) of hydraulic fracturing fluids, the total water used for the five stages would be 3 million gallons (11.3 million liters). The amount of water and various chemical additives are shown as a pie chart (Figure 4.37). Table 4.10 lists the classes of common chemical additives with their function and common uses (US DOE 2009). High‐viscosity fracturing fluids are used to create large but fewer reservoir fractures. High rate fluid injection, called a slickwater injection, creates a set of numerous small microfractures. Fracture and microfracture monitoring is performed to evaluate fracture geometry and connectivity. Estimated water needs in selected shale basins are summarized in Table 4.11 (Figure 4.34).
Table 4.9 Example of a single stage of a sequenced 15‐stage hydraulic fracture stimulation treatment.
| Hydraulic fracture stimulation phases and substages | Volume (gallons) rate (gal min−1) | Phase volume (gal) | Substage volume | Rate (gal min−1) |
| Phase 1: Acid injection | Diluted acid (15% diluted HCL) | 5000 | 500 | |
| Phase 2: Slickwater pad | Pad to open formation area | 100 000 | 903 000 | |
| Phase 3: Proppant sequence injection | Proppant injection (15 substages) | 420 000 | 3 000 | |
| Phase 3, substage 1 | Proppant injection | 50 000 | ||
| Phase 3, substage 2 | Proppant injection | 50 000 | 3 000 | |
| Phase 3, substage 3 | Proppant injection | 40 000 | 3 000 | |
| Phase 3 substage 4 | Proppant injection | 40 000 | 3 000 | |
| Phase 3, substage 5 | Proppant injection | 40 000 | 3 000 | |
| Phase 3, substage 6 | Proppant injection | 30 000 | 3 000 | |
| Phase 3, substage 7 | Proppant injection | 30 000 | 3 000 | |
| Phase 3, substage 8 | Proppant injection | 20 000 | 3 000 | |
| Phase 3, substage 9 | Proppant injection | 20 000 | 3 000 | |
| Phase 3, substage 10 | Proppant injection | 20 000 | 3 000 | |
| Phase 3, substage 11 | Proppant injection | 20 000 | 3 000 | |
| Phase 3, substage 12 | Proppant injection | 20 000 | 3 000 | |
| Phase 3, substage 13 | Proppant injection | 20 000 | 3 000 | |
| Phase 3, substage 14 | Proppant injection | 10 000 | 3 000 | |
| Phase 3, substage 15 | Proppant injection | 10 000 | 3 000 | |
| Phase 4: Flushing phase | Cleaning flush | 13 000 | 3 000 | |
| Total | 538 000 | 420 000 |
Table 4.10 Example of chemical additives for fracturing, main compounds, and common uses (US DOE 2009).
Source: From Groundwater Protection Council (2009).
| Additive type | Main component | Purpose | Other common uses |
| Acid | Hydrochloric acid (HCl) | Helps dissolve minerals and initiate fractures in the formation | Swimming pool chemical and cleaner |
| Biocide (antibacterial agent) | Glutaraldehyde (C5H8O2) | Eliminates bacteria in the water | Disinfectant (sterilizer for medical and dental equipment) |
| Breaker | Ammonium persulfate ((NH4)2S2O8) | Breaks down polymer chains to reduce viscosity of fracturing fluid | Disinfectant and hair coloring |
| Buffer | pH adjusting agent | Controls pH of fluids to maintain effectiveness of other components, such as crosslinkers | Detergent, soap, and water softener |
| Corrosion inhibitor | N,N‐Dimethylformamide (C3H7NO) | Prevents the corrosion of the well casing | Pharmaceuticals, acrylic fibers, and plastics |
| Crosslinker | Borate salts (ex.: BNa3O3) | Maintains fluid viscosity as temperature increases | Laundry detergent, hand soap, and cosmetics |
| Friction reducer | Mineral oil (CAS# 8042‐47‐5)/polyacrylamide (C3H5NO)n | Minimizes friction between the fluid and pipe | Water treatment, soil conditioner, makeup remover, and candy |
| Gelling agent | Guar gum (CAS# 9000‐30‐0) | Thickens the water to suspend the proppant | Cosmetics, toothpaste, and ice cream |
| Iron control | Citric acid (C6H8O7) | Prevents precipitation of metal oxides | Food additive, food and beverage flavoring, and lemon juice |
| Potassium chloride | Potassium chloride (KCl) | Creates a brine carrier fluid | Low sodium table salt substitute |
| Oxygen scavenger | Ammonium bisulfate ((NH4)HSO4) | Removes oxygen from the water to protect the pipe from corrosion | Cosmetics, food and beverage processing, and water treatment |
| Scale inhibitor | Ethylene glycol (C2H6O2) | Prevents scale deposits in the pipe | Deicer, household cleansers, and paints |
| Surfactant | Isopropanol (C3H8O) | Reduces surface tension of fracturing fluids to improve the liquid recovery | Glass cleaner, deodorant, and hair color |
Table 4.11 Estimated water needs for drilling and fracturing wells in selected shale gas provinces.
Source: From US DOE (2009).
| Shale gas play | Volume of drilling water per well (gal) | Volume of fracturing water per well (gal) | Total volumes of water per well (gal) |
| Barnet shale | 0.40 million | 2.3 million | 2.70 million |
| Fayetteville shale | 0.060 milliona | 2.9 million | 3.06 million |
| Haynesville shale | 1.00 million | 2.7 million | 3.70 million |
| Marcellus shale | 0.080 milliona | 3.8 million | 3.88 million |
Deeper drilling with air mist and/or water‐based or oil‐based muds for deep horizontal well completions. 1 gal = 3.79 l.

Figure 4.34 A generalized fracturing fluid and list of additives (US DOE 2009).
4.9.1.1 Treatment Phase 1: Acid Injection
The first flush of the borehole is a cleaning phase and usually starts with several thousand gallons of water mixed with a dilute acid such as hydrochloric acid. This phase of injection cleans the hole of drilling‐derived debris. In the Marcellus example (see Table 4.5), phase I consists of pumping 5 000 gal (18 927 l) of water consisting of 85% water and 15% diluted hydrochloric acid by volume down the borehole. Phase 1 is pumped at a rate of 500 gallons per minute (gpm) (1893 liters per minute [lpm]) to clean the near annular walls of drilling mud filter cake and the formation that can become plugged with cement and other debris from the drilling mud and casing cement. The acid cleans the natural fractures and pores and pore throats in the formation walls and provides an open conduit for other hydraulic fracture stimulation fluids by dissolving carbonate minerals and opening fractures near the borehole. Biocides or disinfectant compounds can be used to prevent the growth of bacteria in the borehole that may interfere with the hydraulic fracture stimulation operation. The acid may be diluted by over 100 times by the time the single stage of sequenced hydraulic fracture treatment consisting of the four phases has been completed. Preferred water sources from best to least costly are freshwater, saline groundwater, flowback water, and finally produced water.
4.9.1.2 Treatment Phase 2: Slickwater Injection
The second phase is the high flow slickwater pad injection and frequently does not contain any solids. Injection fluid not containing solids is called a pad, and the slickwater pad from the Marcellus Formation consists of a water‐based fracturing fluid and no sand. In other cases, the slickwater fluid is mixed with a limited amount of sand and a friction reducing agent and chemical additives to improve the efficiency of the hydraulic fracturing. This part of the injection forms and opens the fractures from the perforation tunnel. The pad is a volume of fracturing fluid large enough to effectively fill the borehole and the open formation area. The slickwater injection phase is not the phase where the majority of the induced fracturing and propping of the fractures occurs (phase 3). The slickwater pad helps to facilitate the flow and placement of the proppants further into the fracture network. During the process of hydraulic fracturing, the slickwater pad can be pumped down the borehole as fast as 100 bbl min−1 (4 200 gpm; 15 899 lpm) to fracture the shale, as opposed to ~60 bbl min−1 (2 520 gpm; 9 539 lpm) the rate of typical fracturing fluids. In the Marcellus example, the slickwater pad consists of ~100 000 gal (378 541 l) pumped at a rate of about 3 000 gpm (11 356 lpm). Slickwater is typically used in highly pressurized, deeper shales, while fracturing media such as nitrogen foam, for example, may be more common in shallower shales and those that have lower reservoir pressure.
4.9.1.3 Treatment Phase 3: Proppant Sequence Injection
After the slickwater pad has been pumped and the pressure has subsided, the proppant sequence injection begins with a large volume of solids. Examples of proppants include natural quartz sand (Figure 4.35, top) and manufactured ceramic proppants (Figure 4.35, bottom). The purpose of the proppant is to keep the existing intersected natural fractures and induced fractures open and connected to allow petroleum hydrocarbons to drain from the formation and to enter the well. During phase 3, the fluid injection pumps increase the hydraulic pressure again, squeezing in proppant materials to open the newly made fractures (Figure 4.36). Proper proppant selection to match the size of the proppant to the forecast fracture size is critical to well production success. The initial proppant in the Marcellus Formation example is a 100‐mesh sand, which is a fine‐grained sand. About halfway through the proppant sequence injection in this example, the proppant size is increased to a 40/70 mesh sand, which is a medium‐ to fine‐grained sand. In the Marcellus example, the proppant sequence injection consists of a total volume of 420 000 gal (1.6 million liters) of water with the proppant media, all of it at 3 000 gpm (11 356 lpm). The proppant injection phase is broken into 15 subphases and starts with 50 000 gal (189 271 l) at the first subphase and may contain a dilute acid solution using an acid such as hydrochloric acid (HCl). The subphases generally start with larger volumes of water and a smaller‐size proppant, a reflection of the ability of the formation to initially accept the pumped fluids. Later subphases decline from a high volume of 50 000 gal to a low volume of 10 000 gal (37 854 l) for the last subphase (Figure 4.35).

Figure 4.35 Photograph (top) of fine‐grained well‐sorted quartz sand used as a proppant in the Marcellus Shale. . Photograph (bottom) of ceramic proppant. About 3–5 million pounds of ceramic proppant is used per Bakken well. 2000 wells would weigh 4 million tons. Photomicrograph of sintered bauxite ceramic proppant spheres used for hydraulic fracturing in the Bakken Formation in North Dakota (Anderson 2011).
Source: Image from Bill Cunningham, USGS; US DOE (2014); http://energy.gov/sites/prod/files/2013/04/f0/how_is_shale_gas_produced.pdf
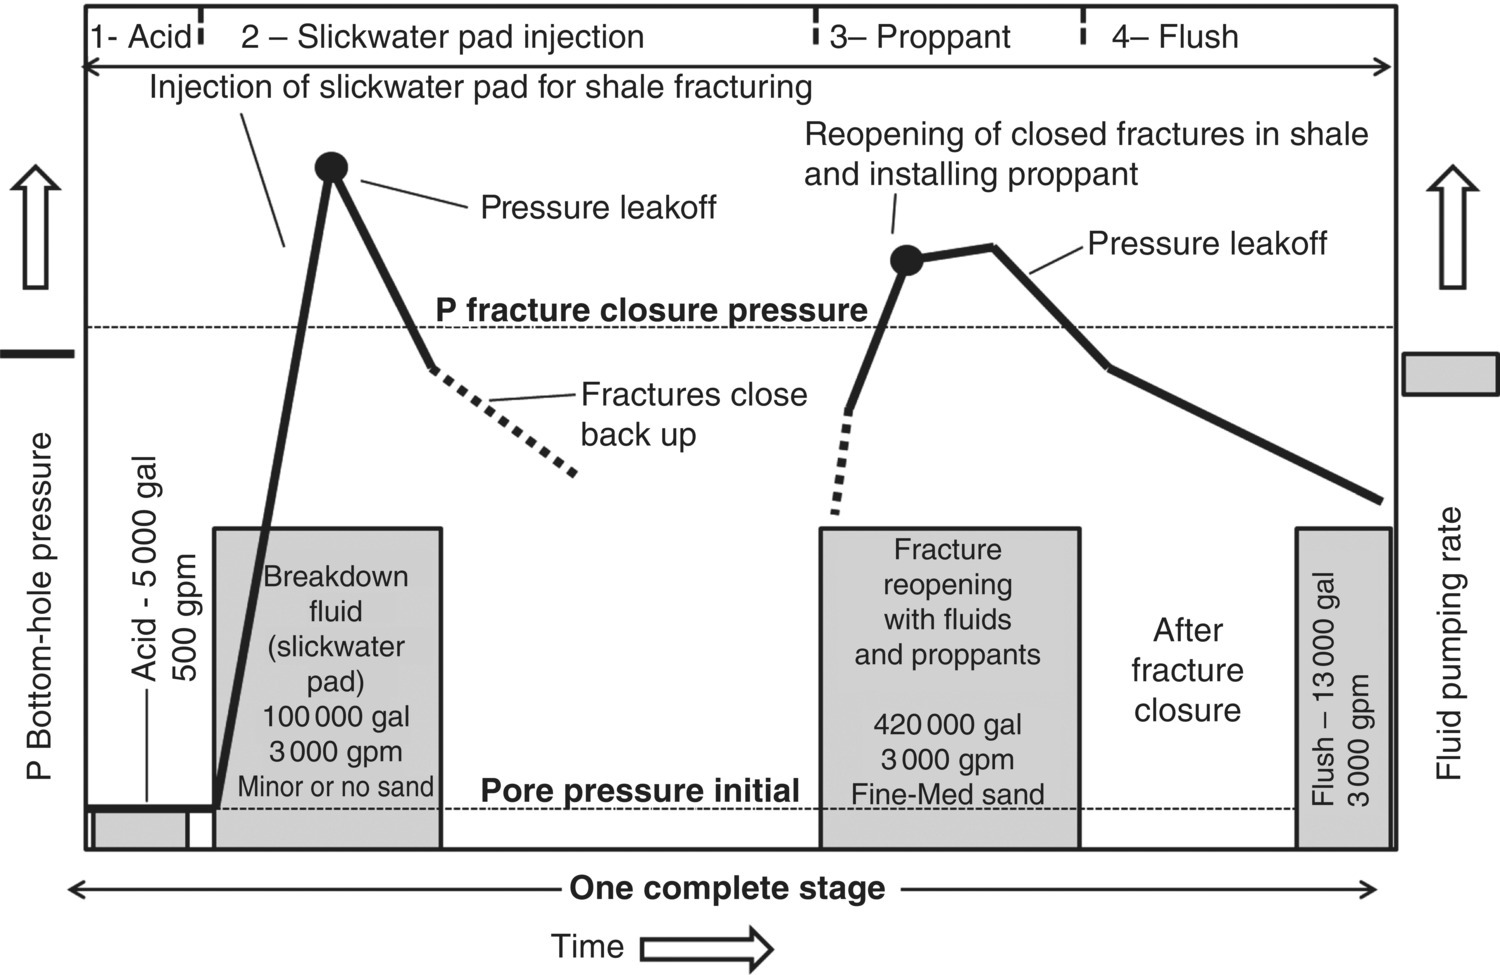
Figure 4.36 Example of a four‐stage process (1, acid injection; 2, slickwater pad injection; 3, proppant injection; and 4, flush) showing pore pressures during initial fracturing, closure, and then the reopening of the fractures with the fluids and proppants.
4.9.1.4 Treatment Phase 4: Flushing Phase
The final cleaning phase of the hydraulic fracture stimulation process is phase 4, the flushing phase, and it starts after the final proppant injection has been completed. Phase 4 starts with cleaning and flushing using a volume of freshwater sufficient to remove excess proppants and grit from the equipment and the borehole. In the Marcellus example, the final phase typically consists of a flushing of 13 000 gal (49 210 l) of freshwater typically a rate of 3 000 gpm (11 356 lpm).
4.10 Fluid Recovery and Waste Management
After the hydraulic fracture stimulation occurs, the flowback waters are recovered, stored, and recycled or disposed of properly. Chemicals of environmental concern are either produced on‐site as naturally occurring compounds or are imported as industrial compounds. Produced compounds associated with oil and gas fields (that may be considered hazardous) include crude oil, natural gas, (which is primarily methane); and coproduced, generally saline waters, called brines. In some cases, naturally occurring radioactive materials (NORM) from the subsurface can also be coproduced with the extracted fluids and gases as a waste during oil and gas field operations.
Due to the large number of potentially explosive and highly reactive compounds at oil and gas fields, worker training on the safe and proper handling, use, storage, and conveyance of the produced fluids and disposal of the coproduced wastes and used imported compounds is critically important to minimize accidental spills and avoid job‐related injuries. Proper training and documentation is necessary to verify compliance with safety procedures.
The physical and chemical characteristics of the produced compounds are described first (below), with a discussion of imported compounds later in the section. For landowners or operators wanting to document baseline conditions in water, in soil, or even in air, selected background concentrations of particular compounds are useful in establishing defensible and credible initial defensible pre‐drilling conditions.
4.10.1 Flowback Fluids
After all injection of fracking fluids and flushing water has been injected, the flowback begins (US DOE 2009). Flowback includes the fluids that return to the surface during and after the completion of hydraulic fracture stimulation process. Flowback includes the fluid used to fracture the target zone, in the example above, the Marcellus Shale. The fluid also contains clays, chemical additives, dissolved metal ions, and TDS. The fluid frequently has a cloudy appearance from the high levels of suspended particles. Most of the flowback in a formation occurs in the first 1–20 days (18–37% flowback of injected frac fluid), while the rest can occur over 30–90 days, where the total flowback volume is 20% to 44% of the volume of frac fluid that was initially injected into the formation (US DOE 2013a, b; Abdalla and Drohan 2010; PSE 2011). The rest of the hydraulic stimulation fluid (phase 1 through phase 4, above) remains trapped in the pores and lattice structures of the hydrated minerals (of the Marcellus Formation). At some point, petroleum hydrocarbon breakthrough into the borehole and the water recovered from an oil or gas well makes a subtle transition from flowback water to coproduced water. This transition point is identified based on the rate of return of the fluids measured in barrels per day (bpd) and evaluation of the chemical composition of the fluids. Flowback fluids are typically produced at a higher flow rate over a shorter period of time, usually >50 bpd (7.9 m3 day−1) than the coproduced water, which is characterized by a generally much lower flow rate.
The US EPA (2013a, 2015a, b, 2016a) evaluated other compounds in the influent water, influent blend (fracturing fluid), and the flowback fluids. The studies analyzed volatile organics, semivolatile organics, pesticides, organophosphorus pesticides, PCBs, metals, and radiological material. Not surprisingly, the hydrocarbon coproduced water contained benzene, toluene, ethylbenzene, and xylenes, which are natural components of crude oil as well as fuels refined from petroleum hydrocarbons. Most of the volatiles and semivolatile compounds on the US EPA list were man‐made industrial chemicals that were not generally found in produced waters but reflected flowback fluids. Pesticides were not found in the produced water in the EPA study.
In some cases, flowback fluids might be treated and then discharged under permit into the local municipal wastewater treatment system. Although uncommon, the Woodford Formation flowback water is managed under permit through the Oklahoma Corporation Commission to allow for some disposal by land application (DOE 2009).
4.11 Oil and Gas Production
In preparation for oil and gas production, the well is completed with the installation of production piping or tanks for storage and transportation of produced oil and gas. Handling of coproduced water must also be addressed. Wellheads are installed to perform tests as well as to control produced fluids (Figure 4.36).
Initial oil saturation decreases in a reservoir as coproduced water increases (Figure 4.40). Production equipment is installed, operated, and maintained as routine production is monitored and evaluated. Once the well is producing, produced hazardous materials are usually removed from the site, nonhazardous wastes, if present, are segregated and labeled, and erosion control measures are maintained on the production pad (Figure 4.41). Besides regular operations and maintenance visits to the well site for inspections, production and environmental monitoring, and equipment repairs, few additional trips occur during production activities (Figures 4.37 and 4.38).
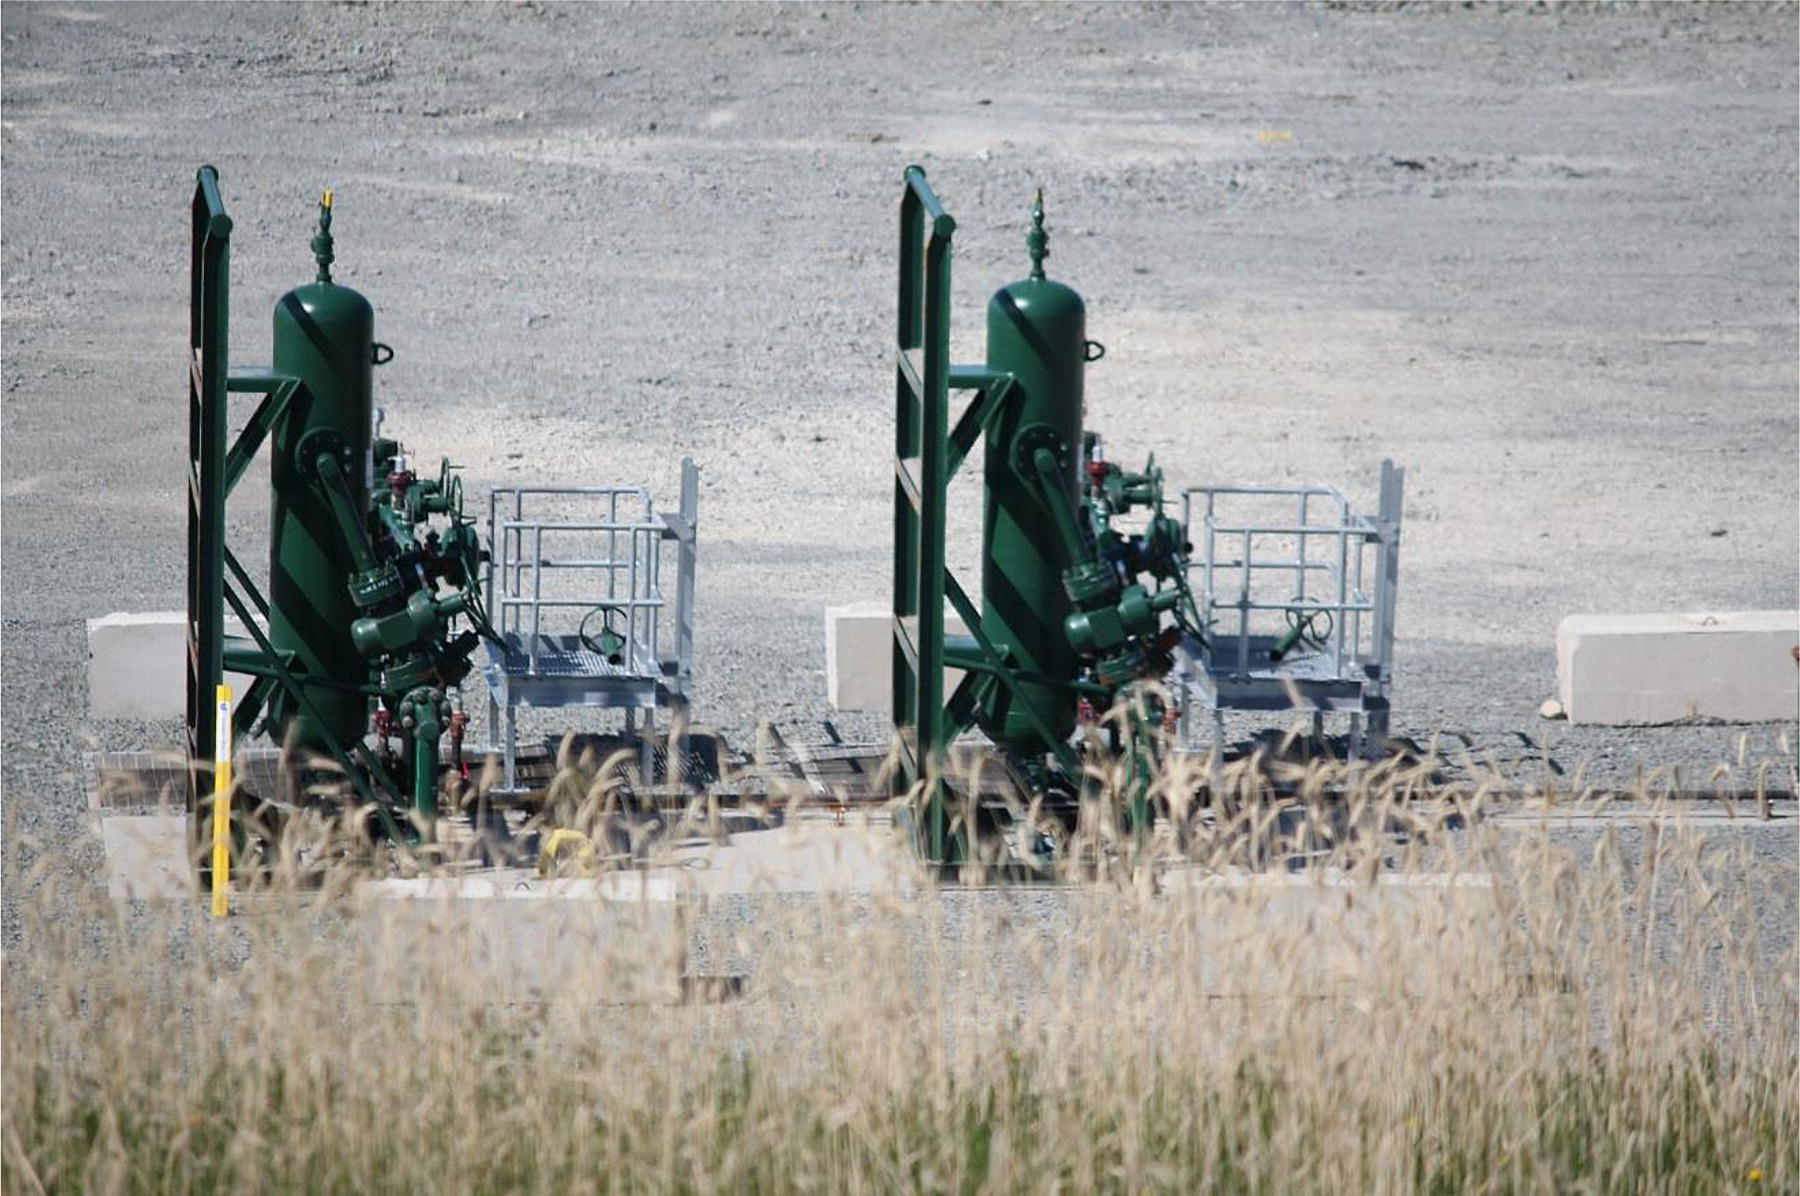
Figure 4.37 Wellhead completion on two Marcellus Formation gas wells in northeastern Pennsylvania.
Source: Image from James Jacobs.

Figure 4.38 Marcellus gas production in northeast Pennsylvania (top) starts with installing wellheads (two seen in center of pad (1)). Note the erosion controls (wattles (2), gravel (3), and berm (4)). Fluid tanks (5) are still on‐site after fracking event a few days earlier. A few miles away, gas production (below) has been ongoing for a few years, with minimal disruption to the landowner. Once active drilling, hydraulic fracturing and production tests are completed, active gas production facilities should generally have minimal operational activities and disruption.
Source: Images from James Jacobs.
After initial oil and gas production, enhanced oil or gas recovery techniques and workovers are used to optimize production. Declines in crude oil production may be addressed using pump jacks (also called beam pumps, oil horse, donkey pumper, etc.) or downhole submersible pumps. Secondary oil recovery may use water, air, or carbon dioxide injection or natural gas reinjection. A variety of tertiary recovery methods, such as enhanced oil recovery (EOR) or enhanced gas recovery (EGR) strategies exist to optimize production: injected fluids and gases such as nitrogen or carbon dioxide increase pressure in the reservoir, assisting migration of crude oil or natural gas to the producing well. The miscible water‐alternating gas process creates a final water drive that flushes the remaining crude oil, now mixed with carbon dioxide, from the reservoir. Cyclic carbon dioxide injection swells oil and reduces crude oil viscosity due to the high solubility of carbon dioxide. Alkali–surfactant–polymer flooding includes several stages in which the chemistry is designed to improve rock wettability, increasing the mobility of crude oil. Cyclic steam injection has three steps: the initial steam injection lasts for a few days to weeks, the soaking stage lasts for a few days in which heat reduces crude oil viscosity, and the final production phase lasts for an extended period (Al‐Mjeni et al. 2011).
Unconventional reservoirs can have rapid production declines, and wells may be uneconomic after 5 years or may be profitable to 45 or more years. The longevity of oil and gas production is affected by many factors, including the ratio of water production to hydrocarbon production; the price paid for crude oil and natural gas, which varies over time; the serviceability of the existing production equipment and facilities; taxes; the costs of operations and maintenance; the cost of wastewater disposal; the costs for environmental compliance; and other issues. Over time, an increasing percent of coproduced water accompanies the declining hydrocarbon production (Figure 4.39).

Figure 4.39 Close‐up schematic of the changes from initial oil saturation in a conventional oil reservoir (left) to mostly water saturation in a depleted or produced reservoir (right) that require enhanced oil recovery methods to improve production economics. Residual oil zones (ROZs), an unconventional oil source, start with high water saturation (right). Bottom figures provide the legends.
4.11.1 Residual Oil Zones: Unconventional Target
Primary and secondary oil production has oil saturations in conventional reservoirs starting at typically over 50%. An oil deposit that has notable oil shows in cores and cuttings and even in drill stem tests (DSTs) but has a starting natural oil saturation of 20–25% has not generally been an attractive exploration and production target. With the development of horizontal drilling and hydraulic fracture stimulation methods, residual oil zones (ROZs) have started to be an attractive target as a source of unconventionally produced oil and gas (see Figure 4.40).

Figure 4.40 General concept of resource potential of the residual oil zone (ROZ), also called transition zone.
Source: Modified after Melzer (2006).
A transition zone between an oil‐bearing zone and the underlying water zone has been referred to as the oil–water contact. Under certain conditions, a thick ROZ may exist below the transition zone (Melzer 2006). The San Andres Formation in the Permian Basin in west Texas contains ROZs. ROZs may be caused when regional uplift or tilting allows oil to migrate updip into new positions, leaving behind an ROZ. If no associated primary production exists, it is considered a “green fields” ROZ (Vance 2011). ROZs can also form beneath oil traps that have been breached by faults in areas of production. Although a partial oil trap is still present, the ROZ represents the area beneath the full trap that contains residual oil; these zones are called “brown fields” ROZs (Vance et al. 2011). Like enhanced conventional oil recovery, ROZs require carbon dioxide injection for production. Ultimately 90–100% of the injected carbon dioxide related to ROZ production is retained by the reservoir, which Vance (2011) aptly notes is a form of carbon sequestration. The low starting oil saturation of ROZs produces significant volumes of coproduced water, which requires reinjection, disposal, or water treatment.
4.11.2 Coproduced Water
In contrast to flowback fluids, coproduced water is naturally occurring water found in shale and tight sandstone formations that flows to the surface throughout the entire life span of the well. Coproduced water creates lower flow over a much longer period of time, typically from 2 to 40 barrel per day (bpd) as compared with the higher flowback water volumes. The coproduced water has high levels of TDS and leaches out minerals from the shale including barium, calcium, iron, and magnesium.
4.12 Naturally Occurring Radioactive Material (NORM)
Coproduced water also contains dissolved hydrocarbons such as methane, ethane, and propane along with NORM such as radium isotopes and technologically enhanced naturally occurring radioactive materials (TENORM). Details about NORM, TENORM, and crude oil and natural gas production are described in several documents (USGS 1999; US EPA 2013a; World Nuclear Association 2018). The chemical composition of flowback and coproduced water is similar, so a detailed chemical analysis is recommended to distinguish between flowback water and coproduced water. Geochemical and isotopic tracers (δ18O, δ2H), general geochemical fingerprinting using gas chromatography–mass spectrometry (GC‐MS), and ratios of various isotopes of dissolved constituents (11B/10B, 87Sr/86Sr, 238U/234U, 228Ra/226Ra) have been used to help differentiate the source of unknown fluid contaminants (Vengosh et al. 2011). The presence of soluble metals, found in coproduced waters, reflects local geologic sources. Various methods of water disposal and treatment have been developed, including class II injection wells and recycling water after industrial wastewater treatment.
4.12.1 Transportation Challenges
Transmission of the produced natural gas relies primarily on pipelines. In areas without pipelines, natural gas can be reinjected or flared. Crude oil is transported by pipeline, tanker railcar, tanker trucks, and ships. Pipelines within production areas are called gathering lines that transport the natural gas such as natural gas plant liquids (NGPL) to processing facilities and crude oil to tank batteries. From there, the products are transported by feeder pipelines to the transmission pipelines. NGPLs include compounds such as liquefied petroleum gases: ethane, propane, butane, and pentane and isopentane. Once natural gas is moved along the pipeline system to the end user, distribution pipelines are used to move natural gas to residential, commercial, and industrial customers. The mode of distribution (pipelines, rail, highway, waterways) provides opportunities for accidents and spillage.
4.12.2 Lithium Source
Although treatment of the coproduced water is expensive and typically energy intensive, the brines could (for example) be a source of lithium used in electric vehicle (EV) batteries and other lithium‐ion batteries. Concentrations of lithium vary by region, depending on geology. Lithium concentrations in coproduced waters in the Marcellus Shale region of the Appalachian Basin are estimated at 80–200 milligrams per liter (mg l−1). In 2014, the amount of produced water from the Marcellus Shale and Utica Shale of Pennsylvania was ~29 million barrels (109 777 m3). At 120 mg l−1 lithium, the annual amount of lithium in the coproduced wastewater in Pennsylvania is about 545 metric tons. At a 50–60% recovery rate, the amount of lithium production from Pennsylvania wastewaters could reach 272–327 metric tons of lithium per year, respectively (Glazer et al. 2017).
4.12.3 Oil and Gas Production Limits
A procedure for calculating the estimated ultimate recoveries of Bakken and Three Forks Formations in horizontal wells in the Williston Basin has been developed (Cook 2013). In the full life cycle of an oil and gas field (Figure 4.41), as well as individual wells, an oil or gas well reaches its economic limit as the production rate does not cover the operating expenses, including taxes. Sometimes, reworking the oil or gas well can improve production. Other times, the injection of water, special fluids, or gases such as carbon dioxide or other petroleum engineering processes can enhance dwindling production rates to restore economic production. At some point, the economic limit for individual oil and gas wells is exceeded, and the wells must be properly abandoned.
Figure 4.41 Summary of the simplified exploration–production life cycle.
Positive cash flow for oil and gas production can be maintained by (i) lowering operating costs or (ii) increasing production. Changing to more energy‐efficient and lower‐maintenance gas compressors could lower operating costs. Other cost‐saving measures include reusing and updating facilities and infrastructure. Increasing production can consist of the application of the following techniques:
- Optimizing artificial lift.
- Workover and stimulation of wells:
- Acidizing stimulation.
- Hydraulic fracture stimulation.
- Redrilling wells.
- Perforating new zones within existing wells.
- Infill drilling with new wells.
- Drilling horizontal wells.
- Controlling production limitations:
- Water and sand control.
- New well completions.
- Enhanced oil and gas recovery methods.
The economic limit for oil and gas wells can be expressed using the following formulas (Table 4.12).
Table 4.12 Economic limit calculation.
Source: From Mian (2011).
| Economic limits | Description |
| Economic limit for oil |  |
| Economic limit for gas | 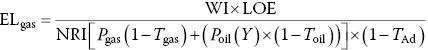 |
| Abbreviations | Definition |
| ELoil | The economic limit of an oil well in oil barrels per month (bbls month−1) |
| ELgas | The economic limit of a gas well in thousand standard cubic feet per month (MSCF month−1) |
| Poil | The current price of oil in dollars per barrel |
| Pgas | The current price of gas in dollars per MSCF |
| GOR | The gas/oil ratio as bbls/MSCF |
| LOE | The lease operating expenses in dollars per well per month |
| NRI | The net revenue interest, as a fraction |
| TAd | Ad valorem; Latin for “according to value” – a property tax, related to the value of the resource removed, fraction |
| Tgas | The gas severance taxes, production taxes, and all other taxes, as a fraction |
| Toil | The oil severance taxes, production taxes, and all other taxes, as a fraction |
| WI | The working interest, as a fraction. The WI owners must pay a corresponding percentage of the cost of leasing, drilling, producing, and operating a well or producing unit. After royalties are paid, the working interest also entitles its owner to share in oil and gas production revenues with other working interest owners, based on the percentage of the working interest owned |
| Y | The condensate yield as barrel/million standard cubic feet |
4.13 Workshop #1: Gas Well Economic Limit
To determine the economic limit for a gas well without any oil or condensate production, use the gas well economic limit calculation (see Table 4.7 for abbreviations).
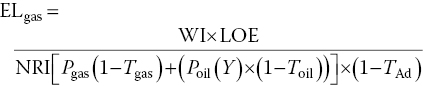
Assumptions:
| Poil | $50/bbl |
| Pgas | $3.00/MScf |
| GOR | 25 000 Scf/Std. barrel |
| LOE | $2000/month |
| NRI | 87.5% |
| TAd | 12.5% |
| Tgas | 5% |
| Toil | 5% |
| Y | 0% (effectively, no oil or condensate) |

The economic limit is calculated at 1997.8 SMcf gas production per month. This is the breakeven cost to operate the gas well. If gas production drops below this economic limit, the well will not generate enough cash flow or revenue to offset the operating costs of $2000 per month. Should the price of natural gas rise to $5 per SMcf, the economics change dramatically.
4.14 Workshop #2: Oil Well Economics
For a tight oil well, use the oil well economic limit calculation (see Table 4.7 for abbreviations).

Assumptions:
| Poil | $50/bbl |
| Pgas | $3.00/MScf |
| GOR | 600 Scf/Std. barrel |
| LOE | $1000/month |
| NRI | 87.5% |
| TAd | 12.5% |
| Tgas | 5% |
| Toil | 5% |

The economic limit is calculated at just under 27 barrels of crude oil and gas production per month for an operator to break even. If oil production drops below this economic limit, the oil well will not generate enough cash flow to offset the $1000 per month operating costs. Should the price of crude oil rise to $80 per barrel of oil, the economics are very different.
When the economic limit and associated monthly costs are raised, the life of the well is shortened. Proven oil or gas reserves are lost in the location once the well is permanently plugged. Conversely, when the economic limit is lowered by higher oil and gas prices, the life of the well is lengthened. At the economic limit there may be still a significant amount of unrecoverable oil left in the oil or gas reservoir. Some operators defer physical abandonment and prefer to idle wells for an extended period of time, hoping that the oil or gas price will go up or that new supplemental recovery techniques will be perfected. Depending on the jurisdiction, wells can be shut in for an extended time pending a recovery in oil and gas prices. However, lease provisions and governmental regulations may require quick abandonment. Economic and environmental liability and tax issues also may favor abandonment. In theory, an abandoned oil or gas well can be reentered and restored to production or converted to an injection service well for supplemental recovery of oil or gas or for downhole hydrocarbons storage. In practice, reentry and revitalization of an abandoned oil or gas well often is difficult mechanically and not cost effective.
4.15 Well Destruction
When the economic limit of a producing oil or gas well is ultimately reached, the well or field becomes an environmental and economic liability. Based on many regulatory requirements, the wells or field are to be properly plugged and decommissioned. Oil and gas well destruction procedures are designed for personal safety and aquifer protection:
- Prevent physical hazards around the former well components.
- Prevent surface or shallow contaminants from entering the abandoned well.
- Prevent intermixing of contaminants with potential aquifers.
In the oil and gas well destruction process, the production tubing is removed from the well, and sections of wellbore are filled with a grout or sealant such as cement to isolate the flow pathway between the oil and gas and the water zones from each other, as well as the surface. Various aquifers or water zones may have beneficial use as current or future water resources. Beneficial use can be ruled out because the water will not meet regulatory water standards. The natural geochemistry of the aquifers may exceed some regulatory standards for a water resource. Exceedances could occur due to high TDS, high concentrations of heavy metals, high salinity, excessive acidic or alkaline properties, or other geochemical parameters that are not acceptable for potable or irrigation water use. In places where water demand exceeds supply, point‐of‐use treatments may be used to take a marginal quality water resource to meet regulatory water quality requirements. Due to the need for protecting water resources, proper destruction of the oil and gas wells requires complete sealing to prevent surface and subsurface contaminants, especially from oil and gas well drilling and producing operations from infiltrating into the well casing or into the annulus of the borehole and impacting current or future water supplies.
Completely filling the entire oil or gas production casing and uncemented borehole zones with a grouting material such as neat cement is costly and usually unnecessary for proper well destruction. A mechanical plug or a brush and stone plug and a neat cement plug of at least 25 ft (7.6 m) from the surface of the well is sometimes used as the sealing method. Cement sealants used for well destruction projects usually consist of neat cement that is composed of either Portland cement types I, II, or III or high‐alumina cement mixed with not more than 6 gal of potable water per sack of cement (94 pounds per sack). The other cement sealant variations include neat cement with up to 5% bentonite clay added, by dry weight of the bentonite. The bentonite is added to improve the flow qualities and compensate for sealant shrinkage. Certain zones may be sealed off using perforation equipment to squeeze the grouting materials under high pressure into the producing formations or to isolate aquifer zones. After the grouting process has been completed, the surface features and equipment around the oil or gas wellhead are then usually excavated, and the wellhead and casing are cut off in the subgrade. A permanent steel cap is welded in place on top of the former oil and gas well, and then the entire remnants of the properly destroyed wells are buried to prevent water or contaminant infiltration into the subsurface. Proper documentation by an environmental professional should include field notes, photographs of the activities, decommissioning notifications, well destruction permits, and waste manifests identifying any hazardous materials that were transported and disposed of after the well destruction procedures occurred.
Onshore, wells have been permanently plugged with cement to prevent any flow of subterranean fluids into the wellbore, thereby protecting groundwater resources. Well destruction commonly involves the redrilling of the well to the known production depth and then injecting cement in the wellbore to a level ~100 ft below ground surface. The well is then pinched closed, and additional cement is pumped down the wellbore. Venting may be required to avoid methane accumulation. Other structures such as wastewater handling pits are closed, and storage tanks, wellheads, processing equipment, and pumping jacks are removed. Improperly decommissioned oil and/or gas wells can be assessed through review of historic records, monitoring for certain gases such as methane, conducting a geophysical survey for the subsurface presence of metal, or excavation of an exploration pit. Such pits are typically 10 ft2 (3 m) by 10 ft (3 m) deep and centered on the suspected well location. Once excavated, and no visible signs of the well are evident (i.e. casing, cellar boards, etc.), a magnetometer is used to scan the pit for signs of metal. Once the casing is located, the well is then redrilled, beginning inside the remaining casing and extending to the total known production depth. Once the wellbore has been reopened, the well is destroyed using a cement grout that is pumped into the wellbore to a level ~100 ft (30.5 m) below ground surface. The well is then squeezed off of pinched closed, and additional cement is pumped down the wellbore. Adequate venting is required during well destruction to avoid methane accumulation. Once properly destroyed, building permits can be obtained although sign‐off from the lead regulatory agency may also be required.
4.15.1 Site Restoration
After production has occurred, site restoration following oil and gas exploration and production activities is regulated. Site restoration may include removal of all surface and shallow oil and gas equipment, as well as a plan for replanting and site restoration. Revegetation and land reclamation should include long‐term soil stabilization and erosion control. Local native plants that are diverse and robust should be used in the site restoration plan. The vegetation should be capable of self‐regeneration. A general drilling inspection checklist (see Table 4.14, Appendix I) provides highlights of the process. A checklist of various plans commonly developed for drilling operations may be required by local, state, or federal agencies (see Table 4.15, Appendix I). The prospect evaluation and hazard assessment checklist (see Table 4.16, Appendix I) shows a variety of special resource identification issues and special considerations. More detailed inspection forms are included in the specific chapters on environmental impacts. A simplified flow chart shows the seven phases of the exploration–production life cycle (Figure 4.39) described in this chapter.
4.16 Summary
Drilling and producing from unconventional oil and gas resources is an industrial process occurring over large areas of the United States and throughout the world. Although unconventional oil and gas production is primarily a rural and suburban industrial activity, in the future urban settings will be the site of unconventional oil and gas production. Tight oil and shale gas formations are produced using hydraulic fracture stimulation techniques consisting of high‐volume, high‐pressure injection of a fluid mixture of mostly water combined with proppants and a minute volume of specialized petroleum recovery chemicals designed to optimize oil and gas recovery from horizontal drain holes. The drilling component of unconventional production is the mud rotary drilling rig, which has been used in oil and gas drilling operations for over a century. Drilling and production sites involve and contain a variety of industrial processes and hazardous materials that, if not properly managed, could create environmental degradation and safety risks. The high‐pressure rock fracturing technique has significantly added to the oil and gas production so that the United States has become the leading global producer of oil and gas. Still, health and safety protection and environmental concerns remain a significant national and international issue, and the controversy about political aspects of hydraulic fracturing continues. Addressing environmental protection, best management practices, and mitigation efforts related to hydrocarbon extraction from unconventional oil and gas resources, and tight oil and shale gas formations in particular, is critical and is discussed in detail in Chapter 5.
4.17 Exercises
- 4.1 What is the difference between biogenic gas and thermogenic gas?
- 4.2 What is the difference between conventional and unconventional reservoirs and the exploration approach?
- 4.3 Name five functions that the drilling circulation system provides to the drilling operations.
- 4.4 What is the purpose of the blowout preventer on a drill rig?
- 4.5 What does the surface casing protect, and what types of fluids does it isolate?
- 4.6 Explain the difference between low‐volume hydraulic fracturing and high‐volume hydraulic fracturing.
- 4.7 When did low‐volume hydraulic fracturing of conventional reservoirs begin?
a) 1920s b) 1950s c) 1980s d) 2000s
- 4.8 Using the oil economic limit equation, calculate the breakeven production in barrels of oil per month based on the following economics:
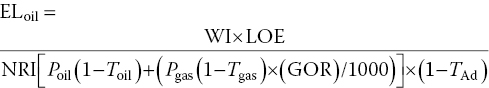
Poil $80/bbl Pgas $4.00/MScf GOR 400 Scf/Std. barrel LOE $1500/month NRI 90.0% TAd 12.5% Tgas 2.5% Toil 2.5% - 4.9 What is the difference between flowback fluids and coproduced water?
- 4.10 Name three important functions of proper well abandonment procedures.
References
- Abdalla, C. and Drohan, J. (2010). Marcellus Education Fact Sheet: Water Withdrawals for Development of Marcellus Shale Gas in Pennsylvania. University Park: Penn State Cooperative Extension.
- Al‐Mjeni, R., Arora, S., Cherukupalli, P. et al. (2011). Has time come for EOR? Oilfield Review 22 (4): 16–20.
- Anderson, F.J. (2011). Potential Use of North Dakota Sand and Clay for Natural and Manufactured Proppants, North Dakota Geological Survey, Jan., 4 p. https://www.dmr.nd.gov/ndgs/documents/newsletter/jan.2011/Jan2011Proppants.pdf (accessed 20 October 2018).
- Arthur, J.D., Bohm, B., Coughlin, B.J., and Layne, M. (2008). Hydraulic fracturing considerations for natural gas wells of the Marcellus shale. Presented at the Groundwater Protection Council (GWPC) Annual Forum in Cincinnati, OH (September).
- Baker, R. (1979). A Primer of Oilwell Drilling, Fourth Edition, Petroleum Extension Service. Austin, TX: The University of Texas; 94 p.
- Bateman, R. and Alzahabi, A. (2016). Use of well logging measurements and analysis for fracture design. In: Fracturing Horizontal Wells (ed. M.Y.Soliman and R.Dusterhoft), 379–398. New York: McGraw‐Hill Education.
- Berg, R.R. (1986). Reservoir sandstones. Englewood Cliffs, NJ: Prentice‐Hall, 480 p.
- Bureau of Land Management (BLM) (2014). Appendix P, Oil and Gas Operations, Colorado River Valley Field Office, Proposed RMP/Final EIS, February, 15 p.
- Cook, T.A. (2013). Procedure for calculating estimated ultimate recoveries of Bakken and Three Forks Formations horizontal wells in the Williston Basin, U.S. Geological Survey Open‐File Report 2013–1109. Reston, VA: U.S. Department of the Interior, U.S. Geological Survey, 14 p. http://pubs.usgs.gov/of/2013/1109 accessed 20 October 2018.
- Davies, R.J., Mathias, S.A., Moss, J. et al. (2012). Hydraulic fractures: how far can they go?Marine and Petroleum Geology 37: 1–6.
- Dean, L. (2008). Reservoir Engineering for Geologists, Article 3: Volumetric Estimation, 11–14. Calgary, AB: Canadian Society of Petroleum Geologists (CSPG).
- Elder, C.H. and Deul, M. (1974). Degasification of the Mary Lee coalbed near Oak Grove, Jefferson County, Alabama, by vertical borehole in advance of mining, U.S. Bureau of Mines Report of Investigations, vol. 7968. Pittsburgh, PA: U.S. Department of the Interior, Bureau of Mines, 21 p.
- Ely, J.W. (ed.) (1985). Secondary recovery of oil, oil wells, hydraulic fracturing. In: Stimulation Engineering Handbook, ix, 357 p. Houston, TX: PennWell Books.
- Energy & Environmental Research Center (EERC) (2016) A Review of Bakken Water Management Practices and Potential Outlook. Final Report, University of North Dakota, 2016‐EERC‐03‐11, March, 50 p.
- Fisher, M. and Warpinski, N. (2012). Hydraulic fracture height growth: real data. Society of Petroleum Engineers Production and Operations 27: 8–19.
- Glazer, Y.R., Lee, J.J., Davidson, F.T., and Webber, M.E. (2017). Shale boom could fuel batteries. Earth Magazine, American Geological Institute, Washington, DC (April), 15 p.
- Groundwater Protection Council (2009). Modern Shale Gas Development in the United States: A Primer. Washington, DC: U.S. Department of Energy, Office of Fossil Energy.
- Holden, T., Pendrel, J., Jenson, F., and Mesdag, P. (2013). Rock Properties for Success in Shales, CGG Internal White Paper #3035, January, 11 p. Houston, TX: CGG, GeoSoftware.
- Jacob, H. (1989). Classification, structure, genesis, and practical important of natural solid bitumen (“migrabitumen”). International Journal of Coal Geology 11 (1): 65–79.
- Kansas Geological Survey (KGS) (2001). Some Fundamentals of Geophysical Exploration, pp. 10–15. http://www.kgs.ku.edu/Publications/Oil/primer10.html (accessed 20 October 2018).
- Kansas Geological Survey (KGS) (2017). Geological Log Analysis, Kerogen. Placed on website 24 March 2017; Retrieved 22 June 2018; http://www.kgs.ku.edu/Publications/Bulletins/LA/10_mudstones.html.
- Keys, W.S. (1990). Borehole Geophysics Applied to Ground‐Water Investigations, U.S. Geological Survey Techniques of Water‐Resources Investigations, book. 2, chap. E2. Washington, DC: U.S. Department of the Interior, U.S. Geological Survey, 150 p.
- King, G.E. (2009). Perforating Basics, How the Perforating Processes Work, 14 March 2009; GEK Engineering.
- Lapham, W.W., Wilde, F.D., and Koterba, M.T. (1995). Ground‐Water Data‐Collection Protocols and Procedures for the National Water‐Quality Assessment Program: Selection, Installation, and Documentation of Wells, and Collection of Related Data, U.S. Geological Survey Open‐File Report, vol. 95‐398. Reston, VA: U.S. Department of the Interior, U.S. Geological Survey, 79 p.
- Lapham, W.W., Wilde, F.D., and Koterba, M.T. (1997). Guidelines and Standard Procedures for Studies of Ground‐Water Quality: Selection and Installation of Wells, and Supporting Documentation, U.S. Geological Survey Water Resources Investigation Report 96‐4233, Reston, VA, USA, 119 p. https://www.nrc.gov/docs/ML1423/ML14237A642.pdf (accessed 20 October 2018).
- Law, B.E. and Curtis, J.B. (2002). Introduction to unconventional petroleum systems. AAPG Bulletin 86: 1851–1852.
- Law, B.E. and Spencer, C.W. (1993). Gas in tight reservoirs‐an emerging major source of energy. In: The Future of Energy Gases, US Geological Survey, Professional Paper, vol. 1570 (ed. D.G.Howell), 233–252. Washington, DC: USGS; US Government Printing Office.
- Lehr, J.H. and Keeley, J. (eds.) (2016). Alternative Energy and Shale Gas Encyclopedia. Hoboken, NJ: Wiley, 912 p.
- Levine, J.R. (1993). Coalification: the evolution of coal as a source rock and reservoir rock for oil and gas. In: Hydrocarbons from Coal, Studies in Geology #38 (ed. B.E.Law and D.M.Rice), 39–77. Tulsa, OK: AAPG.
- Magoon, L.B. and Dow, W.G. (1994). The Petroleum System‐From Source to Trap, AAPG Memoirs. Tulsa, OK: American Association of Petroleum Geologists, 644 p.
- McEwen, M. (2015). Significant San Andres play emerging amid ROZ fairways. Midland Reporter‐Telegram (20 June), 4 p.
- Melzer, L.S. (2006). Stranded Oil in the Residual Oil Zone, Prepared for Advanced Resources International and the U.S. Department of Energy, Office of Fossil Energy, Office of Oil and Gas, February, 35 p.
- Mian, M.A. (2011). Project Economics and Decision Analysis, 2e. Tulsa, OK: Pennwell Books, p. 482.
- Neff, J.M., McKelvie, S., and Ayers, R.C., Jr. (2000). Environmental impacts of synthetic based drilling fluids. Report prepared for MMS by Robert Ayers & Associates, Inc. August 2000. U.S. Department of the Interior, Minerals Management Service, Gulf of Mexico OCS Region, New Orleans, Louisiana, USA. OCS Study MMS 2000‐064. 118 pp. https://www.boem.gov/ESPIS/3/3175.pdf (accessed 20 October 2018).
- OSHA (2014). Hydraulic Fracturing and Flowback Hazards Other than Respirable Silica, OSHA 3763012 2014. OSHA, Washington, DC, 27 p. https://www.osha.gov/Publications/OSHA3763.pdf: U.S. Department of Labor accessed 25 October 2018.
- OSHA (2018). Oil and Gas Well Drilling and Servicing eTool. https://www.osha.gov/SLTC/etools/oilandgas (accessed 20 October 2018).
- Patchen, D.G. and Carter, K.M. (eds.) (2015). A geologic play book for Utica Shale Appalachian basin exploration. Final report of the Utica Shale Appalachian basin exploration consortium, 187 p. http://www.wvgs.wvnet.edu/utica (accessed 11 October 2017).
- Penn State Extension (PSE) (2011). Marcellus Shale Wastewater Issues in Pennsylvania—Current and Emerging Treatment and Disposal Technologies, Penn State University College of Agricultural Sciences.
- Pollastro, R.M., Roberts, L.N.R., and Cook, T.A. (2013). Geologic assessment of technically recoverable oil in the Devonian and Mississippian Bakken Formation, chap. 5 of U.S. Geological Survey Williston Basin Province Assessment Team, Assessment of undiscovered oil and gas resources of the Williston Basin Province of North Dakota, Montana, and South Dakota, 2010 (ver. 1.1, November 2013): U.S. Geological Survey Digital Data Series DDS–69–W, 34 p.
- Rice, D.D. (1993). Composition and origins of coalbed gas. In: Hydrocarbons from Coal, AAPG Studies in Geology, vol. 38 (ed. B.E.Law and D.D.Rice), 159–184. Tulsa, OK: The American Association of Petroleum Geologists.
- Rogers, D., Fout, G., and Piper, W.A. (2006). New innovative process allows drilling without pits in New Mexico. The 13th International Petroleum Environmental Conference, San Antonio, TX (17–20 October).
- Rogers, D., Smith, D., Fout, G., and Marchbanks, W. (2006). Closed‐loop drilling system: a viable alternative to reserve waste pits. World Oil 227 (12).
- Sharif, A. (2007). Tight gas resources in Western Australia, Western Australia Department of Mines and Petroleum, September, as quoted in Wikipedia.org, Tight Gas; Retrieved 11 October 2017.
- Tissut, B. P., and Welte, D.H.,(1984). Petroleum Formation and Occurence, Second edition, Springer‐Verlag, Berlin, 699 p.
- US Geological Survey (USGS) (2013). Petroleum Resource Assessment of the Bakken and Three Forks Formations, Williston Basin Province, Montana, North Dakota, and South Dakota.
- US Department of Energy (US DOE) (2007). Development of Radar Navigation and Radio Data Transmission for Microhole Coiled Tubing Bottomhole Assemblies. Washington, DC: United States Department of Energy; DE‐FC26‐03NT15477.
- US Department of Energy (US DOE) (2009). Modern Shale Gas Development in the United States: A Primer. Washington, DC: US DOE, Office of Fossil Energy, National Energy Technology Laboratory, 100 p.
- US Department of Energy (US DOE) (2013a). Modern Shale Gas Development in the United States: A Primer. Washington, DC: US DOE, Office of Fossil Energy, National Energy Technology Laboratory, September, Modern Shale Gas Development in the United States: An Update; 79 p.
- US Department of Energy (US DOE) (2013b). National Energy Technology Laboratory, E&P Focus, Fall, Oil & Natural Gas Program Newsletter, 16 p.
- US Department of Energy (US DOE) (2014). Enhanced Oil Recovery. https://www.energy.gov/fe/science‐innovation/oil‐gas‐research/enhanced‐oil‐recovery (accessed 20 October 2018).
- US Energy Information Administration (US EIA) (2013). EIA/ARI World Shale Gas and Shale Oil Resource Assessment Technically Recoverable Shale Gas and Shale Oil Resources: An Assessment of 137 Shale. Prepared for US EIA and US Department of Energy, Prepared by Advanced Resources International, Inc., 707 p.
- US Energy Information Administration (US EIA) (2017). Utica Shale Play, Geology Review, April, 18 p.
- US Environmental Protection Agency (US EPA) (2004a). Evaluation of Impacts to Underground Sources of Drinking Water by Hydraulic Fracturing of Coalbed Methane Reservoirs, June, Chapter 4, Hydraulic Fracturing Fluids, EPA 816‐R‐04‐003. Washington, DC: U.S. Environmental Protection Agency, 26 p.
- US Environmental Protection Agency (US EPA) (2004b). Evaluation of Impacts to Underground Sources June 2004 of Drinking Water by Hydraulic Fracturing of Coalbed Methane Reservoirs, Final June, EPA 816‐R‐04‐003. Washington, DC: US EPA, 463 p.
- US Environmental Protection Agency (US EPA) (2015a). Analysis of Hydraulic Fracturing Fluid Data from the FracFocus Chemical Disclosure Registry 1.0 [EPA Report]. (EPA/601/R‐14/003). Washington, DC: Office of Research and Development, U.S. Environmental Protection Agency.
- US Environmental Protection Agency (US EPA) (2015b). Assessment of the Potential Impacts of Hydraulic Fracturing for Oil and Gas on Drinking Water Resources [EPA Report]. (EPA/600/R‐15/047). Washington, DC: Office of Research and Development, U.S. Environmental Protection Agency. June, 599 p.
- US Environmental Protection Agency (US EPA) (2015c). Review of Well Operator Files for Hydraulically Fractured Oil and Gas Production Wells: Well Design and Construction [EPA Report]. (EPA/601/R‐14/002). Washington, DC: U.S. Environmental Protection Agency, Office of Research and Development.
- US Environmental Protection Agency (US EPA) (2015d). Case Study Analysis of the Impacts of Water Acquisition for Hydraulic Fracturing on Local Water Availability, EPA/600/R‐14/179, May 2015. Washington, DC: U.S. Environmental Protection Agency 215 p. www.epa.gov/fhstudy.
- US Environmental Protection Agency (US EPA) (2016a). Hydraulic Fracturing for Oil and Gas: Impacts from the Hydraulic Fracturing Water Cycle on Drinking Water Resources in the United States. Washington, DC: Office of Research and Development, EPA‐600‐R‐16‐236Fa, December, 666 p.
- US Environmental Protection Agency (US EPA) (2016b). Executive Summary ‐ Hydraulic Fracturing for Oil and Gas: Impacts from the Hydraulic Fracturing Water Cycle on Drinking Water Resources in the United States. Office of Research and Development, Washington, DC, EPA‐600‐R‐16‐236ES, Executive Summary, December, 50 p. https://www.epa.gov/sites/production/files/2016‐12/documents/hfdwa_executive_summary.pdf (accessed 20 October 2018).
- USGS (1999). Naturally Occurring Radioactive Materials (NORM) in Produced Water and Oil‐Field Equipment: An Issue for the Energy Industry, U.S. Department of the Interior, U.S. Geological Survey; USGS Fact Sheet FS–142–99. Denver, CO: U.S. Geological Survey.
- Vance, D. (2011). Residual Oil Zones, A Tale of CO2 Opportunities, American Association of Petroleum Geologists, AAPG Explorer, 3 p.
- Vance, D., Trentham, B., and Meltzer, S. (2011). Report on the Potential of Residual Oil Zones in the San Andres, 2011 CO2 Conference, presentation, 50 p.
- Vengosh, A., Warner, N., Osborn, S., and Jackson, R. (2011). Elucidating Water Contamination by Fracturing Waters from Gas Wells: Integrating Isotopic and Geochemical Tracers, US EPA Workshop; Hydraulic Fracturing Workshop 1 – 28 pp. https://www.epa.gov/hfstudy/elucidating‐water‐contamination‐fracturing‐fluids‐and‐formation‐waters‐gas‐wells‐integrating (accessed 20 October 2018).
- Warpinski, N. (2009). Microseismic Monitoring: Inside and Out. Society of Petroleum Engineers, Richardson, Texas, USA, SPE‐118537‐JPT. Journal of Petroleum Technology 61 (11): 6 p.
- Warpinski, N., Du, J., and Zimmer, U. (2012). Measurements of hydraulic‐fracture‐induced seismicity in gas shales. SPE Production and Operations 27 (3): 240–252.
- World Nuclear Association (2018). Naturally‐Occurring Radioactive Materials (NORM), May, 10 p. http://www.world‐nuclear.org/information‐library/safety‐and‐security/radiation‐and‐health/naturally‐occurring‐radioactive‐materials‐norm.aspx (accessed 20 October 2018).
- Zou, C., Zhu, R., Tao, S. et al. (2013). Unconventional Petroleum Geology. Waltham, MA: Elsevier, 373 p.
Suggested Reading
- Abdalla, C. and Drohan, J. (2009). Water withdrawals for development of Marcellus shale gas in Pennsylvania. University Park, PA: Penn State Extension, Penn State Extension., College of Agricultural Sciences.
- Abdallah, W., Buckley, J.S., Carnegie, A. et al. (2007). Fundamentals of Wettability. Schlumberger Oilfield Review 19 (2): 44–61.
- Advanced Resources International (2001). Federal lands analysis natural gas assessment, southern Wyoming and northwestern Colorado, Study Methodology and Results, DOE web site, May, 94 p. http://www.oilandgasbmps.org/docs/GEN35‐FederalLandsAnalysisNaturalGasAssessment.pdf (accessed 20 October 2018).
- Arthur, J.D., Bohm, B., Coughlin, B.J., and Layne, M. (2009). Evaluating implications of hydraulic fracturing in shale gas reservoirs. SPE‐121038. Proceedings of the 2009 SPE Americas Environmental and Safety Conference, San Antonio, TX (23–25 March 2009). Richardson, TX: Society of Petroleum Engineers.
- Bureau of Land Management (BLM) (1983). Onshore oil and gas order no. 1, Approval of operations on onshore Federal and Indian oil and gas lease. Final Rule: Federal Register/Vol. 48, no. 205, Friday, 21 October 1983.
- Cenegy, L.M., McAfee, C.A., and Kalfayan, L.J. (2011). Field study of the physical and chemical factors affecting downhole scale deposition in the North Dakota Bakken Formation, SPE‐140977‐MS, 2011. SPE International Symposium on Oilfield Chemistry, The Woodlands, TX (11–13 April 2011).
- Crafton, J.W. (1998). Well evaluation using early time post‐stimulation flowback data. Presented at the 1998 SPE Annual Technical Conference and Exhibition held in New Orleans, LA (27–30 September 1998), Society of Petroleum Engineers, SPE# 49223; pp. 599–607.
- Cramer, D.D. (2008). Stimulating unconventional reservoirs: lessons learned, successful practices, areas for improvement. SPE Unconventional Reservoirs Conference, Keystone, CO. SPE‐114172, 218–236. Red Hook, NY: Curran Publishing Services.
- Department of Oil and Gas and Geophysical Resources (DOGGR) (2014). Oil and Gas Monitoring Program (SB4 Environmental Impact Report). Sacramento, CA: California Department of Conservationhttp://www.conservation.ca.gov/dog/Pages/SB4_Final_EIR_TOC.aspx (accessed 20 October 2018.
- Energy and Environmental Research Council (EERC) (2014). Completion Technologies, Bakken Decision Support System. University of North Dakota; 3 p.
- Eshleman, K.N. and Elmore, A. (2013). Recommended Best Management Practices for Marcellus Shale Gas Development in Maryland. Submitted to Maryland Department of the Environment, Baltimore, MD (13 February), p. 172.
- Hayes, T. and Severin, B.F. (2012). Final Report to RPSEA; Barnett and Appalachian Shale Water Management and Reuse Technologies. Report No. 08122‐05. FINAL.1; Contract 0812205, 30 March, 125 p.
- Iverson, W.P. (1995). Closure stress calculations in anisotropic formations. SPE 29598‐MS. Low Permeability Reservoirs Symposium, Denver, CO (19–22 March 1995), 14 p. Richardson, TX: Society of Petroleum Engineers.
- Joshi, S. (2007). Horizontal and Multilateral Well Technology, Petroleum Engineering‐Upstream, Encyclopedia of Life Support Systems (EOLSS), 9 p. https://www.eolss.net/sample‐chapters/c08/e6‐193‐12.pdf (accessed 20 October 2018).
- King, G.E. (2010). Thirty years of gas shale fracturing: what have we learned? SPE 133456. Presented at the 2010 SPE Annual Technical Meeting and Exhibition, Florence, Italy, 23–25 September, 39 p.
- King, G.E. (2012). Hydraulic fracturing 101: what every representative, environmentalist, regulator, reporter, investor, university researcher, neighbor and engineer should know about estimating frac risk and improving frac performance in unconventional oil and gas wells, SPE 152596. SPE Hydraulic Fracturing Technology Conference, The Woodlands, TX (6–8 February), 80 p.
- LeFever, J.A. (2005). North Dakota Middle Member Bakken Horizontal Play, Geologic Investigation, vol. 8. Bismarck, ND: North Dakota Geological Survey, 1 p.
- LeFever, J.A., Martiniuk, C.D., Dancsok, E.F.R., and Mahnic, P.A. (1991). Petroleum potential of the middle member, Bakken Formation, Williston Basin. In: Proceedings of the Sixth International Williston Basin Symposium, Saskatchewan Geological Society, Special Publication, vol. 11 (ed. J.E.Christopher and F.Haidl), 76–94. Regina, VA: Saskatchewan Geological Society.
- Leverson, A. (1967). Geology of Petroleum, 2e. San Francisco, CA: W.H. Freeman, 724 p.
- Nordquist, J.W. (1953). Mississippian stratigraphy of northern Montana, 4th Annual Field Conference Guidebook, 68–82. Billings, MT: Geological Society.
- Pitman, J.K., Price, L.C., and LeFever, J.A. (2001). Diagenesis, Fracture Development in the Bakken Fm., Williston Basin: Reservoir Quality in the Middle Member, U.S. Geological Survey Professional Paper, vol. 1653, 24 p. Denver, CO: U.S. Department of the Interior, U.S. Geological Surveyhttps://pubs.usgs.gov/pp/p1653/p1653.pdf (accessed 20 October 2018.
- Powell, R.J., McCabe, M.A., Slabaugh, B.F. et al. (1999). Applications of a New, Efficient Hydraulic Fracturing System. SPE Production & Facilities 14 (2): 131–138.
- Railroad Commission of Texas (RRC) (2014). Hydraulic Fracturing Frequently Asked Questions, 7 p.
- US Bureau of Land Management (BLM) (2014). Colorado River Valley Field Office – Proposed RMP/Final EIS, February, 15 p.
- US Department of Energy (US DOE) (1993). Drilling Sideways: A Review of Horizontal Well Technology and Its Domestic Application, DOE/EIA‐TR‐0565; Distribution Category UC‐950. Washington, DC: Energy Information Administration, Office of Oil and Gas, U.S. Department of Energy, 30 p.
- US Energy Information Administration (US EIA) (1993). Drilling Sideways: A Review of Horizontal Well Technology and Its Domestic Application, DOE/EIA‐TR‐0565 Distribution Category UC‐950. Washington, DC: Energy Information Administration, Office of Oil and Gas, U.S. Department of Energy, 30 p.
- US Energy Information Administration (US EIA) (2011). The Geology of Natural Gas Resources, 14 February, Today in Energy.
- US Energy Information Administration (US EIA) (2015). U.S. remained world's largest producer of petroleum and natural gas in 2014, 7 April 2015.
- US Environmental Protection Agency (US EPA) (1982). Assessment of Environmental Fate and Effects of Discharges from Offshore Oil and Gas Operators, WH‐553. Washington, DC: US Environmental Protection Agency, 451 p.
- US Environmental Protection Agency (US EPA) (1985). Modeling Remedial Actions at Uncontrolled Hazardous Waste Sites, EPA/540–2‐85/001. Washington, DC: US Environmental Protection Agency.
- US Environmental Protection Agency (US EPA) (1988). Corrective Action: Technologies and Applications. Cincinnati, OH: Office of Research and Development, Center for Environmental Research Information, 19–20 April 1988, Atlanta, GA.
- US Environmental Protection Agency (US EPA) (1991a). Seminar on RCRA Corrective Action Stabilization Technologies, Technology Transfer. Washington, DC: Center for Environmental Research Information.
- US Environmental Protection Agency (US EPA) (1991b). Stabilization Technologies for RCRA Corrective Actions Handbook, Office of Research and Development, EPA/625/6–91/026. Washington, DC: Center for Environmental Research Information.
- US Environmental Protection Agency (US EPA) (1995). Crude Oil and Natural Gas Exploration and Production Wastes: Exemption from RCRA Subtitle C Regulation. Washington, DC: U.S. Environmental Protection Agency, Office of Solid Waste; EPA530‐K‐95‐003, 30 p.
- US Environmental Protection Agency (US EPA) (2013a). Naturally‐Occurring Radiation: Overview, Updated: 28 February 2013.
- US Environmental Protection Agency (US EPA) (2013b). Class II Wells: Oil and Gas Related Injection Wells (Class II).
- Veil, J.A., Daly, J.M., and Johnson, N. (2000). DOE helps the EPA expedite offshore regulations for synthetic‐based mud. USDOE's Oil and Gas Environmental Research Program 5 (1): 1–4.
- Warpinski, N.R. (1985). Measurement of width and pressure in propagating hydraulic fracture. Society of Petroleum Engineers Journal 25 (1): 46–54.
- Warpinski, N.R., Branagan, P.T., Peterson, R.E., and Wolhart, S.L. (1998). An interpretation of MSite hydraulic fracture diagnostic results. Paper SPE 39950 SPE Rocky Mountain Regional/Low Permeability Reservoirs Symposium, Denver, CO (5–8 April).
- Warpinski, N.R. and Smith, M.B. (1989). Rock mechanics and fracture geometry in recent advances in hydraulic fracturing. In: Recent Advances in Hydraulic Fracturing, SPE, Monograph, vol. 12 (ed. J.L.Gidley), 57–80. Richardson, TX: Henry L. Doherty Memorial Fund of AIME, Society of Petroleum Engineers.
- Warpinski, N.R. and Teufel, L.W. (1987). Influence of Geologic Discontinuities on Hydraulic Fracture Propagation. Journal of Petroleum Technology 39: 209–220.
- Warpinski, N.R. and Teufel, L.W. (1989). In Situ Stresses in Low‐Permeability, Nonmarine Rocks. Journal of Petroleum Technology 41: 405–414.
- Williams, J.H. (2014). The Marcellus Shale Gas Play, Geology, Development, and Water‐Resource Impact Mitigation. Troy, NY: USGS, New York Water Science Center.