5
Overview of Impacts from Tight Oil and Shale Gas Resource Development
5.1 Introduction
The scale of potential risks and impacts from drilling and extraction of tight oil and shale gas is unprecedented in many of the affected communities. This chapter describes the possible impacts and significance from drilling, hydraulic fracturing, and producing phases described in Chapter 4. It also lays the foundation and describes the overall impacts and mitigation measures associated with oil and gas production from horizontal drilling and high‐volume hydraulic fracture (HVHF) stimulation methods. A variety of concerns are associated with tight oil and shale gas exploration–production activities as presented in Table 5.1.
Table 5.1 Summary of general concerns associated with tight oil and shale gas resource development.
| Affected resource or issue | General concern | Chapters |
| Air resources | Exposure to noise, odors, volatile chemicals, silica dust from proppants, and construction dust. Greenhouse gases are the product of using fossil fuels | Chapter 8 |
| Cultural and paleontological resources | Collection, damage or vandalism of fossils, petroglyphs, historic artifacts, historic trails, and sacred places due to new access | Chapter 5 |
| Ecological resources | Species extinction, wildlife habitat fragmentation, introduction of invasive species, interference with breeding, and poaching due to new access | Chapter 11 |
| Soil and rock resources | Soil erosion related to land disturbance and spillage of chemicals, blasting at rock quarries to provide proppants, gravels, sands, and other materials for operations | Chapter 5 |
| Visual and auditory resources | Degradation in the quality of natural scenery, viewscapes, natural soundscapes, clear night skies, and impacts from industrial noise and light pollution | Chapter 5 |
| Water resources | Contamination and overuse of surface and groundwater resources | Chapter 6 |
| Issues | ||
| Environmental justice issues | Minorities or low‐income populations may be disproportionately affected | Chapter 5 |
| Health and safety issues | Worker injuries and accidents and resident exposure to dust, chemicals, accidents related to transportation, etc. | Chapter 9, Appendix D |
| Induced seismicity issues | Generation of small earth tremors related to injection of fluids during waste disposal operations and, to a lesser extent, during hydraulic fracture stimulation | Chapter 7 |
| Infrastructure issues | Damage to roads and bridges that may not be designed for increased heavy truck use. Schools, hospitals, police, fire, water supply, and treatment services may not be able to handle the influx of new workers. New roads may allow access to previously inaccessible areas for vandalism and poaching | Chapter 5 |
| Land use issues | Conflicts with current land use | Chapter 5 |
| Socioeconomic issues | Locals who are not able to participate in the economic boom may be socially excluded; tourism and recreation sector may decline | Chapter 5 |
An overview of some US university studies about unconventional resource issues is summarized in Appendix A.
5.1.1 Precautionary Principle
Certainly, caution should be taken on evaluating site‐specific risks and concerns. Adherents of the precautionary principle require that public policy should resist the introduction of a new product such as genetically modified organisms (GMO) or processes such as hydraulic fracturing whose ultimate impacts some say are disputed or unknown. In December 2014, Governor Andrew Cuomo of the State of New York, in a bold move to eliminate the potential negative (and positive) impacts of hydraulic fracturing, banned high‐volume fracturing for shale gas development. This political decision follows the precautionary principle and will affect the residents by shielding them from negative impacts of hydraulic fracturing such as potential environmental and health issues. The decision also limits job growth, royalty potential of land owners, and economic development. The potential impacts and risks of spills are described below.
5.2 Potential Impacts and Risks of Spills
Potential environmental impacts exist, and there are risks of fluid spills for all industrial activities involving toxic liquids and hazardous wastes. These impacts and risks also apply to certain unconventional oil and gas operations. However, through careful design and planning, worker training, regulatory oversight, and prudent management, these risks and concerns should be addressed.
5.3 Significance of Impacts
The scale of unconventional oil and gas production in the United States and eventually throughout the world is evident in the map view of the ~275 000 hydraulically fractured wells completed between 2010 and 2013 (Figure 5.1).
Figure 5.1 Locations of ~275 000 oil and gas wells that were drilled and hydraulically fractured between 2010 and 2013 (US EPA 2016b).
The phases of the exploration–production life cycle vary as to the exposure to environmental impacts for workers; the media of exposure (water, soil, soil vapor, air); the chemicals causing exposure such as fuels, lubricants, produced oil and gas, coproduced water, and hydraulic fracturing chemicals; and other factors. The handling of large volumes of fluids containing hazardous substances occurs primarily in phase 3 (drilling) through phase 6 (oil and gas production). These fluids include the drilling muds, the hydraulic fracture injection fluids with specialized chemicals, the flowback fluids, and the produced fluids. Due to the risks of significant impacts because of the large volume of fluids used, mitigation measures must be designed and implemented to reduce impacts. For fluid handling (phases 3–6), mitigation measures might include secondary containment, spill response training and equipment, regular worker training on proper fluid handling procedures, continuous inspection, and monitoring for leaks and spills, reducing the potential for large‐scale damage. The significance of the impact for the well site, for example, relates to the size of the area affected. Keeping operations in a minimum footprint keeps spills and leaks in a smaller area, which is easier to monitor and cleanup.
Each phase of the unconventional oil and gas extraction process have a site‐specific and community‐related level of impacts. The potential impacts of each proposed activity and the alternatives can be assessed using the impact significance classification system (CDOC 2015) as follows:
- Class I: Significant and Unavoidable Impact. Class I impacts are significant adverse environmental effects that cannot be mitigated to a level of ‘less than significant’ through the application of feasible mitigation measures.
- Class II: Less Than Significant Impact With Mitigation Incorporated. Class II impacts are significant adverse environmental effects that can be reduced to a level of ‘less than significant’ with the application of feasible mitigation measures.
- Class III: Less Than Significant Impact. Class III impacts are adverse environmental effects that have been determined to be comparatively minor in the sense that they do not meet or exceed the subject specific criteria established to gauge significance.
- Class IV: No Impact. Class IV impacts do not have any adverse or beneficial environmental effects.
- Class V: Beneficial Impact. Class V impacts result in favorable environmental effects.
5.4 Overview of the Five Main Resource Categories
Potential impacts of the five main resource categories depend on the project phase in the exploration–production life cycle (Table 5.2). Examples of possible direct and indirect impacting factors based on the exploration–production life cycle show that consistent inspections and monitoring of well site and local conditions (water, air, ecosystem, etc.) are required as well as worker training for proper procedures and health and safety issues to minimize impacts (Table 5.3). Not surprisingly, the scale of the impacts (Table 5.4) shows that in general, the well site area and local area are affected the most by the exploration–production activities:
- Air resources.
- Geological and soil resources.
- Ecological resources.
- Land use resources and socioeconomics.
- Water resources.
Table 5.2 Project phase and description of unconventional oil and gas production activities and possible significant impacts based on resource category.
| Project phase | 1. Prospect generation (geochemistry and geophysics) | 2. Planning (site preparation) | 3. Drilling | 4. Well completion and hydraulic fracture stimulation | 5. Fluid recovery and waste management | 6. Oil and gas production | 7. Well abandonment and site restoration | |
| Resources | Impact | |||||||
| Air resources | Degraded air quality: particulates | a | X | X | X | X | X | X |
| Greenhouse gases (GHG) | a | X | X | X | X | X | X | |
| Toxic compounds (VOCs) released to air | X | X | X | X | X | X | ||
| Geological and soil resources | Archeological sites | X | X | X | b | |||
| Borrow areas damage (raw materials) | X | X | X | |||||
| Disposal areas | X | X | X | X | X | |||
| Drainage | X | X | X | X | X | |||
| Landslides and earth movement | X | X | X | X | X | |||
| Paleontological sites | X | X | X | b | ||||
| Seismicity | X | |||||||
| Soil contamination | X | X | X | X | X | |||
| Ecological resources | Agricultural | X | b | |||||
| Aquatic and riparian areas | X | b | ||||||
| Ecosystems health | X | X | X | X | X | X | ||
| Grazing | X | X | X | X | X | X | ||
| Habitat destruction | X | X | b | |||||
| Habitat fragmentation | X | b | ||||||
| Invasive species | X | X | X | X | X | X | X | |
| Native vegetation | X | b | ||||||
| Vegetation damage | X | X | b | |||||
| Wildlife (harm to populations) | X | X | X | X | X | X | X | |
| Land use resources and socioeconomics | Community concerns | X | X | X | X | X | X | X |
| Cultural resource protection | X | X | X | b | ||||
| Environmental justice | X | X | X | X | X | X | X | |
| Historic resource protection | X | X | X | b | ||||
| Health and safety – community | X | X | X | X | X | X | ||
| Health and safety – workers | X | X | X | X | X | X | X | |
| Land disturbance | X | X | X | b | ||||
| Land use planning, oil and gas regulations, and environmental compliance and permitting | X | X | X | X | X | X | ||
| Light pollution | X | X | X | X | X | X | ||
| Noise | X | X | X | X | X | X | X | |
| Odor | X | X | X | X | X | X | ||
| Social challenges | X | X | X | X | X | X | ||
| Transportation and traffic | X | X | X | X | c | X | ||
| Visual aesthetics | X | X | X | X | X | X | ||
| Worker training and education | X | X | X | X | X | X | X | |
| Water resources | Freshwater wetlands spills | X | X | X | X | X | X | |
| Groundwater supplies | X | X | X | X | X | X | ||
| Groundwater pollution | X | X | X | X | X | X | ||
| Surface water supplies | X | X | X | X | X | X | ||
| Surface water pollution | X | X | X | X | X | X | ||
| Stormwater runoff | X | X | X | X | X | X | ||
Assumptions: Once activities occur, it is assumed that due to regulatory oversight and mitigation steps, additional or continued damage or impacts will be minimized.
a Exhaust from seismic equipment and work trucks for field inspections and minor impacts.
b After the initial damage has occurred, such as habitat fragmentation under site preparation (drill pad and access road construction), additional habitat destruction should not occur.
c During oil and gas production (phase 6), regular operations and maintenance trips will occur to the well, and inspections of storage tanks, pipelines, and other facilities will occur occasionally for health and safety reasons; however, the level of activity will generally be low.
GHG, greenhouse gases; VOCs, volatile organic compounds, such as benzene.
Table 5.3 Example of direct and indirect impacting factors for exploration–production life cycle.
| Phase and activity | Impacts | Direct impacting factors | Indirect impacting factors |
| Phase 1: Prospect generation Example activity: Geophysical survey Description: Crews of workers on vibrating trucks, with possible explosive charges, to collect seismic data |
|
|
|
| Phase 2: Planning Example activity: Site preparation Description: Construction crews building the drill pad, access roads, mud pits, etc. |
|
|
|
| Phase and activity | Example of possible impacts | Example of possible direct impacting factors | Example of possible indirect impacting factors |
| Phase 3: Drilling Example activity: Drilling Description: Drill borehole, install casing. Contain drilling fluids with closed‐loop system, tanks or lined mud pits |
|
|
|
| Phase 4: Well completion and hydraulic fracture stimulation Example activity: Hydraulic fracture stimulation Description: Numerous specialty contractors and suppliers inject water with minute amounts of proppant and specialized chemicals to prepare the reservoir of oil and gas production |
|
|
|
| Phase 5: Fluid recovery and waste management Example activity: Containing flowback fluids (tanks or pit) Description: Numerous specialty contractors on‐site |
|
|
|
| Phase 6: Oil and Gas Production Example activity: Production of oil and gas Description: Produce hydrocarbons and production water, monitor wells, pipelines, tanks and other facilities for spills and leaks, continue to train workers, workovers (acid) and cleaning of wells |
|
|
|
| Phase 7: Well abandonment and site restoration Example activity: Abandoning well and site restoration Description: Abandon well with drilling contractor, perform site restoration to prevent erosion, and restore ecosystem, if possible |
|
|
|
Table 5.4 Scale of impacts for each resource.
| Scale of impact | |||||
| Resources | Impact | Well site and mine sites scale | Local scale | Regional scale | Global scale |
| Air resources | Degraded air quality: Particulates | X | X | X | |
| Greenhouse gases (GHG) | X | X | X | X | |
| Toxic compounds (VOCs) released to air | X | X | X | ||
| Geological and soil resources | Archeological sites | X | |||
| Borrow areas damage (raw materials) | X | X | |||
| Disposal areas | X | X | X | ||
| Drainage | X | ||||
| Landslides and earth movement | X | ||||
| Paleontological sites | X | ||||
| Seismicity | X | X | |||
| Soil contamination | X | X | |||
| Ecological resources | Agricultural | X | X | ||
| Aquatic and riparian areas | X | X | |||
| Ecosystems health | X | X | |||
| Grazing | X | X | |||
| Habitat destruction | X | X | |||
| Habitat fragmentation | X | X | |||
| Invasive species | X | X | X | ||
| Native vegetation | X | X | |||
| Vegetation damage | X | X | |||
| Wildlife (harm to populations) | X | X | X | ||
| Land use resources and socioeconomics | Community concerns | X | |||
| Cultural resource protection | X | ||||
| Environmental justice | X | X | |||
| Historic resource protection | X | ||||
| Health and safety – community | X | X | |||
| Health and safety – workers | X | X | |||
| Land disturbance | X | X | |||
| Land use planning, oil and gas regulations, environmental compliance and permitting | X | X | X | ||
| Light pollution | X | X | |||
| Noise | X | X | |||
| Odor | X | ||||
| Social challenges | X | X | X | ||
| Transportation and traffic | X | X | |||
| Visual aesthetics | X | X | |||
| Worker training and education | X | X | X | ||
| Water resources | Freshwater wetlands spills | X | X | X | |
| Groundwater supplies | X | X | X | ||
| Groundwater pollution | X | X | X | ||
| Surface water supplies | X | X | X | ||
| Surface water pollution | X | X | X | ||
| Stormwater runoff | X | X | X | ||
5.4.1 Air Resources
Air resource impacts are directly related to air quality degradation; these impacts range from the introduction of equipment and vehicle exhaust of diesel fumes and particulate, to sulfur compounds such as hydrogen sulfide (H2S), fugitive emissions from methane (CH4) and other gases leaking from wells or pipelines, and volatile organic compounds (VOCs) spilled on the surface, which evaporate, to fine silica dust from the sand proppants. Air emissions are influenced by work practices, weather patterns, local topography, prevailing wind directions, and specific contaminant characteristics. Sophisticated air dispersion models can be used to predict air contaminants and the spatial patterns of air dispersion and deposition (TEEIC 2017).
Sites having air quality degradation issues may be located hundreds of miles away or more from the drill site. Dust and air pollution from vehicles and equipment from the borrow areas (off‐site sand and gravel pits) that produce the raw materials for the gravel pads, cements and concrete, and sand proppants may create local air quality issues. An example would be the proppant sands mined in Minnesota but shipped to Pennsylvania for Marcellus Shale gas production. Transportation sector exhausts from diesel trucks, ships, and trains can also impact areas from a regional to international scale. Greenhouse gases (GHG) from vehicle and equipment exhaust add to the growing atmospheric carbon buildup, as well as fugitive emissions of methane and light‐end hydrocarbons leaking from wells, valves, and pipelines. Combustion of the tight oil and shale gas also adds to global atmospheric carbon buildup.
5.4.2 Geological and Soil Resources
Geological and soil resources importantly include archeological and paleontological sites, drainage and erosion issues, landslides and earth movement, and soil contamination related to industrial activities. The area of influence related to geology and soil resources includes the well site and the borrow areas (off‐site sand and gravel pits). Even the fluid disposal sites, which can be hundreds of miles away or more, can be impacted by tight oil and shale gas exploration and production (E&P). Some fluid disposal sites in Oklahoma, for example, have been experiencing seismicity related to the waste injections from conventional and unconventional resource recovery (Ellsworth 2013).
5.4.3 Ecological Resources
Habitat destruction or fragmentation during construction of the well pad, access roads, and pipelines and unintended introduction of invasive species on boots and tires through air or water can damage ecological resources. Agricultural and grazing disruption can occur, and damage to native vegetation and wildlife populations are a concern near the well pad, pipelines, roadways and the built environment associated with the unconventional oil and gas extraction and production. Migratory species may be impacted. Barriers such as fences or walls can impede migration of certain species.
5.4.4 Land Use Resources and Socioeconomics
The category of land use resources includes a variety of impacts. Social issues such as environmental justice, health and safety for the community and workers, worker training, historic and cultural resource protection, and land use planning are difficult to address. Community concerns of rapid and uncontrolled change added to the social challenges of newly introduced or rapidly expanding industrial activities and an increased (or decreased in time of economic bust) workforce from outside the area create local friction. The nuisance factors such as noise, odor, light pollution, increased traffic, and degradation of visual aesthetics are annoying impacts that add up to reduce the quality of life, unless they are mitigated. The area of influence for this resource depends on the socioeconomic factors of the area, with urban areas having different issues than rural areas (TEEIC 2017). Land use resources and socioeconomics also include worker and community safety issues. The explosive nature of tight oil which is produced from the Bakken Formation has high volatility caused by a large proportion of dissolved light hydrocarbons methane, butane, and propane. Pipelines and railway cars engineered for safe conventional crude oil transport were not designed for the characteristics of highly volatile tight oil.
5.4.5 Water Resources
This category of resource includes both surface water and groundwater resources, and phases 3–6 of the exploration–production life cycle include handling large volumes of fluids. In the process of handling fluids, impacts can include the depletion of limited water supplies and the degradation of quality of water resources related to surface or subsurface contamination by specialized industrial chemicals used in drilling muds or makeup water for the hydraulic fracture stimulation process or natural fluids (crude oil, condensate, natural gas, or produced brines) associated with the oil and gas production. The areas of influence of impact to water resources include where water is withdrawn and extends to where the chemicals are spilled. Water contamination caused by accidental spills or leaks of industrial chemicals or produced fluids, improper wastewater storage and handling, mechanical failures, and inadequate worker health and safety training is predictable as well as avoidable. Water resources can be impacted in many possible pathways. Impacts to water resources can occur because of a release at the wellhead from spills of hydraulic fracturing fluid or additives (Figure 5.2), from pipeline or tanker car spills of Bakken crude oil, or from releases of fluids in the subsurface (Figure 5.3).
Figure 5.2 Water resources can be impacted by fluid spills. Conceptual model of a fluid spill from a drill site showing the environmental fate and transport of the released fluids (US EPA 2016b).
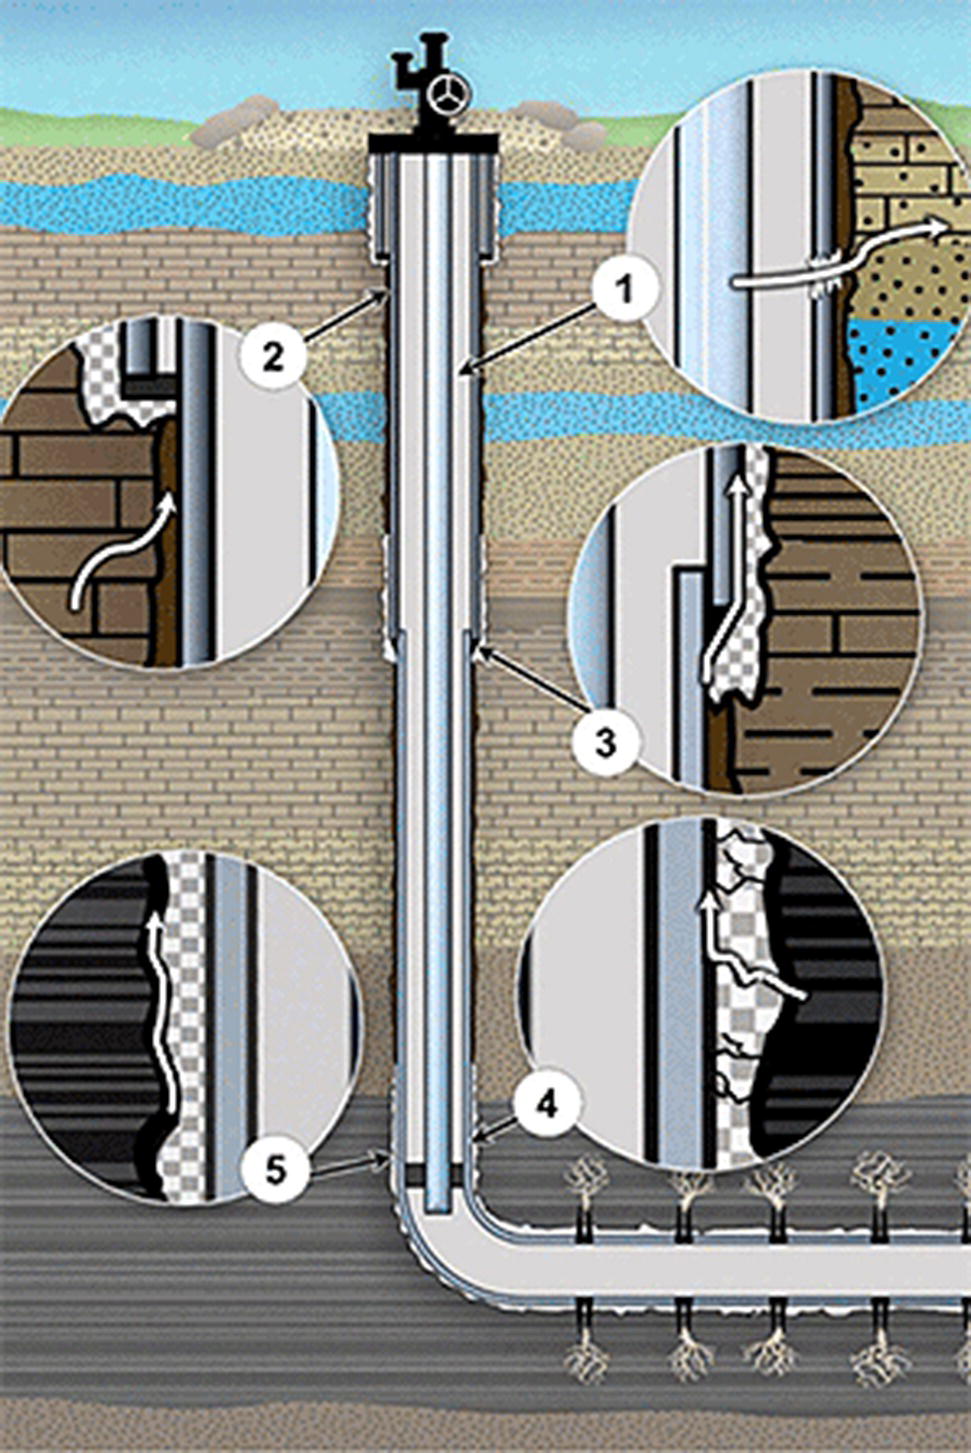
Figure 5.3 Conceptual diagram showing possible release pathways for subsurface fluids to migrate outside the well casing and borehole annulus. No scale implied (US EPA 2016b).
Water resource impacts can be large, although many other industries use significantly more water than the oil and gas industry uses for makeup water for hydraulic fracturing operations. Based on years of assessment (US EPA 2015) and evaluation of hydraulic fracturing for oil and gas and the impacts from the hydraulic fracturing water cycle on drinking water resources in the United States, US EPA (2016a, b) noted the following threats to water resources:
(1) Water withdrawals for hydraulic fracturing in times or areas of low water availability, particularly in areas with limited or declining groundwater resources; (2) Spills during the management of hydraulic fracturing fluids and chemicals or produced water that result in large volumes or high concentrations of chemicals reaching groundwater resources; (3) Injection of hydraulic fracturing fluids into wells with inadequate mechanical integrity, allowing gases or liquids to move to groundwater resources; (4) Injection of hydraulic fracturing fluids directly into groundwater resources; (5) Discharge of inadequately treated hydraulic fracturing wastewater to surface water resources; and (6) Disposal or storage of hydraulic fracturing wastewater in unlined pits, resulting in contamination of groundwater resources.
5.5 Primary Wastes Generated
The largest wastes by volume generated in the exploration–production life cycle are liquids (Table 5.5). Secondary containment, closed‐loop drilling, batteries of liquid storage tanks, and fluid recycling all help to minimize potential leaks of liquids at the drill site. Constant inspection and monitoring, documented worker training sessions, and regular emergency spill response exercises with spill response equipment reduce the risks of large accidental spills.
Table 5.5 Summary of wastes produced during field operations.
| Phase of operation | Wastes produced | Form | Extracted products |
| Phase 3: Drilling | Drilling muds | Liquid | |
| Drill cuttings | Solid | ||
| Phase 5: Fluid recovery and waste management | Flowback of hydraulic fracturing fluids | Liquid | |
| Coproduced water | Liquid | Crude oil and natural gas | |
| Phase 6: Oil and gas production | Coproduced water | Liquid | Crude oil and natural gas |
5.6 Site‐specific Impact Analysis
The university and government studies discuss important large‐scale issues that are critical to address (Appendix A), but to be effective on the local level, operators, landowners, nearby residents, regulators, workers, and others need to focus on site‐specific project impacts. The significance of impact depends on the number and size of wells, the amount of land disturbed by drilling activities, the amount of land occupied by facilities over the life of the project, and the location of the oil and gas field related to the distance to other resources such as ecological, cultural, or paleontological resources. Preparing a site‐specific impact analysis requires a procedure to:
- Identify all possible impacts before drilling starts.
- Determine the area of influence as well as the magnitude and significance of the impacts.
- Identify all resources affected or issues of concern.
- Estimate the level of risk or likelihood of occurrence of the impacts.
- Develop environmental protection and mitigation measures, as needed, to address identified direct and indirect impacts.
- Continue documented inspections and monitoring to verify conditions and to address negative effects of direct and indirect impacts.
Direct impacts occur as a direct result of a prime activity such as drilling or constructing the drilling/production pad. Removed from the activity itself, indirect impacts are separated from the prime activity by an intermediate process or step. It is rare when all questions regarding possible site‐specific impacts can be answered in advance of field activities, as there are frequently uncertainties and data gaps. Those unknowns need to be addressed in a site‐specific impact analysis survey and are frequently addressed using a variety of impact‐related monitoring programs of the specific property which is being used for oil and gas activities, and possibly for nearby properties (TEEIC 2017).
5.6.1 Impacts from Phase 1: Prospect Generation
Phase 1 includes collecting information from public records, university libraries, file research, and local interviews. Some of the work entails locating information about the subsurface conditions and geology. Although there may be a limited number of local field inspections, rock and fluid sample collection, interviews with owners, and other limited interactions, most of the geologic prospect generation processes will occur in the office. Therefore, impacts from Phase 1 prospect generation are limited to field work: geochemical sampling and geophysical surveys.
5.6.1.1 Geochemical Sampling
Sophisticated isotope studies may provide geochemical insights into subsurface conditions. Field crews collect soil, rock, water, or soil vapor samples for laboratory analyses. Direct impacts include vehicle exhaust and erosion.
5.6.1.2 Geophysical Surveys
Geophysical surveys provide an example of both direct and indirect impacts. Geophysical testing relies on sending seismic waves into the subsurface to determine the deeper geologic structures. More common in the past, explosives like dynamite were used. Thumper trucks were first designed in 1953 to provide a seismic source caused by a heavy‐weight drop, usually at a height of about 3.2 ft (1 m) hitting the ground surface. Technical advances since then have improved signal‐to‐noise ratio. Another technology, the seismic vibrator vehicle known by an expired trade name of Vibroseis, transfers low frequency vibrations into the subsurface as a seismic source. With all these seismic methods, numerous seismic sources (vehicles, for example) and detections (geophones) are required, so large field crews and a fleet of vehicles are required for a specific seismic shooting event. The environmental impacts associated with seismic surveys include erosion from shot holes or field activity. The vibrations could also cause well damage. Heavy trucks on newly constructed access roads can cause erosion and produce vehicle emissions. In heavily wooded areas, helicopters may be utilized to transport seismic equipment to remote locations. The direct impacts of the geophysical survey are land disturbance, soil erosion, vehicle traffic and engine exhaust, fuel spills, additional traffic, vehicle vibration and noise, borehole shot explosion noise, and worker activity.
5.6.2 Impacts from Phase 2: Planning and Site Preparation
Phase 2 includes exploratory activities and consists of lease acquisition and documentation of background conditions and potential nearby concerns, such as residents, water supplies, etc. Damaged or abandoned legacy oil and gas wells can affect groundwater resources in an historic oil and gas production area. In addition, the condition of nearby active and abandoned water supply wells must be examined, and tested, if possible, as a way to verify predrilling water quality. The environmental regulations in the 1980s in the United States (and later in other countries) have minimized the potential of improperly abandoned oil and gas wells. Unfortunately, there are many improperly abandoned or lost oil and gas wells drilled prior to the enforcement of environmental regulations. Old water supply wells or abandoned water wells also are common in historic oil and gas production areas. Some of these historic wells were installed without proper well design and impermeable cement seals, or they currently contain damaged or corroded well casings. Historic oil, gas, and water wells can create unintended conduits for surface or subsurface contaminants to enter groundwater resources. Orphaned wells with no existing owner or operator are largely a legacy of the past, when site restoration was not commonly deemed necessary. Not all historic wells create water resource impacts. However, identifying and addressing historic oil, gas, and water wells as possible subsurface conduits prior to the start of unconventional oil and gas activities reduces the risk of future litigation. Sampling of historic and current water supply wells in the area for background geochemistry and water production can help in identifying water quality and quantity concerns prior to oil and gas production. Modern operators performing unconventional resource extraction in an area with historic oil and gas production should locate and document prior environmental damages before the field activities start in order to avoid litigation and environmental discussions about legacy and background conditions.
Only after the leases have been acquired, the environmental impacts have been identified and documented, should the drilling project and well be permitted, followed by site preparation. Limited exploratory drilling of a small‐diameter test borehole may be performed to identify specific basin ‘target zones’ during this phase of activity. If an exploratory well is drilled, direct impacts could include construction of a limited number of access roads, noise, air emissions and wastes produced by the drill rig, and possible spillage of fluids or sludges from lined reserve pits or tanks. Examples of possible indirect impacts of phase 2 activities include disrupting wildlife in breeding or calving season, sediment runoff from erosion, and dust generating from traveling on unpaved roads. Phase 2 also includes well pad and initial access road construction. Excavation and blasting at surface mines for construction materials such as sands and gravels are common. These construction materials may be imported from hundreds of miles away if local sources are not available. Finding adequate supplies of water and nearby gravel and sand and ruling out historic water, oil, gas, and disposal wells, utility conduits, trenches, and geologic faults near areas of industrial activity (drilling wells, laying pipelines, storing oil and gas) reduces potential subsurface impacts should a release of chemicals occur.
Specific Impacts/Activities
- Emissions – Clearing, grading, excavation, and blasting can create dust emissions. Vehicles and earth‐moving equipment generate exhaust emissions. Fugitive gas emissions can be generated by improperly stored fuels, gases, cleaners, degreasers, paints, and solvents.
- Surface Footprint – An individual well pad would occupy <5 acres; however, up to 40 acres per well could be disturbed depending upon the length of access roads, diameter and depth of pipelines, size of excavating equipment and size of equipment storage yards, the number of wells being drilled from each drilling pad, and other factors associated with the field. Horizontal well drilling techniques can minimize surface disturbance. For example, six to eight horizontal wells on a multi‐well drill pad can access the same shale gas reservoir volume as sixteen vertical wells (TEEIC 2017).
- Waste Generation – A potentially large quantity of solid waste derived from vegetation removal would include woody tree and plant debris and miscellaneous wastes associated with pad construction activities. Industrial wastes such as used lubricants and waste oil would also be produced from equipment. Human sanitary wastes are generated by the workers.
- Water – Water will be used for dust control and making cement and concrete features, including tank pads.
- Workforce and Time – About 6–10 workers, mostly equipment operators, could construct a well pad and access roads in about 1 month.
- Other Impacts – Increase in vehicular and pedestrian traffic at the drill site. If the drill site is isolated, construction and installation of work camps and dining facilities would occur.
5.6.3 Impacts from Phase 3: Drilling
During the drilling phase, the activities that may cause environmental impacts include the removal of vegetative cover, ground clearing, grading, drilling, vehicular and pedestrian traffic, and construction and installation of drilling facilities (and work camps, if the site is isolated). Examples of direct impacts include land disturbance, soil erosion, drilling noise, vehicle noise, air emissions, worker activity, drilling‐derived waste material disposal, fuel spills, timing and duration of drilling, and number of jobs created. Indirect impacts include sediment runoff, demand for services, creation of service jobs to serve increased population, and overuse of local infrastructure and emergency services such as roads, water and wastewater plants, schools, hospital, and fire and police services.
Specific Impacts/Activities
Emissions – Vehicles, pumps, and well drilling equipment generate exhaust emissions. Fugitive gas emissions can include natural gas that is mostly methane and other VOCs; polycyclic aromatic hydrocarbons (PAHs); benzene, toluene, ethylbenzene, and xylenes (BTEX); carbon dioxide (CO2); carbon monoxide (CO); and hydrogen sulfide (H2S). Improperly stored fuels can contribute to fugitive gas emissions. Monitoring fugitive gases is performed using multigas detection meters.
Hazardous Materials – By definition, hazardous materials are those substances considered to be toxic, corrosive, flammable, reactive, irritating, and strongly sensitizing. Numerous hazardous materials are used during the drilling and hydraulic fracture stimulation process that may pose a threat to human health of workers or the community or to the environment through unintended fugitive emissions or accidental releases of hazardous chemicals or wastes.
Surface Footprint – Depending upon the ongoing operations, the surface area needed during the production phase could be reduced from the acreage required for the drilling and development phase. After drilling has been completed, a well pad is often reduced in size to 1.5 acres or less. Portions of the area disturbed during construction and drilling that are not needed for ongoing production could be revegetated after drilling to reduce the overall footprint of the well pad.
Waste Generation – Industrial wastes from equipment includes machine and engine waste oils, lubricants, and engine coolants from a variety of on‐site maintenance of construction vehicles and equipment. Spent solvents, cleaning agents, paints, and other corrosion control coatings are used on equipment and applied to structures. Human sanitary wastes and small amounts of wastewaters are generated from cleaning and drill rig assembly operations. Other assorted wastes include dispersants, corrosion inhibitors, surfactants, flocculating agents, concrete, casing, and paraffins.
Water Requirements – Water is used for making concrete and in preparing water‐based drilling fluids. Water is also used as a low‐cost option for dust control. Potable water is needed on‐site for sanitary and cooking uses as well as for cleaning and drilling operations. An emergency water supply for fire suppression is required.
Workforce and Time – The activities for an individual well would require about a dozen workers and take about two weeks for a shallow well and up to six weeks for an especially deep horizontal well.
Utility Requirements – Electricity needed to power the drill rigs would probably be supplied by electric power generators that run on diesel fuel and produce air emissions. Some areas connecting to the existing electric grid for power will reduce noise and local air emissions.
Other Impacts – Continued vehicular and pedestrian traffic occurs at the drill site.
Potential impacts from the drilling and development of an oil or gas field affect much of the project area. Environmental impacts to soil and groundwater resources from the drilling of tight oil and shale gas wells are an important issue in many parts of the world. Oil field facilities, in addition to production wells, may include sumps for the storage of waste fluids (mostly water), injection wells for subsurface disposal of waste fluids, pumping facilities, storage tanks for recovered oil, and pipelines. Impacts while drilling include specific industrial accidents that can occur with great consequences.
5.6.3.1 Blowouts
A blowout usually starts as a formation kick (too much pressure in the reservoir). The downhole fluid pressures are controlled in modern wells through the balancing of the hydrostatic pressure provided by the drilling mud used. Should the balance of the drilling mud pressure be incorrect, then formation fluids (oil, natural gas, and/or water) begin to flow into the wellbore and up the annulus (the space between the outside of the drill string and the walls of the open hole or the inside of the last casing string set) and/or inside the drill pipe. This is commonly called a kick. If the well is not shut in (common term for the closing of the blowout preventer (BOP) valves), a kick can quickly escalate into a blowout when the formation fluids reach the surface, especially when the influx contains gas that expands rapidly as it flows up the wellbore, further decreasing the effective weight of the fluid. In other petroleum engineering words, the formation pore pressure gradient exceeds the mud pressure gradient, even in some cases when the equivalent circulating density (ECD) is imposed on the mud pumps on the rig.
Additional mechanical barriers such as BOPs can be closed to isolate the well, while the hydrostatic balance is regained through circulation of fluids in the well.
Early warning signs of a well kick are:
- Sudden change in drilling rate.
- Change in surface fluid rate.
- Change in pump pressure.
- Reduction in drill pipe weight.
- Surface mud cut by gas, oil, or water.
- Connection gases, high background gas units, and high ‘bottoms‐up’ gas units in the mud‐logging unit.
A relative change in the circulation rate back up to the surface into the mud pits is the primary sign of an impending kick.
5.6.3.2 Well Control
The first response to detecting a kick would be to isolate the borehole from the surface by activating the BOPs and closing in the well. Then the drilling crew would attempt to ‘circulate in’ a denser loss circulation fluid to increase the hydrostatic pressure of the influx fluids that will be slowly circulated out in a controlled manner, taking care not to allow any gas to accelerate up the wellbore too quickly, by controlling casing pressure with chokes on a predetermined schedule.
5.6.3.3 Fracking‐Related Surface Blowouts
Under great pressure, well blowouts can eject the entire drill string out of the well, and the force of the escaping fluid can be strong enough to damage the drilling rig. In addition to oil, the ejecta of a well blowout might include sand, mud, rocks, drilling fluid, natural gas, water, and other substances. Blowouts will often be ignited by an ignition source, from sparks, from rocks being ejected, or simply from heat generated by friction.
Well blowouts can occur during the drilling phase, during well testing, during well completion, during production, or during well workover activities. A well blowout, also called an oil gusher or wild well, is the uncontrolled release of crude oil and/or natural gas from an oil or gas well after pressure control systems, such as the BOP, have failed to contain the fluids and gases.
Examples of Blow Outs
Bakken Shale, North Dakota (February 2014): A blowout occurred at an oil well owned by Whiting Petroleum Corporation. The well started leaking hydraulic fracturing fluid and spraying crude oil. The well lost control after a BOP failed, and the well began leaking between 50 and 70 barrels (2100–2940 gal) per day of hydraulic fracturing fluid (a mixture of generally classified chemicals, water, and sand proppants) and 200 barrels (8400 gal) of oil per day. The fluids were being collected and transported by truck from the well site. An oily mist was sprayed onto a nearby frozen creek (Reuters 2014).
Eagle Ford Shale, Texas (May 2015): A blowout in an oil well owned by EnCana occurred in the rural area near Karnes City, Texas. The well that had undergone hydraulic fracture stimulation spewed crude oil, methane, and other chemicals before it was depressurized and shut down. About 15–20 families were evacuated from the area for safety reasons (Coleman 2017).
5.6.3.4 Underground Blowouts
An underground blowout occurs when fluids from high‐pressure zones flow, uncontrolled, to lower pressure zones within the wellbore. For example, the low‐pressure zone can be a fractured carbonate with large void spaces. Once this low‐pressure zone is encountered, especially in a stratigraphic test hole without any regional geologic knowledge, the circulation of drilling mud is usually lost in the voids, and the shallower, higher‐pressure oil, gas, and waters enter the lower pressure formation to cause an underground blowout. In cases where the higher‐pressure fluids rise to the surface, a surface blowout occurs.
5.6.4 Impacts from Produced Fluids and Gases at Oil and Gas Fields
Petroleum is a naturally occurring mixture that usually exists in gaseous phase (natural gas), or in a liquid form (crude oil), but can also exist as a solid (waxes and asphalt). Primarily composed of hydrocarbons, which are compounds that contain only hydrogen and carbon, petroleum varies widely in chemical complexity and molecular weight. Crude oil is unrefined oil or petroleum.
Petroleum can be any mixture of natural gas, condensate, and crude oil. The term petroleum is derived from the Latin derivative “petra” for rock and “oleum” for oil. A petrochemical is a chemical compound or element recovered from petroleum or natural gas or derived in whole or in part from petroleum or natural gas hydrocarbons and intended for chemical markets. Petrochemicals and hydrocarbons are simply compounds of hydrogen and carbon that can be distinguished from one another based on composition and structure.
Crude oil (commonly just called crude) is the initial oil extracted from the subsurface without any refinement into other liquid forms or products. It is a naturally occurring heterogeneous liquid consisting almost entirely of the elements hydrogen and carbon. The composition of crude oil can vary significantly based on its origin and age. Crude generally ranges from 83 to 87% carbon (by weight), 11 to 14% hydrogen with lesser amounts of sulfur (0.1–5.5%), nitrogen (0.05–0.08%), and oxygen (0.1–4%). Trace constituents comprise <1% in total volume and include phosphorous and heavy metals such as vanadium and nickel.
Crude oil is classified based on the relative content of three basic hydrocarbon structural types: paraffins, naphthenes, and aromatics. About 85% of all crude oil can be classified as either asphalt base, paraffin base, or mixed base. Levels of Sulfur, oxygen, and nitrogen contents are often relatively higher in paraffin base crude, which contains little to no asphaltic materials. Mixed base crude oil contains considerable amounts of both wax and asphalt. Chemically, crude oil is composed of methane (normal straight‐chain paraffins), isoparaffins (branched‐chain paraffins), cycloparaffins or naphthalenes (ring structures), aromatics (benzene ring structures), and asphaltics.
5.6.4.1 Constituents of Environmental Concern
Certain materials generated as part of Exploration and Production (E&P) activities are exempt from regulation as a waste material. Exempt status depends on how the material was used or generated as waste, not necessarily whether the material is considered toxic or hazardous. Some exempt materials may be considered hazardous, whereas some nonexempt materials may not be as harmful. Essentially, if the material or waste is derived from ‘downhole’ (i.e. was brought to the surface during oil and gas operations) or has been generated by contact with the oil and gas production stream during the removal of produced water or other contaminants from the product, then the material or waste is likely considered exempt from RCRA Subtitle C regulations (US EPA 1995). However, this does not preclude regulatory control under state regulations or federal solid waste regulations or other appropriate federal regulation.
Ninety‐eight percent of the waste produced from an HVHF producing oil and gas well is water, frequently containing high salinity and high dissolved solids. The highly‐saline produced water, called drilling brines, is brought up with the oil and is usually collected in tanks or is reinjected back into the well to maintain reservoir pressure to help recover more oil and gas. The primary constituents of environmental concern at oil field and gas field sites are:
- Natural gas.
- Crude oil.
- Drilling muds.
- Drilling fluids.
- Production waste, including brines.
- Refined petroleum products and constituents.
- NORMs.
- Compounds used for maintenance and operations.
5.6.5 Impacts from Natural Gas
The most common hazardous compounds and constituents associated with oil and gas fields include methane gas. Natural gas is composed mostly of methane (CH4); methane gas is a colorless, odorless, tasteless paraffin compound that is less dense than air and formed as the by‐product of organic decomposition. The gas composition of various US shale gas plays also shows methane at 97.3% as the major component (Table 5.6). Methane is also the main component of natural gas (70–94.7%) at various stages of production (Table 5.7).
Table 5.6 Gas composition of various US shale gas plays.
Source: Modified after Bullin and Krouskop (2008).
| Fayetteville Shale gas composition: Arkansas side of Arkoma Basin | |||||
| Well | CH4 | C2H6 | C3H8 | CO2 | N2 |
| Avg | 97.3 | 1.0 | 0 | 1.0 | 0.7 |
| Marcellus Shale gas composition: Pennsylvania, Ohio, West Virginia, and New York | |||||
| Well | CH4 | C2H6 | C3H8 | CO2 | N2 |
| 1 | 79.4 | 16.1 | 4.0 | 0.1 | 0.4 |
| 2 | 82.1 | 14.0 | 3.5 | 0.1 | 0.3 |
| 3 | 83.8 | 12.0 | 3.0 | 0.9 | 0.3 |
| 4 | 95.5 | 3.0 | 1.0 | 0.3 | 0.2 |
| Barnett Shale gas composition; Northcentral Texas | |||||
| Well | CH4 | C2H6 | C3H8 | CO2 | N2 |
| 1 | 80.3 | 8.1 | 2.3 | 1.4 | 7.9 |
| 2 | 81.2 | 11.8 | 5.2 | 0.3 | 1.5 |
| 3 | 91.8 | 4.4 | 0.4 | 2.3 | 1.1 |
| 4 | 93.7 | 2.6 | 0.0 | 2.7 | 1.0 |
| Antrim Shale gas composition; Northern Michigan | |||||
| Well | CH4 | C2H6 | C3H8 | CO2 | N2 |
| 1 | 27.5 | 3.5 | 1.0 | 3.0 | 65.0 |
| 2 | 57.3 | 4.9 | 1.9 | 0 | 35.9 |
| 3 | 77.5 | 4.0 | 0.9 | 3.3 | 14.3 |
| 4 | 85.6 | 4.3 | 0.4 | 9.0 | 0.7 |
| New Albany Shale gas composition; Southern Illinois | |||||
| Well | CH4 | C2H6 | C3H8 | CO2 | N2 |
| 1 | 87.7 | 1.7 | 2.5 | 8.1 | NA |
| 2 | 88.0 | 0.8 | 0.8 | 10.4 | NA |
| 3 | 91.0 | 1.0 | 0.6 | 7.4 | NA |
| 4 | 92.8 | 1.0 | 0.6 | 5.6 | NA |
| Haynesville Shale gas composition; Northwest Louisiana | |||||
| Well | CH4 | C2H6 | C3H8 C1 | CO2 | N2 |
| Avg | 95.0 | 0.1 | 0 | 4.8 | 0.1 |
Common gas terms:
Methane: C1 or (CH4)
Ethane: C2 or (C2H6)
Propane: C3 or (C3H8)
Carbon Dioxide: CO2
Nitrogen: N2 = nitrogen
Not analyzed: NA
Table 5.7 Composition of natural gas at various stages of production and distribution.
Source: From DOE (2013).
| Component | Chemical formula | Wellhead gas (%) | Typical pipeline gas (%) | Liquefied natural gas (%) |
| Methane | CH4 | 70–90 | 88.90 | 94.7 |
| Ethane | C2H6 | 0–20 | 5.34 | 4.8 |
| Propane | C3H8 | 0.46 | 0.4 | |
| Butane | C5H12 | 0.05 | 0.06 | |
| Pentane | C5H12 | <1 | 0.03 | 0.01 |
| Hexane | C6H14 | <1 | 0.02 | 0.01 |
| Nitrogen | N2 | 0–5 | 5.50 | 0.02 |
| Carbon dioxide | CO2 | 0–8 | 0.50 | — |
| Hydrogen sulfide | H2S | 0–5 | — | — |
| Rare gases | Ar. He, Ne, Xe | Trace | — | — |
| Average btu/cubic foot | 1100–1300+ | 986 | 1047 |
The concern surrounding methane is its flammability and explosive potential, particularly in man‐made enclosed spaces such as poorly ventilated rooms, basements, conduits, etc. Since methane is lighter than air, it can migrate upward along natural or man‐made conduits (fractures in bedrock) or along oil wells that have not been abandoned properly. When it reaches a confined space, the methane can be explosive when its concentration in air is in the range of 5–15%.
Methane in an oil field environment is typically biogenic (bacterial) or petrogenic (thermogenic) in origin. Biogenic gas typically is the result of the decomposition of nonpetroleum organic deposits such as plants, landfill deposits, etc. Petrogenic gas typically is a by‐product of petroleum hydrocarbons. Background levels of methane are usually less than a few hundred parts per million (ppm). In situ values of 1 000–20 000 ppm are potentially hazardous, and >20 000 ppm are considered potentially dangerous. In 1985, an explosion and fire destroyed a department store and several adjacent structures overlying the abandoned Salt Lake Oil Field in the commercial Fairfax District of Los Angeles, California. More stringent regulations were subsequently developed to assess whether abandoned oil wells have been properly sealed and to require mitigative measures as necessary.
5.6.6 Impacts from Crude Oil
Crude oil or the common petroleum hydrocarbon products derived from the refining of crude oil can negatively impact drilling and production sites, as well as transportation corridors. Refined crude oil products include compounds in decreasing volatility and increasing boiling point: fuel gases, gasoline, diesel, lubricants, and asphalt (Table 5.8).
Table 5.8 Common petroleum hydrocarbon products derived from the refining of crude oil.
| Distillate | Boiling point (°C) | Boiling point (°F) | Product |
| Gas | 116 | 240 | Fuel gases |
| Liquefied petroleum gas (LPG) | |||
| Petroleum feedstock | |||
| Light–heavy naphtha | 168 | 335 | Gasoline |
| Petrochemical feedstock | |||
| Solvents | |||
| Jet fuel (naphtha‐type) | |||
| Kerosene | 216 | 420 | Jet fuel (kerosene‐type) |
| Light gas oil | 260 | 500 | Auto and tractor fuels |
| Diesel fuel | |||
| Home heating oil | |||
| Heavy gas oil | 316 | 600 | Commercial oil |
| Industrial oil | |||
| Lubricants | |||
| Residuals (bottoms) | 427 | 800 | Bunker oil |
| Asphalt | |||
| Coke |
Crude oil and refined products can contain levels of naphthalene, benzene, ethylbenzene, toluene, total xylenes, and polyaromatic hydrocarbons (PAHs) that exceed acceptable regulatory levels. Although crude oil and some of the fuel‐related refined products like gasoline or diesel are not considered a RCRA waste, some states such as California consider some petroleum hydrocarbons a designated waste, should it exceed certain maximum contaminant levels for arsenic, chloride, chromium, lead, polychlorinated biphenyls (PCBs), or should it exceed the flash point. Thus, the disposal of crude oil or its byproducts off‐site is subject to regulation. Excavated soil containing crude oil or refined products should always be placed on bermed plastic sheeting (10 mil thick) and covered with plastic sheeting to prevent volatilization and migration with storm waters. Soil containing crude oil has been left in the subsurface during many redevelopment projects throughout Los Angeles and Orange Counties in southern California, typically at depths of 5–10 ft below final grade; however, their presence can have a significant financial impact on developers and lenders during oil field property redevelopment or transfers.
During rotary drilling for oil and gas wells, two types of wastes are generated: used drilling fluids (commonly called muds) and drill cuttings. Drilling muds are mixtures of water and other chemical additives used to lubricate the drill bit, remove cuttings from the well bore, and maintain the integrity of the hole until casing and production equipment is installed or during well abandonment or to prevent blowout. During drilling, different additives are mixed with water to yield the desired properties for the mud. The consistency (density, viscosity, weight, gel strength, filtration, and salinity) and mineral content of drilling muds vary to accommodate the nature of the strata, oil, gas pressure, and other oil and gas field characteristics. Drilling muds can occasionally be of environmental concern because of the potential presence of heavy metals, NORM, and other compounds that may exceed certain regulatory standards.
For tight oil and shale gas sites, surface spills from lined pits of drilling muds, hydraulic fracturing compounds, backflow fluids, or production fluids are the most likely source of leakage. Best management practices include keeping fluids in dozens of closed frac tanks (21 000 gal) that have secondary containment, and work to minimize surface spillage and impacts to shallow groundwater resources. Closed‐loop drilling systems are also effective to control fluids at the drill site.
A line pit or sump is typically excavated adjacent to the drill rig, which serves as a mixing area for the muds and as a settling pond. Since drill cuttings and muds may in some instances be considered a waste material, they must be handled in an appropriate manner. The waste muds and cuttings are disposed of by being injected into the subsurface, reused, or transported off‐site to a landfill or off‐site treatment facility. If the characteristics pass engineering structural and stability test, drill cuttings can be used as aggregate in the cold mix asphalt process (Testa 1997). Pits, lined or unlined, are less than optimal for containing liquids or other wastes.
Regardless of the type of drilling mud used, typical contaminants of interest that require periodic monitoring for significant changes are pH, electrical conductivity, sodium adsorption ratio (SAR), cation exchange capacity (CEC), exchangeable sodium percentage (ESP), and total metals. Other constituents of concern include oil and grease and total petroleum hydrocarbons. Drilling fluids usually have a pH that fall within the alkaline range (pH > 10). This high pH is a result from the addition of lye, soda ash, and other caustics, which allows for the dispersion of clay and increased effectiveness. Weathering and aging causes a decrease in the overall pH. Soil salinity is measured by determining the electrical conductivity. This is an important test for soils and waste because of the potential for high brine content that adversely affects plant growth and water quality. Soils exhibiting an electrical conductivity more than 8.0 mmhos cm−1 usually require some manner of management or remediation. SARs are determined to assess potential damage associated with sodium salts from a waste material, which when used in conjunction with electrical conductivity can be ascertained. A SAR less than three can restrict such materials for land disposal. Acceptable metals loading in muds are evaluated by CEC. Measured in meq per 100 g, CEC values are required to estimate the ESP. Excess sodium typically results in a general lack of structural stability among soil particles and impeded water infiltration. Combined excess salinity and sodic conditions can limit remediation efforts (i.e. remove excess salts from the root zone) due to inherent slow infiltration and percolation characteristics.
Total metals analysis provides a good indication for all metals except barium, which is best analyzed under the protocol set forth by the Louisiana Department of Natural Resources. Total metals include arsenic, barium, cadmium, chromium, mercury, lead, selenium, and zinc. Although seldom a significant problem, elevated concentrations of certain metals in soil or waste materials are leachable. The metals of most concern in drilling muds are barium, chromium, lead, and zinc.
The presence of petroleum hydrocarbons in drilling muds or waste are typically due to the introduction of crude oil from a producing formation and/or diesel or mineral oil that is added to drilling muds. Although diesel is likely to be the most common contaminant, diesel‐affected soil and waste materials can be easily remediated via a variety of options.
5.6.7 Impacts from Phase 4: Well Completion and Hydraulic Fracture Stimulation
Phase 4 includes well completion, well testing, and the hydraulic fracture stimulation process with the associated injection of large volumes of frac fluids with chemical additives. Testing the well could include drill stem testing (DST) as a way to evaluate the target zones for the potential presence of petroleum hydrocarbons and pressure ‘conditions’ in the borehole prior to installing casing. Some of the impacts relate to the use of water and the hazardous nature of some of the backflow constituents.
Examples of direct impacts include water use, hazardous compounds in the frac fluids and backflow, well completion and hydraulic fracture stimulation noise, vehicle and equipment noise, air emissions, silica dust exposure, worker activity, hydraulic fracturing‐derived waste material and disposal, fuel spills, timing and duration of activities on nearby residents, and number of jobs created field wide due to these activities. Indirect impacts described as in Section 5.6.3 include non‐point pollution, and higher use of structural and social infrastructure.
Although many of the impacts listed above for drilling apply to the hydraulic fracture stimulation phase, additional environmental impacts include the use of large volumes of water, potential for spillage of hazardous materials and waste fluids and sludges, and silica dust exposure during proppant injection.
The overall well completion process can take a dozen to two dozen workers one to two months to perform, which includes hydraulic fracture stimulation that can take about one to two weeks, depending on the depth of the well and number of completion zones.
5.6.8 Impacts from Phase 5: Fluid Recovery and Waste Management
A variety of well‐ or field‐specific chemical additives are used in the hydraulic fracturing process to clean the borehole, enhance fracturing, increase permeability, and optimize production (Table 5.9). Chemicals can spill not only during phase 4 (that includes the injection of the fracturing liquids) but also during phase 5, when the fluids are recovered. Secondary and tertiary methods of production generally require the use of injected fluids that may contain various production enhancing chemicals, such as surfactants and polymers. Production in marginally producing, generally older oil and gas fields becomes more attractive as the price of oil and gas moves upward. With a major increase in the price of oil and gas, enhancements in field production are evaluated. One common enhancement in older oil and gas fields is the cleanup and stimulation within individual wells as part of a field workover program. This type of production enhancement program usually requires the use of chemicals, including a variety of acids.
Table 5.9 Summary of hydraulic fracturing fluid additives, main compounds, and common uses.
Source: From US DOE (2009).
| Additive type | Main compound(s) | Purpose | Common use of main compound |
| Diluted acid (15%) | Hydrochloric acid or muriatic acid | Help dissolve minerals and initiate cracks in the rock | Swimming pool chemical and cleaner |
| Biocide | Glutaraldehyde | Eliminates bacteria in the water that produce corrosive by products | Disinfectant; sterilize medical and dental equipment |
| Breaker | Ammonium persulfate | Allows a delayed breakdown of the gel polymer chains | Bleaching agent in detergent and hair cosmetics, manufacture of household plastics |
| Corrosion inhibitor | N,N‐dimethylformamide | Prevents the corrosion of the pipe | Used in pharmaceuticals, acrylic fibers, plastics |
| Crosslinker | Borate salts | Maintains fluid viscosity as temperature increases | Laundry detergents, hand soaps, and cosmetics |
| Friction reducer | Polyacrylamide | Minimizes friction between the fluid and the pipe | Water treatment, soil conditioner |
| Mineral oil | Makeup remover, laxatives, and candy | ||
| Gel | Guar gum or hydroxyethyl cellulose | Thickens the water in order to suspend the sand | Cosmetics, toothpaste, sauces, baked goods, ice cream |
| Iron control | Citric acid | Prevents precipitation of metal oxides | Food additive, flavoring in food and beverages; lemon juice ~7% citric acid |
| KCl | Potassium chloride | Creates a brine carrier fluid | Low sodium table salt substitute |
| Oxygen scavenger | Ammonium bisulfite | Removes oxygen from the water to protect the pipe from corrosion | Cosmetics, food and beverage processing, water treatment |
| pH Adjusting agent | Sodium or potassium carbonate | Maintains the effectiveness of other components, such as crosslinkers | Washing soda, detergents, soap, water softener, glass and ceramics |
| Proppant | Silica, quartz sand | Allows the fractures to remain open so the gas can escape | Drinking water filtration, play sand, concrete, brick mortar |
| Scale inhibitor | Ethylene glycol | Prevents scale deposits in the pipe | Automotive antifreeze, household cleansers, and deicing agent |
| Surfactant | Isopropanol | Used to increase the viscosity of the fracture fluid | Glass cleaner, antiperspirant, and hair color |
The compounds used in any specific fracturing operation will vary depending on technical requirements, as well as company preference, water source, water quality, and site‐specific characteristics of the target formation. The compounds shown above are representative of the major compounds used in hydraulic fracturing of gas shales.
Acidizing operations require the use of a variety of chemicals for pH adjustment and for associated precipitation issues. The use of acids can create a number of production problems, including the release of fine particles that can plug a formation as well as the corrosion of the steel drill pipe and casing. Highly corrosive produced waters require the use of corrosive resistant tools and chemical inhibitors. These corrosion inhibitors, such as oil‐wetting surfactants, slow down the reaction time of acid on the metal drilling and production pipe. Fluid loss control agents (silica flour and oil‐soluble resins with natural gum) are added to reduce ‘leak off’ in fracture acidizing operations. Diverting or bridging agents (graded salt, wax beads, sand) in fracture acidizing may be used as materials to prop up the newly created fractures. Particularly in dry gas wells, alcohol has been used as an additive to reduce the time required for well cleanup. Clay stabilizers are used to fix clays in situ, thereby minimizing migration of clays and subsequent plugged permeability. Iron sequestering agents (acetic, citric, and lactic acids) are used to inhibit the precipitation of iron after the acids are spent from an acidizing operation.
Hydraulic fracturing in the oil and gas fields uses nitrogen in well stimulation. Nitrofied fracturing and acidizing uses a foam on fluid‐sensitive wells for improved fluid loss control and cleanup operations (for better production). Frequently used with carbonate reservoirs, such as limestone and dolomite, there are five acid systems: mineral acids (hydrochloric and hydrofluoric/hydrochloric), organic acids (acetic and formic acids), powdered acids (sulfamic and chloroacetic acids), retarded acids (gelled acids, oil‐wetting surfactants, and emulsified acids), and mixed acids (combinations of acids). Typically used strengths of acids will range from a few percent to <30% by weight in water.
5.6.9 Impacts from Naturally Occurring Radioactive Materials (NORMS)
Naturally occurring radioactive material (NORM) is found at levels exceeding the background at many oil and gas production and processing facilities. NORM originates in subsurface oil and gas formations and is usually brought up to the surface with produced fluids and gases, including brine water, natural gas, and other oil field fluids. NORM forms as scales and it precipitates on tubing and equipment. Sludges and sands with isotopes of radium, thorium, uranium, and radon gas are emitted from radium‐contaminated materials and soils; deposits of lead Pb‐210 have been found on the interior of pipes from the transmission of natural gas. Produced waters can contain NORM (Veil et al. 1998).
Isotopes of uranium and thorium, which originate in hydrocarbon‐bearing formations, are parent isotopes of radium and radon. Occurring primarily as Ra‐226 of the uranium U‐238 decay series and radium Ra‐228 of the thorium Th‐232 decay series, thus, with half‐lives, the long‐term potential for disposal is of concern. Oil wells that produce large quantities of produced water will also tend to accumulate the greatest amount of radium‐bearing materials as a result of (i) radium solubility and (ii) its chemical similarity to certain ions such as calcium, strontium, and barium. Gas wells precipitate radon daughters from natural gas streams and fluids. These wells tend to accumulate materials containing larger quantities of lead‐210, polonium‐210, and bismuth‐210.
5.6.10 Impacts from Other Miscellaneous Hazardous Compounds
There are a variety of hazardous compounds, associated with oil and gas facilities that are indirectly related to the produced hydrocarbons. These hazardous compounds are typically found in equipment maintenance and chemical storage areas in oil and gas fields: hydraulic fluids, painting wastes, used equipment lubrication oils, unused free fluids and acids, radioactive tracer wastes, waste solvents, biocides for vegetation control, and pesticides. In addition, PCBs, a dielectric fluid, are common in transformers built prior to 1979. Unless a transformer has a label stating “PCB‐free,” transformer oils are assumed to contain PCBs.
Lead, a durability agent, was added to paint and is commonplace in industrial paints and coatings. Lead may be present in the paint surfaces of rigs, tanks, and production equipment. Lead paint was phased out in the United States by December 1980. Unless tested, all metal surfaces older than December 1980 are presumed to contain lead. Metal products containing lead paint are still being imported into the United States on painted products as of today. Torch cutting on metals containing lead paints such as pipelines, tanks, or production equipment can release lead fumes exposing workers to airborne lead. Lead in dust from cutting lead painted surfaces in oil and gas fields is also an employee exposure risk.
Asbestos has been used for a variety of industrial uses since the 1920s. In oil and gas fields, asbestos has been used in tar wrap for corrosion control of metal surfaces, such as tanks and pipelines. The fibrous nature of asbestos acts likes straw in bricks, adding strength to the wrap. Thermal insulation on tanks, pipes, or equipment containing asbestos may be present in oil and gas fields. In steam injection plants for the production of heavy oil, steam lines may contain thermal wrapping containing asbestos. Unless tested, all suspected asbestos‐containing materials older than 1980 are presumed to contain asbestos. Nonetheless, importation of asbestos or use of stored asbestos‐containing materials may exist to the present.
5.6.11 Impacts from Phase 6: Oil and Gas Production
During the production phase, the field activities that may cause environmental impacts include constructing more access roads, installing pipelines, storage tanks, additional production wells, and other ancillary facilities such as gas compressor stations or fluid pumping stations. Potential impacts from the drilling and development of an oil or gas field affect much of the project area. Although most of the impacts from phase 3 (drilling phase) and phase 4 (well completion and hydraulic fracture stimulation) are temporary in nature, much of the production site and ancillary facility areas are altered for the full production period, which can be several decades. Direct impacts include the land being occupied by the facility footprint, a change in the number of jobs created, air emissions, particulate and dust generation, noise, water use, coproduced water production, timing and duration of production, fuel spills, hazardous materials and wastes generated from production operations and maintenance, and site runoff and erosion. Indirect impacts include sediment runoff; herbicide and pesticide runoff; creation of service jobs to serve increased population; decrease in tourism; overuse of local infrastructure and emergency services such as roads, water and wastewater plants, schools, hospital, fire, and police services; and decline in visits for local outdoor activities such as camping, hiking, hunting, and fishing.
Ongoing production activities – Localized land‐disturbing tasks are anticipated during oil or gas production. Other activities include the operations and maintenance or replacement of production equipment components. After primary production declines in an oil or gas field, drilling secondary and enhanced oil recovery wells may occur. Other hazardous chemicals may be used during the production optimization phase, and thermal treatments may also be used, mostly for heavier oil production. Production workers inspect and monitor the production wells and associated equipment for optimal operation and for signs of spills and leakage. As needed, vegetation management and erosion control efforts should be continuously performed at the production pad, access road, and pump or compressor stations.
Spills and Leaks – Small motor oil and liquid fuel spills are very common especially during transfer. Spills of compounds as varied as crude oil and herbicides require assessment clean up, and disposal.
Surface Footprint – An average oil or gas field has about 4–16 wells per square mile. Some coalbed methane fields have wells located every 20 acres, but typical gas methane well spacing varies from one per 40–320 acres (TEEIC 2017).
Utility Requirements – Oil, gas, or electricity are required to power the engines, pumps, or compressors. Hooking up to the electrical grid would lower noise and local air emissions. Use of on‐site generators may be required for some aspects of repair or replacement of facility components.
Waste Generation – Coproduced water is the largest volume of waste generated during the production phase. The volumes of coproduced water vary widely depending upon the type of formation and age of production. Small amounts of metal degreasers, cleaners, lubricating oils, and fuels are generated (during production) from engines, pumps, and vehicles. Paints or coatings for corrosion control are generated on a regular basis. Vegetation maintenance and control can generate large volumes of woody debris. Other wastes include human sanitary wastes, pipe scale, waste paints, spent catalysts, separator sludge, tank bottoms, used equipment, and vehicle filters. Some fluids and proppants from the hydraulic fracture process, including potentially toxic acids and hazardous compounds, are coproduced with the crude oil or gas. Produced water can contain toxic metals, radionuclides, dissolved solids, salts, biocides, lubricants, corrosion inhibitors, and diesel fuel, if used in the drilling or hydraulic fracturing process. Produced sands and other particles can contain crude oil and NORM.
Water Needs – Potable water is required for the inspection and maintenance workforce and for staff working at pump and compressor stations. Water could also be required for cleaning of equipment or vehicles and as a contingency for firefighting. Large quantities of water may be used to stimulate or enhance production from a well.
Workforce and Time – On average, over a 10‐year production period, oil and gas production could require up to about 2–3 months of one full‐time worker to perform operations and maintenance per well per year. Remote cameras and wireless data collection methods allow for remote inspections and data evaluation. An additional 35–70 worker days per well would be required for workovers. Workover events at production wells could occur at a frequency of once every 3 years to once every 10–20 years, depending on site conditions. The level of work per well would correspond to about two to three months of one full‐time worker for each workover event performed. Oil and gas wells can produce product for 20–50 years or more, but the length of production is largely dependent upon both economic and technological conditions. The highest production usually occurs in the early years. For pipelines and access roads, about one to two dozen construction‐ and supply‐related workers are needed to install new sections of a pipeline gathering system. Access roads would take about 1 day to construct ~1–2 mi of road on flat areas with a crew of 6–10 workers. The same crew working for about two to three days could construct 1–2 mi of access road on steep terrain.
5.6.12 Impacts from Drilling Fluids and Production Wastes
Spent drilling fluids, coproduced fluids and sludges, and other products used on‐site that are no longer needed are designated as wastes. In 1980, Congress conditionally exempted oil and gas E&P wastes, including produced water, from the hazardous waste management requirements of Subtitle C of RCRA, Sections 3001(b)(2)(A), 8002(m). In addition to directing the US Environmental Protection Agency (the US EPA or the Agency) to study these wastes and submit a report to the Congress on the status of their management, Congress required the Agency either to promulgate regulations under Subtitle C of RCRA or make a determination that such regulations were unwarranted. In 1988, the US EPA published its regulatory determination in the Federal Register (53 FR 25447, 6 July 1988) and, along with it, lengthy lists of wastes determined to be either exempt (e.g. produced water, drilling fluids, drill cuttings and pit sludge) or nonexempt (unused fracturing fluids or acids, used lubricants, waste solvents, and hydraulic fluids). The US EPA rearticulated the exemption in the Code of Federal Regulations (40 CFR §261.4(b)(5)). In 1993, the US EPA published a clarification of its regulatory determination in the Federal Register (58 FR 15284, 22 March 1993). And, in 2002, the US EPA published an information booklet on the subject. The US EPA explained that wastes uniquely associated with E&P operations were exempt. With respect to petroleum production, primary field operations include activities occurring at or near the wellhead or production facility, but before the point where the custody of the petroleum is transferred from an individual field activity or centrally located facility to a carrier for transport to a refiner. Without a transfer of custody, the primary field operation ends at the last point of separation. Crude oil stock tanks are considered separation devices.
Wastes derived from treatment of an exempted waste generally remain exempt, and off‐site transportation does not negate the exemption. However, some wastes derived from treatment of an exempt waste may not be exempt. Nonexempt E&P wastes, independent of where generated, include those wastes that are not uniquely associated with an E&P activity. All wastes that are not associated with primary field operations are nonexempt and subject to further scrutiny for purposes of classification. A checklist of examples of some exempt and nonexempt E&P wastes has been compiled (see Table 5.10, Appendix I).
The chemical characteristics of compounds used at a drilling or production facility (specific density, viscosity, vapor pressure, solubility, etc.) are important in planning assessment and cleanup, should these compounds be released into the environment. The federal RCRA Subtitle C exemption for E&P wastes, however, does not preclude these wastes from control under other federal regulations and state regulations including oil and gas conservation programs and some hazardous waste programs. For example, E&P exemption was also incorporated into the California Code of Regulations (22 CCR, Sections 66261.4(b)(2) and 66261.24(a)(1)), but it is limited in scope. The exemption applies in California in cases where the waste is hazardous solely by meeting the federal characteristic for toxicity under the toxicity characteristic leaching procedure (TCLP). Thus, a waste that is hazardous solely by meeting or exceeding the maximum contaminant concentration for constituents extracted by TCLP, and for which federal regulatory thresholds have been established, may be exempted from regulation as hazardous waste in California. The exemption does not apply if toxicity is determined based on criteria other than TCLP, or the waste meets any of the other three characteristics of hazardous waste: ignitability, corrosivity, and reactivity (22 CCR, Article 3, Sections 66261.20 et seq.).
Water and waste management (in connection with oil and gas E&P) involves discharge and injection operations. The main laws governing these activities include the CWA and the SDWA. The US EPA may authorize willing and able states to take the lead responsibility for day‐to‐day program implementation and enforcement of CWA and SDWA. Otherwise, the US EPA Regions run the programs in direct implementation. The CWA requires that all discharges of pollutants to surface waters (streams, rivers, lakes, bays, and oceans) must be authorized by a (general or individual) permit issued under the National Pollutant Discharge Elimination System (NPDES) program. Facilities are responsible for taking the steps necessary to demonstrate compliance with NPDES permit limits. Permits instruct each facility operator relative to the frequency for collecting wastewater samples, the location for sample collection, the pollutants to be analyzed, and the laboratory procedures to be used in conducting the analyses. Detailed records of these “self‐monitoring” activities must be retained by the facility for at least three years. Furthermore, each facility is required to submit the results of these analyses to the regulators on a periodic basis. For most facilities, the reporting frequency is monthly or quarterly, but in no case may it be less than once per year. NPDES permits may also require operational or environmental effects monitoring. This includes the preparation of best management practice plans or spill prevention plans. Numerical effluent limits present the primary mechanism for controlling discharges of pollutants to receiving waters. The US EPA’s effluent limits describe the pollutants subject to monitoring as well as the appropriate quantity or concentration of pollutants. Permit writers derive effluent limits from the applicable technology‐based effluent limitation guidelines and water quality‐based standards. The more stringent of the two will be written into the permit (Pruder and Veil 2006).
Per SDWA the US EPA has the authority for Underground Injection Control (UIC) regulation. The UIC program is designed to protect underground sources of drinking water (USDW). For regulatory control purposes, underground injection is grouped into five classes of injection wells. An injection well is defined as any bored, drilled, or a driven shaft or a dug hole, where the depth is greater than the largest surface dimension that is used to inject fluids underground. Class I wells are used for the emplacement of hazardous and nonhazardous fluids (industrial and municipal wastes) into isolated formations beneath the lowermost underground source of drinking water. Class II wells are permitted for operators to inject brines and other fluids associated with oil and gas production. Class III wells are permitted for operator to inject fluids associated with solution mining of minerals. Class IV wells, which involve the injection of hazardous or radioactive wastes into or above an USDW, are banned unless authorized under other statutes for groundwater remediation. Class V wells include underground injection wells not included in classes I through IV. Wells used for injecting oil field waste materials associated with E&P operations are considered class II wells. Class II subclasses include disposal wells (class II‐D) and enhanced recovery wells (class II‐R).
The US EPA’s regulations establish minimum standards for state programs prior to receiving primary responsibility (primacy) for the UIC program under Section 1422 of the SDWA. The federal requirements governing application, construction, operating, monitoring, and reporting for class II wells are found in 40 CFR parts 144 and 146. It should be noted that a state program can always be more stringent than the federal blueprint. In 1981, Congress added Section 1425 to the SDWA, which relieves oil‐ and gas‐related injection well programs in the states from having to meet the technical requirements in the federal UIC regulations. Instead, the demonstration must be made that the state has an effective program (including adequate oversight, record keeping, and reporting) in place to prevent the endangerment of USDW by underground injection operations. Because the Section 1425 approval route offers greater flexibility, most states have obtained UIC primacy in this way (Pruder and Veil 2006).
Federal laws and regulations generally establish minimum federal standards. States have the lead role in the regulation of E&P and general industrial waste disposal. In light of the varying geological, climatological, ecological, topographic, economic, geographic, and age differences among oil and gas drilling and production sites across the country, the laws and regulations of authorized states relative to oil and gas waste management operations exhibit differences in detail and scope when compared with the federal blueprints or other state programs.
Historic waste management procedures, identification of E&P activities and associated hazardous wastes, and options for waste reduction, recycling, treatment, and responsible disposal were documented (The E&P Forum 1993). Earthen or lined skim pits were common in many oil fields and were an integral part of E&P waste management operations. Historically, these on‐site pits have been used for the management of drilling solids, evaporation and storage of produced waters, management of workover and completion fluids, and emergency containment of produced fluids. Unfortunately, many of the skim pits were unlined, and although the skim pits are an accepted historical component of E&P operations, the pits represent an environmental liability if managed improperly. In unlined pits, surface water and groundwater drinking resources can be impacted by subsurface migrations of oil and gas production wastes.
Once the on‐site assessment at an oil or gas field has determined that impacted soil requires remediation, there are a variety of cleanup methods used at the drill sites, in production facilities, along pipelines, and at refineries and bulk storage terminals. Once released into the environment, crude oil and gas, depending on the specific chemistry and properties, can partition between various phases: soil gas, groundwater, and soil. Detailed national studies on cost of drilling and production wastes are described (NETL 2014; Pruder and Veil 2006; Veil et al. 2004). Later in the chapter, a variety of remediation methods for aboveground soil treatment and subsurface treatment of impacted soil and groundwater at onshore oil and gas fields is discussed. A checklist of waste disposal and treatment options is provided (see Table 5.11, Appendix I).
5.6.13 Impacts from Specific Oil and Gas Field Locations
Surface releases of production or waste fluids or sludges can occur in many locations, including well cellars, well sumps, piping ratholes, storage pits, and underground or aboveground storage tanks. Minimizing the impacts of accidental fluid release is directly related to control measures used in fluid management and regular inspection of fluid storage locations.
5.6.14 Impacts from Historic and Abandoned Oil, Gas, and Water Wells
Due to improper abandonment or a lack of a competent cement seal, or cracked cement, many historic wells have the potential to create vertical conduits for surface fluids or subsurface fluids and/or gases to migrate into drinking water supplies. Locating historic and abandoned wells is difficult but can be done by performing local interviews, inspecting low‐altitude aerial photography, reviewing regulatory documents and well permits, using metal detectors to locate iron or steel well boxes, and performing rigorous field inspections. There are estimated to be over a million abandoned wells in depleted oil and gas fields in the United States. Many old oil and gas wells were not initially adequately plugged upon abandonment and have the potential to leak well fluids (methane, oil, brines) to local groundwater and ground surface. Historic water wells also have the potential to create vertical conduits for surface or subsurface fluids to migrate into drinking water supplies. Damaged and corroded casing of abandoned wells can degrade water resources (Figure 5.4).
Figure 5.4 Improperly cased or damaged well (middle) or well with corroded casing (right) can impact a properly constructed well (left) by being a conduit into poor quality water units or even oil and gas zones.
Source: Modified after Barlow (2003), from a modified diagram of Metz and Brendle (1996)).
Historic and improperly abandoned or damaged oil, gas, or water wells are possible conduits that can impact shallow groundwater resources, with probable conduits for oil and brine contamination into shallow water‐bearing zones. Poorly cemented annular spaces in oil and gas wells can allow production fluids, both brines hydrocarbons, and methane to act as a conduit into possible shallow groundwater‐bearing zones. Channeling within the well’s annular space is caused by the incomplete displacement of the drilling mud by the injected cement slurry, resulting in washed out sections of annular space. Secondary channeling is caused when annular voids are created after the cement slurry is in place. Shattering in perforation zones can create additional annular damage and possible leakage to contaminants or brines into groundwater‐bearing zones. Poor cement bonding between the interface of the casing and cement, or cement and the well bore wall, create leakage problems as well. Poor quality cement may be result if the wrong cement additives are used or if they are prepared improperly. The failure of the cement can cause void spaces and cement failure, providing conduits into the subsurface of production fluids. Leakage can occur at the interface between the casing and cement and can cause conduits to form between the casing and the cement interface.
Cement can also fail and crack over time. Large oil and gas blowouts can be associated with cement and annular failures. Government and industry investigations into the BP oil spill of 2010 in the Gulf of Mexico indicated that the precipitating cause of the blowout was the failure of the cement to isolate the reservoir, which was under extremely high pressure. The incomplete sealing of the borehole by the cement permitted hydrocarbons to enter the wellbore. Confirmation of cement and annular sealing activities is based on cement testing and other observations.
The Martha oil field in eastern Kentucky provides an example of shallow aquifers in and near oil and gas fields that have long been used as sources of drinking water. In 1919, the Martha oil field produced from the Devonian–Weir sands and the main field area was about 4500 acres (1821 ha). The historic wells in the area predated modern well construction standards and the age of the metal casings far exceeded normal life expectancy. Water flooding activities within almost 3200 acres (1295 ha) in the Weir sands started in 1955 by the operator, Ashland Oil Company, and an additional six million barrels of oil were recovered between 1955 and 1970.
The freshwater injection not only was designed to increase production within the oil zone but also caused an increase in the potentiometric head within injection wells in the upper Weir and lower Weir oil sands. The upwelling of coproduced brines and oil through corroded and breached well casings, uncemented annular spaces, and improperly plugged and abandoned wells in the area resulted in the widespread groundwater contamination of three aquifers designated as USDW: Alluvium, Breathitt, and Lee Formations (Eger and Vargo 1989). Some fluids reached the surface, impacting shallow soil. Complicating aquifer management in the area, cones of depression in the Lee aquifer resulted from pumping of industrial water supply wells.
The target Devonian rock units (weir sand) contain low‐level concentrations of radium‐226, a highly water‐soluble, naturally occurring radioactive element that has been brought to the surface with the brines, contaminating shallow groundwater in the oil field and leaving a radioactive signature on scrap metal pipe that was first detected by a Geiger counter at a nearby scrap metal yard in 1988. When a NORM is concentrated on the surface due to human activities, such as oil or gas production, the NORM takes a new name as it becomes technologically enhanced naturally occurring radioactive material (TENORM). Clean up at the Martha oil field included the removal of 145 000 tons of TENORM‐contaminated soils and millions of feet (meters) of NORM‐contaminated pipe that were placed in nearby landfills.
The US EPA and the US Army Corps of Engineers confirmed the widespread nature of the groundwater contamination in 1986, and US EPA Region IV determined that the responsible party was in violation of the Safe Drinking Water Act (SDWA) and the UIC regulations, including violations that the operator allowed for the movement of fluids to enter the USDW, failed to properly pug or abandon injection wells that were deemed temporarily abandoned, and injected at a pressure that resulted in contaminants migration into a USDW (Eger and Vargo 1989).
5.6.15 Impacts from Transportation Activities
Impacts from transportation activities of products are widespread and international in impact, as natural gas and crude oil are transported to market. The main forms of transportation in the oil and gas industry include pipelines, train tanker cars, truck tankers, and barges and ships with tanks. Pipelines are an integral part of transportation of natural gas or crude oil from the wellhead to market (Figure 5.5). Different types of pipelines are used for transporting hydrocarbons from the source to the end user (Table 5.12). Each of the types of pipeline networks varies with diameter, characteristics, and function. Pipeline failure can represent a site of a potential release or explosion far from the source area (Table 5.13).
Figure 5.5 Natural gas pipeline system from the well head to the customer (US DOT, PHMSA; 2017).
Table 5.12 Summary of pipeline distribution system.
| Gathering lines | Feeder lines | Transmission pipelines | Local distribution pipelines | Service pipelines | |
| Types of pipelines | These lines travel short distances gathering products from wells and move then to oil batteries or natural gas processing facilities | Feeder lines move products from batteries, processing facilities and storage tanks in the field to the long‐distance haulers of the pipeline industry, the transmission pipelines | Transmission lines are called energy highways, transporting oil and natural gas across long distances and occasionally across interstate or international boundaries. Transmission pipelines transport liquids or gases to and from compressor stations to a distribution center or storage facility | Local distribution companies (LDCs) operate natural gas distribution lines | Pipeline connects from distribution pipeline to a meter that delivers natural gas to individual customers |
| Products | Natural gas, crude oil, and combinations of these products sometimes mixed with water and natural gas liquids (NGLs) such as ethane, butane and propane | Crude oil, natural gas, and NGLs | Natural gas transmission lines typically carry only natural gas and NGLs. Crude oil transmission lines carry different types of liquids including crude oil and refined petroleum products in batches. Petroleum product lines also move liquids such as refined petroleum products and NGLs | Natural gas is moved along distribution pipelines to homes, businesses, and some industries | Natural gas |
| Pressure for natural gas | Gas: 250 psi | Gas: | Gas: 200–1200 psi | Gas: 0.3–200 psi | Gas: low pressure; 6 psi |
| Example diameter | 4–12″ in diameter | 4–12″ in diameter | up to 42″ in diameter, frequently more than 10″ in diameter | Most range in size from 2–24″ in diameter | Most range in size from 0.5–6″ in diameter |
| Length | There are hundreds of thousands of miles of these lines that are concentrated in the producing areas | There are tens of thousands of miles of feeder pipelines in producing areas | There are hundreds of thousands of miles of transmission lines | There are hundreds of thousands of miles of these lines | There are hundreds of thousands of miles of these lines |
| Composition | Steel; gas is unodorized and highly corrosive | Steel; gas is unodorized and highly corrosive | Steel; gas is unodorized | Steel, cast iron, plastic, copper. Gas is odorized | Plastic, copper, or steel. Gas is odorized |
NGL, natural gas liquids.
Table 5.13 Examples and causes of pipeline failures.
| Pipeline rupture or leak source | Examples |
| Material degradation | Internal corrosion; external corrosion |
| Physical damage | External incident (strike by vehicle, bullet, post‐hole digger, backhoe or excavator, trenchless pipeline strike, vandalism) |
| Geologic movement and earth displacement | Earthquakes, landslides, debris flows |
| Water or flood damage | Tsunamis, storm surge, flash floods, hurricanes |
| Material imperfections or installation defects | Manufacturer pipe or coupling defect; defective welding, seam failures |
| System malfunctions and human error | Operating pipeline over design pressure, placing incompatible compounds in pipeline |
Other transportation impacts relate to shipping by rail or highway of the chemicals, proppant sands, bentonite clay, construction gravel and sand, and other supplies. Drilling‐derived wastes and production wastes when disposed of at off‐site facilities rely on highway, rail, and waterways for transportation corridors.
5.6.16 Impacts from Phase 7: Well Decommissioning and Site Restoration
The well decommissioning process is initiated at the end of production and consists of closure of the production wells, removal of the production facilities, and restoration of the site to predrilling condition. Equipment, pipelines, pits, pads, and debris are removed. Oil‐stained surface materials such as gravels or soils contaminated from spills or leaks can be treated on‐site using biofarming techniques to reduce toxicity. Alternate approaches include the use of the impacted materials in a recycling process to make cold mix asphalt (Testa 1997), or the materials can be transported off‐site for treatment and disposal. Well abandonment relies on plugging the casing with cement and packers. After the surface of the production facility has been cleaned, the well pad and access roads are regraded and recontoured. Fill material may be compacted, and pads and roads may be replanted with native plants. The direct impacts of the well abandonment process include land disturbance, site runoff, soil erosion, heavy equipment and vehicle noise and exhaust, fuel spills, dust, worker activity, and excavated material and waste disposal. Some of the indirect impacts include sediment runoff.
Emissions/Exhaust – Dust would increase, as compared with the production phase, as a result of increased worker and vendor vehicle travel on unpaved access roads. Criteria pollutants would be generated from the operation of vehicles and construction equipment. Volatile organic chemicals could be released from the storage and dispensing of fuels for vehicles and equipment. Decommissioning wells could release methane, VOCs, PAHs, particulate matter, sulfur compounds, carbon dioxide, and carbon monoxide.
Vehicles, cement pumps, and well destruction equipment generate exhaust emissions. Volatile organic chemicals would be released from the storage and dispensing of fuels for vehicles and equipment. Abandoned wells could release fugitive gas emissions including natural gas that is mostly methane and other VOCs, PAHs, BTEX, carbon dioxide (CO2), carbon monoxide (CO), and hydrogen sulfide (H2S). Improperly stored fuels can contribute to fugitive gas emissions. Monitoring fugitive gases is performed using multigas detection meters.
Surface Footprint – About the same amount of area disturbed during the development of the oil and gas field would be impacted by decommissioning and reclamation activities. Overall acreage of the oil or gas field would decrease as individual wells, pipelines, access roads, and other ancillary facilities are removed and the area is restored.
Waste Generation – Equipment and fixtures are to be decontaminated, if possible. Some of the decontaminated components could be recycled. Human sanitary wastes would be produced by work crews. Removal of production equipment and excavation of the subsurface fixtures will generate industrial wastes.
Water Needs – Water would be needed for dust suppression, firefighting contingency, and potable supply for the workforce.
Workforce and Time – Fewer workers would be required than during the production phase. About 8–12 workers would be needed for 1–2 weeks to remove equipment and buried pipes from a well pad site. The estimated duration of the project is highly variable due to surface and subsurface conditions, the amount of leakage and spillage on the site, the amount of equipment decontamination required, the proximity of recycling centers, and regulatory requirements regarding future use.
Utility Requirements – Utility requirements vary, but if the facility is not on the electrical grid, portable electric generators will be needed.
5.7 Summary of Resources and Issues
A variety of resources and issues are described below with suggested mitigation measures:
Air Resources – This includes exposure to noise, odors, volatile chemicals, silica dust from proppants, and construction dust. Methane and other GHG released as fugitive emissions from oil and gas wells associated with fracking operations are seen by some researchers as a concern (Howarth et al. 2011, 2012a, b). Besides fugitive emissions, numerous VOCs and semivolatile organic compounds (SVOCs) are present at drilling and production facilities related to operational chemicals such as fuels, lubricants, cleaners, drilling additives, or fracking chemical additives. In addition, produced compounds naturally contain VOCs and SVOs. Diesel engines used in transporting workers, supplies, produced hydrocarbons, and wastes generate GHG. The drilling mud circulation and hydraulic fracturing pumps also emit air pollution and particulates. If not handled properly, proppants can release dust and particulates, potentially causing respiratory ailments for workers and nearby residents. Old or abandoned oil, gas, and water wells may not have proper construction and lack adequate cement seals. Consequently, these historic wells may act as conduits for methane emissions from the subsurface into the atmosphere. Locating the wells requires historic documents, interviews, and field checking. Grading of the drilling and production pads and access roads can create dust. Silica dust from frac sand mines and the frac sand proppant injection process during hydraulic fracturing can emit fine particulate matter (PM2.5) and respirable crystalline silica dust into the breathing zone of workers and nearby residents. Inhalation of the fine dust particles causes lung disease, lung cancer, cardiovascular disease, and increased mortality (Walters et al. 2015). The sound of drilling operations can be heard at low levels (55 db) as far away as 3500 ft (1067 m) from the well. Flaring of unwanted natural gas contributes to GHG. On a global scale, the use of fossil fuels produces GHG.
Mitigation Measures of Air Resource Impacts – Minimize surface disturbances and size of cleared vegetation as a way to reduce construction‐related dust. Limit vehicle speed to reduce airborne fugitive road dust, and post and enforce speed limits. Revegetate disturbed areas with native plants, and use erosion controls (wattles, berms, silt fences, fiber mats, etc.) to control storm water runoff and wind erosion. During construction operations, keep exposed soil moist, minimize load drop heights from digging equipment, tighten gate seals on dump trucks, and cover dump trucks with plastic sheeting or foam. Educate workers to minimize activities that contribute to generating fugitive dust emissions. Cover bare soil stockpiles with plastic sheeting. Minimize slash burning of vegetation debris after construction clearing, and, instead, process wood and plant debris using wood chipping equipment to generate wood mulch that can be used for soil erosion control (TEEIC 2017).
Operate emission control devices on engines, pumps, and drilling equipment, and use low sulfur fuels, when available. Recycle and capture currently flared methane, use more fuel‐efficient engines, motors, and pumps that will reduce fuel‐related emissions. Inspecting by performing field screening and well and pipeline repairs can reduce fugitive methane emissions from equipment, and best management practices and dust control can reduce particulate and dust pollution related to handling, storing, and using proppants. Minimizing hazardous materials use, including VOCs and SVOCs on‐site, will lower the risk of release. Use erosion control and dust control methods to minimize dust exposure and soil erosion. Optimizing planning and minimizing vehicle trips reduce traffic and emissions, as well as roadway degradation. Encourage the use of green completions for less toxic compounds use and lowering greenhouse gas emissions. Locate and properly destroy all nearby old or abandoned wells, so they are not conduits for fugitive methane emissions. Reinjecting produced natural gas or using it in operations will reduce the energy the waste of flaring. Ultimately, reducing fossil fuel use and using renewable energy sources will lower greenhouse gas production.
Ecological Resources – Wildlife impacts, habitat fragmentation, and the introduction of invasive, nonnative species are the issues included in ecological resources. The unconventional resource assessment and extraction requires clearing of substantial amounts of land and grading for drilling/production pads and pipelines and developing new or improving access roads. For remote production pads, new roads to nearby towns and supply centers will also be constructed. The additional traffic and air pollution from trucks, barges, and trains also disrupts wildlife in the area. These changes also can impact landscapes as well as the quality of life.
Mitigation Measures of Ecological Resources Impacts – Minimize access road footprints to lower dust. Maintain connected and continuous wildlife corridors to allow for the migration of larger animals. Perform background ecology zone mapping and animal population studies before field activities start. Minimize fencing and walls that would block animal movement. Designate off‐limit areas to protect wildlife and minimize activities and operations in sensitive feeding, nesting or breeding areas, and limit off‐road vehicle use. Locate drilling and production facilities outside of landslide zones, beyond the 100‐year floodplain, and not in areas where flash floods will destroy equipment and damage the nearby ecological resources. Develop a plan to plant native vegetation and a maintenance plan to control invasive species and noxious weeds that could impact wildlife. Keep vehicles and portable equipment clean of invasive seeds, and only reseed with native species. Prohibit the use of imported fill materials that might contain seeds of invasive plants. Include buffer zones to exclude unintentional disturbance or accidental impacts. Develop spill response plans, stormwater pollution prevention plans, and best management practices to limit ecological damage in proximity to drilling and production activities. Limit the number of stream crossings when locating access roads, and allow for the safe passage of fish and aquatic life. Educate workers, contractors, and site visitors to avoid harassment and disturbance of wildlife and to instill the importance of ecological resources and protection methods. Schedule site activities to avoid disturbance of ecological resources during critical times of year such as periods of courtship, breeding, nesting, lambing, or calving. Minimize activities that might disturb wildlife during certain periods of the day. Night is a critical period of the day for certain species. Minimize noise, when possible, and eliminate all unnecessary night lighting. Place bird or animal netting on open reserve pits and trenches, and use wildlife deterrents or other exclusionary devices to prevent access to them. Use only safe, nonpersistent, immobile, and biodegradable herbicides, rodenticides, insecticides, and pesticides, applying the compounds per the directions of the manufacturer. Deploy drip pans, or create temporary containment berms with plastic liners or other spill prevention practices while refueling vehicles and equipment to minimize accidental contamination of animal habitats. Have an appropriate professional identify ecological resources and establish a buffer zone around mapped bird nests, bat roosts, raptor nests, and even rare plants.
Cultural and Paleontological Resources – Previously inaccessible historic artifacts, petroglyphs, and fossils may be collected or vandalized by persons using newly constructed access roads. Disturbance of the surface while constructing drilling/production pads and pipeline trenches can damage buried cultural and paleontological resources. Excess air pollutants from vehicles, pumps, and engines and vibrations caused by activities can damage fragile rock art and some historic artifacts.
Mitigation Measures of Cultural and Paleontological Resource Impacts – Minimize access roads and pads, map and preserve cultural and paleontological resources prior to drilling, install security cameras at remote sites, vigorously prosecute vandals, as well as fossil and artifact collectors who are vandalizing or stealing on private or public lands. Perform a records search of known historic buildings and archeological or paleontological sites in the area. Evaluate nearby sites for listing on or possible eligibility to the National Register of Historic Places, the National Historic Trails, national monuments, national parks, sites noted by Native American governments, state and local park or open space districts regarding traditional and cultural resources, including sacred landscapes and historic and religious sites. Use existing access roads, if possible, to minimize additional surface disturbance. Prepare a cultural or paleontological resources management plan if those resources are known to be present or are highly likely to be in the oil and gas development area. Perform periodic monitoring and inspection of significant cultural or paleontological resources in the area of the oil and gas development to reduce the potential for collecting and vandalism, and notify state or federal authorities if damage to cultural or paleontological resources has occurred. Educate workers and the public on the consequences of collecting or damaging artifacts and on the potential for an unexpected discovery of a cultural or paleontological resource in the area. Unexpected discoveries would cause a work stoppage pending inspection by an appropriately trained professional. During all phases of the E&P life cycle, keep all equipment, vehicles, and activities on the designated work areas, minimizing the overall footprint and surface disturbance (TEEIC 2017).
Environmental Justice Issues
In some areas of the country, drilling and production activities and facilities may differentially impact low‐income or minority populations. This may occur not only at the drill site but also along the pipeline corridor, at the sand and gravel mine, or at the refinery or storage terminal.
Mitigation Measures of Environment Justice Issue Impacts – Job training programs aimed at developing skills of the local low‐income or minority population can help address environmental justice issues. Operators can develop public information and support community meetings to provide accurate technical, health, and safety information.
Water Resources/Water Quantity – A single oil or gas well using the fracking process can require 3 million gallons (11.3 million liters) to 8 million gallons (30.2 million liters) of water (Abdalla and Drohan 2010; Abdalla et al. 2011 and 2012; ALL Consulting 2012), especially in areas experiencing drought, greatly impact local water availability. A chart showing the use of water by different industries shows that although the fracking process uses significant amounts of water, other industries also use large volumes of water (Figure 5.6).
Figure 5.6 Figure showing the volumes of water usage in the United States for 2005 by category. Oil and gas operations are only part of the mining category that in total comprised about 1% of the total water used in the United States in 2005 (USGS).
Mitigation Measures for Water Resources/Quantity Issue Impacts – Long‐term water management, recycling of fracking waters, and using waters from non‐potable sources, such as waters related to acid mine drainage (Vengosh et al. 2011; Warner et al. 2013).
Water Quality – Spillage of hazardous compounds or leakage of produced liquids or gases, produced brines, and other chemicals has the potential of impacting surface or groundwater quality. Water quality of surface and shallow groundwater can be degraded by the contamination by toxic compounds including shallow aquifers with spilled liquid compounds from surface. Leakage can occur in lined pits, from above or underground storage tanks, and from tanker trucks, oil tanker ships or barges, tank railcars, and pipelines etc. A surface spill survey was conducted by the US EPA for oil tank facility owners and operators. The general relationship between annual spill volume, annual number of spills, tank capacity, cleanup costs, and other parameters is shown in Figure 5.7. The larger the facilities, based on storage capacity, the larger number of tanks, and the larger annual throughput are likely to have a greater number of oil spills, larger volumes of oil spilled and greater cleanup costs (US GAO 1995).

Figure 5.7 Relationship between annual spill volume (left column), annual number of spills (center column), and annual throughput (right column) per annual spill volume (top row), annual number of spills (middle row), and cleanup costs per storage tank capacity (lowest row) (US GAO 1995).
Besides the possibility of leakage of fluids from poorly contained or spilled sources on the surface, hydrocarbons, metals, NORM, brines, and drilling or fracking wastes could also enter surface waters or shallow water supplies should connections between the contaminant sources exist to allow entry. Although not common or likely, it is possible that even deep contaminant sources in the target reservoirs (tens of thousands of feet deep) could possibly impact shallow groundwater resources if connectivity exists through transmissive geologic faults, deep leaking well casings, failed cement seals, or other connections. Fugitive hydrocarbon gases can also potentially lead to the salinization of shallow groundwater through leaking natural gas wells and subsurface flow (Vengosh et al. 2014). The overextraction of water resources for high‐volume hydraulic fracturing could create water shortages or conflicts with other water users, particularly in drought‐prone areas.
The US EPA assessed how likely storage tanks were to leak, and they performed an analysis of the relationship between oil storage facility characteristics and oil spill incidents (US GAO 1995). The 1995 Survey of Oil Storage Facilities (1995 SPCC Survey) collected information from more than 2600 oil‐storing facilities in 23 different industries. The results showed that the larger the facilities storage capacity, the larger the number of storage tanks, and the larger the annual throughput are likely to have a greater number of oil spills, larger volumes of oil spilled, and greater cleanup costs (Figure 5.9). Most oil field production facilities stored between 10 000 and 50 000 gal of crude oil. Distribution industry sector (including petroleum refining, pipelines, petroleum bulk stations and terminals, gasoline service stations, and fuel oil dealers) stored between 50 000 and 100 000 gal of oil. The US EPA’s analysis also showed that facilities with greater annual throughput are more likely to have larger spill volume, more spills, and, to a lesser extent, larger yearly cleanup costs.
US EPA also evaluated oil spill prevention programs. Spill Prevention, Control, and Countermeasure (SPCC), as described in 40 CFR Part 112, includes a variety of requirements (both physical controls and written reports) to minimize the potential for oil spills (US GAO 1995). In the study of more than 2600 oil‐storing facilities in 23 different industries, physical controls such as tank leak detection, spill/overfill protection, pipe external protection (cathodic protection is a common example of external protection), and secondary containment berms all had a reduction on the number of spills, the spill volume, the cleanup costs, and off‐site migration (95% confidence that the SPCC provision had a positive effect on reducing the particular spill risk) (US EPA 1996b). Unlike the physical controls listed above, written documents, such as spill prevention plans (SPP) and spill response plans (SRP), were either inconclusive or not estimated regarding the impact on number of spills, spill volume, cleanup cost, or off‐site migration. The US EPA study (1996b) clearly shows that physical controls such as secondary containment, for example, have much greater success at minimizing oil spills than written procedures and training described in reports such as SPPs and SRPs. Best management practices including secondary containment berms, better standards for materials and designs for storage tanks, and increased worker training for fluid handling, storage, and transporting will lower the number of spills; however, leaks and spills will continue to occur.
Spillage of undocumented or undisclosed injected chemicals, listed as proprietary or trade secrets, creates an unreasonable and unnecessary conflict wherein regulators and concerned landowner or neighbors cannot test water, soil, or air for their presence. Disposing of drilling or fracking wastes onto the landscape, reinjecting the fluids into deep wells, and transporting waste fluids to treatment facilities create the risk of an accidental release into the environment, impacting surface or groundwater resources. Should water resources become degraded by drilling, fracking, or production‐related activities, operators should provide water treatment or new sources of drinking water supplies.
Laboratory sampling and analysis are not always available when spills or leaks of hazardous chemicals occur. Farm animals and wildlife exposed to chemicals can serve as sensitive biomonitors of environmental conditions. The study of the environmental impacts of gas drilling on human and animal health (Oswald and Bamberger 2012) showed common examples of accidents with associated documented cases of animal deaths. Examples of animal deaths associated with accidental exposure to unconventional oil and gas production are as follows:
- Hydraulic fracturing fluid spill from holding tank.
- Drilling fluids overran in well pad during blow out.
- Stormwater runoff from well pad to property.
- Wastewater impoundment leak.
- Wastewater impoundment allegedly compromised.
- Wastewater spread on road for dust control.
- Wastewater dumped on property.
- Wastewater dumped into creek.
- Pipeline leak.
- Compressor station malfunction.
- Flaring of well.
- Pits and lagoons not covered with bird netting.
- Wastewater ponds, open‐top tanks, lagoons not fenced off.
- Others.
Reviewing the sources of exposure suggest that some of the spill types listed above could have been avoided by better monitoring, maintenance, and owner/worker training. It should be noted that some of the geologic basins for unconventional oil and gas production generate surface impacts such as natural oil or gas seeps that are natural and within a pre‐drill normal.
Mitigation Measures for Water Quality Issues Impacts – Release of hazardous chemicals can be addressed by operators with best management practices, including closed‐loop drilling systems, closed‐top tanks with secondary containment for all liquids, covered bins with secondary containment for all solids and sludges, and continuous inspection and monitoring. Training hands‐on field workers (operator workers, vendors, subcontractors, etc.) and on‐site supervisors and managers on the proper handling, use, storage, and disposal of all hazardous materials minimizes the chance for spillage or leaks. Regular worker training and cleanup drills using spill response equipment prepare workers for an emergency.
All operators should be transparent and offer full disclosure of all chemicals on‐site, which will allow for testing of these compounds. Local and state officials need high environmental and operational standards and regulations and the ability to regularly inspect and monitor operators during drilling and production activities. Agencies need to understand predrilling environmental impact studies. With these studies, the agencies could assess the most vulnerable water sources by collecting detailed water samples before drilling. The samples from water supply wells and surface waters within 2500 ft (762 m), along with locating of all abandoned and historic wells and other subsurface conduits that might enable these features to provide preferred flow paths for surface or shallow subsurface contaminants into local water supplies, are background data. The agencies need continued testing during the drilling and production to verify conditions have or haven’t changed. Having a third‐party professional environmental scientist, geologist, or engineer collect and document site conditions and collect representative water, soil, or air samples before operations begin reduces potential conflicts and unnecessary controversy. The condition of nearby water supply wells should be documented using a video camera, logging, and water chemistry testing. After the fact, advanced isotope geochemistry using ratios of various elements can provide information to delineate different sources of contamination. As a precaution, regulatory agencies should require stringent setbacks for oil and gas wells, pits, tanks, etc. from nearby water supply wells and surface waters and neighbors.
Depending on subsurface conditions and materials used in well construction, too many rural wells are past their design lifespan of 50 years. Normal well deterioration is common and may include failed cement seals, well casing collapse or corrosion, naturally occurring microbial growth, iron precipitation, scaling, and pitting. These factors, which likely predated drilling operations, can, nonetheless, greatly impact the quality and quantity of local groundwater supplies.
Hazardous Materials and Waste Violation Issues
A variety of imported hazardous materials and produced hazardous compounds create a need for the proper storage, use, handling, collection, transportation, and disposal as hazardous waste. The handling and disposal of wastes requires written documentation of worker training and proper profiling and manifesting procedures. Violations of hazardous waste regulations due to an unauthorized release such as a spill or illegal disposal should be identified by regulatory agencies with public notification and disclosure as follows:
- The extent of harm caused by the hazardous waste violation.
- The persistence of the violation.
- The pervasiveness of the violation.
- The number of prior violations by the same violator.
Mitigation Measures for Hazardous Materials Issues Impacts – Train workers on the proper handling, use, storage, transportation, and disposal of exempt wastes and hazardous wastes. Develop hazardous materials management plans, injury illness prevention plans, spill prevention plans, and other programs to address possible releases of hazardous compounds and procedures to cleanup leaks and spills and the contacts for local, state, and federal regulatory agencies. Conduct monthly spill training and perform regular drills to train workers in spill response. Use secondary containment for all hazardous compounds on‐site. Cleanup any spills or leaks promptly and document and report the spills, as needed. Stock and label contaminant spill response kits, fire extinguishers, and other chemical release response products. Containerize wastes frequently and document hazardous material training and activities. Develop a waste management and minimization plan to encourage recycling, and minimize the use of hazardous materials. Encourage the use of green chemicals on‐site, as well as green or safe chemicals in the hydraulic fracture stimulation process.
Quality of Life: Scenic Views, Natural Soundscapes and Dark and Clear Night Skies – Flaring of unusable methane from the Bakken oil production in North Dakota disrupts the serenity of the night skies (Figure 5.8). Due to a variety of economic realities and demands on operators in the Williston Basin, including debt obligations, drilling and production requirements to maintain the lease, legal requirements, investor demands for production cash flow, and rapid crude oil production are the norms. Natural gas reserves in the right location at the right time are a valuable commodity. The crude oil is produced and sold immediately to address the economic realities listed above. Since there are no pipelines to carry the methane to market, the coproduced methane is flared as a waste product, increasing GHG and lighting the night sky in a brightness that can be seen from space.

Figure 5.8 In this satellite image of North America at night, natural gas flares from the Bakken Formation in Williston Basin in North Dakota can be seen from space. The night sky, once dark and bright with visible stars, has been obscured by oil production activities (NASA).
Scenic views and natural soundscapes are likewise impacted by drilling and production activities. Not only are the obvious areas near drilling pads, production facilities, and pipelines affected, but some environments and communities that are located hundreds or even thousands of miles away from the nearest hydraulic fracturing operations are also potentially impacted: areas with mines for fracking‐ and drilling‐related resources; mines for proppant sands or bentonite used in drilling muds; and resource processing plants, transportation hubs, refineries processing the crude oils, natural gas processing plants, bulk storage terminals and ports, and disposal facilities. Public lands, both state and federal (BLM, US DOE, military bases, national parks), may be impacted by being the site of, or by being nearby, oil or gas production.
Drilling and mining can occur 24/7, and without significant mitigation measures, these activities can greatly impact the quality of life for residents living or working nearby. Environmental concerns about oil and gas fields are amplified in pristine highly visible sensitive areas such as wetland areas (Figure 5.9).
Figure 5.9 Photograph showing an active oil field situated within the Bolsa Chica wetland area in southern California.
Source: Image from Stephen Testa.
Mitigation Measures for Quality of Life Issues Impacts – Use a computer simulation of the development and visualization techniques to evaluate potential visual impacts early in the permitting process. Keep facilities such as drill pads, tank storage areas, pipelines, and other facilities off the highland features and off skylines that are highly visible. Conceal facilities into the surrounding environment using trees and vegetation as a visual barrier. Use paints and netting on equipment to blend in with the character of the area. To reduce reflection and glare, use nonreflective coatings and paints. Avoid using reflective silver‐colored galvanized pipes and metallic coated surfaces on‐site. Bury wires and cables if possible. Use security lighting with motion detectors, to limit nighttime lighting (TEEIC 2017). Cessation of flaring is also a mitigation measure.
Aesthetic Issues
Aesthetic concerns include those factors that affect our senses in an unfavorable manner. Visual impacts such as the sight of an oil rig located in what is considered a pristine wilderness or wetland area, or offshore rigs on the distant horizon, can have an unfavorable appeal to some individuals. Visual evidence of spillage or leakage of petroleum or other compounds at an oil or gas field includes stained or discolored soil, dead vegetation, and petroleum sheen on water. Even produced waters with high salinity can kill vegetation. Other concerns such as dust, odorous fumes, noise, traffic, and the potential for fires, explosions, and spills can also generate unfavorable aesthetic value, especially in urbanized areas.
Mitigation Measures for Aesthetic Issues Impacts – Clean up spills and leaks immediately and contain wastes to limit odors. Replant native species in areas where a chemical release occurred.
Urban Use Issues
In what may have started out affecting mostly rural communities, eventually, urban centers and the suburbs will be affected. Prospective US shale basins underlie Fort Worth, Texas, Pittsburgh, Pennsylvania, Los Angeles, California, and Denver, Colorado (Table 5.14). Around the world, other cities overlying shale basins include Paris, France, Copenhagen, Denmark and Warsaw, Poland, Shanghai, China, and Perth, Australia (Table 5.15). As oil and gas production in cities becomes more common place, efforts to fit into the urban setting will increase. Urban settings affect a significantly larger population, requiring larger efforts to accomplish production activities. In one of the most prolific oil‐producing basins in the world, the Los Angeles Basin uses Hollywood‐style disguises to completely camouflage the active oil drilling and production operations. These profitable operations will be the model for urban and suburban fracking. Within view of the mainland, the drilling islands in Long Beach, California, harbor appear to be exotic Caribbean Islands (Figure 5.10). What looks like a set of exclusive condo buildings, palm trees, and a large waterfalls and sculptures are actually four man‐made drilling islands off the Long Beach coast. The THUMS Islands (Texaco, Humble, Union, Mobil, and Shell) have about 1100 active wells. Urban production at the Packard drill site is next to residences (Figure 5.11) and will likely become more common as operators tap into unconventional oil and gas resources beneath urban areas. Another urban drilling pad is located adjacent to Beverly Center in Los Angeles (Figure 5.12).
Table 5.14 Urban areas in the United States situated over unconventional resources.
| City | State | Basin | Target | Age |
| Akron | Ohio | Appalachian Basin | Devonian (Ohio) | Ordovician |
| Bakersfield | California | San Joaquin Basin | Monterey‐Temblor Formation | Miocene–Oligocene |
| Baton Rouge | Louisiana | Texas–Louisiana–Mississippi Salt Basin | Tuscaloosa | Cretaceous |
| Birmingham | Alabama | Valley and Ridge Basin | Conasauga | Cambrian |
| Bismarck | North Dakota | Williston | Bakken Formation | Devonian‐Mississippian |
| Buffalo | New York | Appalachian Basin | Utica | Ordovician |
| Cleveland | Ohio | Appalachian Basin | Devonian (Ohio) | Ordovician |
| Columbus | Ohio | Appalachian Basin | Devonian (Ohio) | Ordovician |
| Dallas | Texas | Fort Worth Basin | Barnett Shale | Mississippian |
| Denver | Colorado | Denver Basin | Niobrara Shale | Cretaceous |
| Fort Worth | Texas | Fort Worth Basin | Barnett Shale | Mississippian |
| Lansing | Michigan | Michigan Basin | Antrim Shale | Devonian |
| Little Rock | Arkansas | Arkoma Basin | Fayetteville Shale | Mississippian |
| Los Angeles | California | Los Angeles Basin | Monterey Formation | Miocene |
| Oklahoma City | Oklahoma | Anadarko Basin | Woodford Shale | Devonian |
| Pittsburgh | Pennsylvania | Appalachian Basin | Marcellus Shale/Utica Shale | Devonian/Ordovician |
| Rochester | New York | Appalachian Basin | Utica | Ordovician |
| Santa Barbara | California | Ventura Basin | Monterey Formation | Miocene |
| Santa Maria | California | Santa Maria Basin | Monterey Formation | Miocene |
| Shreveport | Louisiana | Texas–Louisiana–Mississippi Salt Basin | Haynesville‐Bossier Shale | Jurassic |
| Syracuse | New York | Appalachian Basin | Utica | Ordovician |
| Wheeling | West Virginia | Appalachian Basin | Marcellus Shale | Devonian |
Table 5.15 Urban areas around the world situated over unconventional resources (non‐US).
| City | Country | Basin | Target | Age |
| Bucharest | Romania | Moesian Platform | Lower Silurian Shale; Etropole Shale | Lower Silurian; Lower Jurassic |
| Chengdu | China | Sichuan Basin | Qiongzhusi Shale; Longmaxi Shale; Permian Shale | Lower Cambrian; Lower Silurian; Permian |
| Chongqing | China | Sichuan Basin | Qiongzhusi Shale; Longmaxi Shale; Permian Shale | Lower Cambrian; Lower Silurian; Permian |
| Copenhagen | Denmark | Scandinavia Region Basin | Alum Shale | Cambro‐Ordovician |
| East London | South Africa | Karoo Basin | Prince Albert Shale; Whitehill Shale; Collingham Shale | Lower Permian |
| Gdansk | Poland | Baltic/Warsaw Trough | Llandovery Shale | Lower Silurian – Ordovician‐ Upper Cambrian |
| Guiyang | China | South China/Yangtze Platform | Lower Cambrian Shale; Lower Silurian Shale | Lower Cambrian; Lower Silurian |
| Hanover | Germany | Lower Saxony Basin | Posidonia Shale; Wealden Shale | Lower Jurassic; Lower Cretaceous |
| Hong Kong | China | South China/Yangtze Platform | Lower Cambrian Shale; Lower Silurian Shale | Lower Cambrian; Lower Silurian |
| Hyderbad | Pakistan | Southern Indus Basin | Sembar Shale; Ranikot Formation | Lower Cretaceous; Paleocene |
| Karachi | Pakistan | Southern Indus Basin | Sembar Shale; Ranikot Formation | Lower Cretaceous; Paleocene |
| Marseille | France | Southeast Basin | Lias Shale | Lower Jurassic |
| Montpellier | France | Southeast Basin | Lias Shale | Lower Jurassic |
| Paris | France | Paris Basin | Lias Shale; Permian‐Carboniferous Shales | Lower Jurassic; Permian‐Carboniferous Shales |
| Perth | Australia | Perth Basin | Carynginia – Kockatea Shales | Upper Permian – Lower Triassic |
| Shanghai | China | South China/Yangtze Platform | Lower Cambrian Shale; Lower Silurian Shale | Lower Cambrian; Lower Silurian |
| Stockholm | Sweden | Scandinavia Region Basin | Alum Shale | Cambro‐Ordovician |
| The Hague | The Netherlands | West Netherlands Basin | Epen Shale; Geverik Member; Posidonia Shale | Upper Carboniferous; Lower Jurassic |
| Urumqi | China | Junggar Basin | Pingdiquan/Lucaogou; Triassic Shale | Permian; Triassic |
| Warsaw | Poland | Baltic/Warsaw Trough | Llandovery Shale | Lower Silurian – Ordovician‐ Upper Cambrian |
| Wuhan | China | Jianghan Basin | Niutitang/Shuijintuo Shale; Longmaxi Shale; Qixia/Maokou Shale | Lower Cambrian; Lower Silurian; Permian |
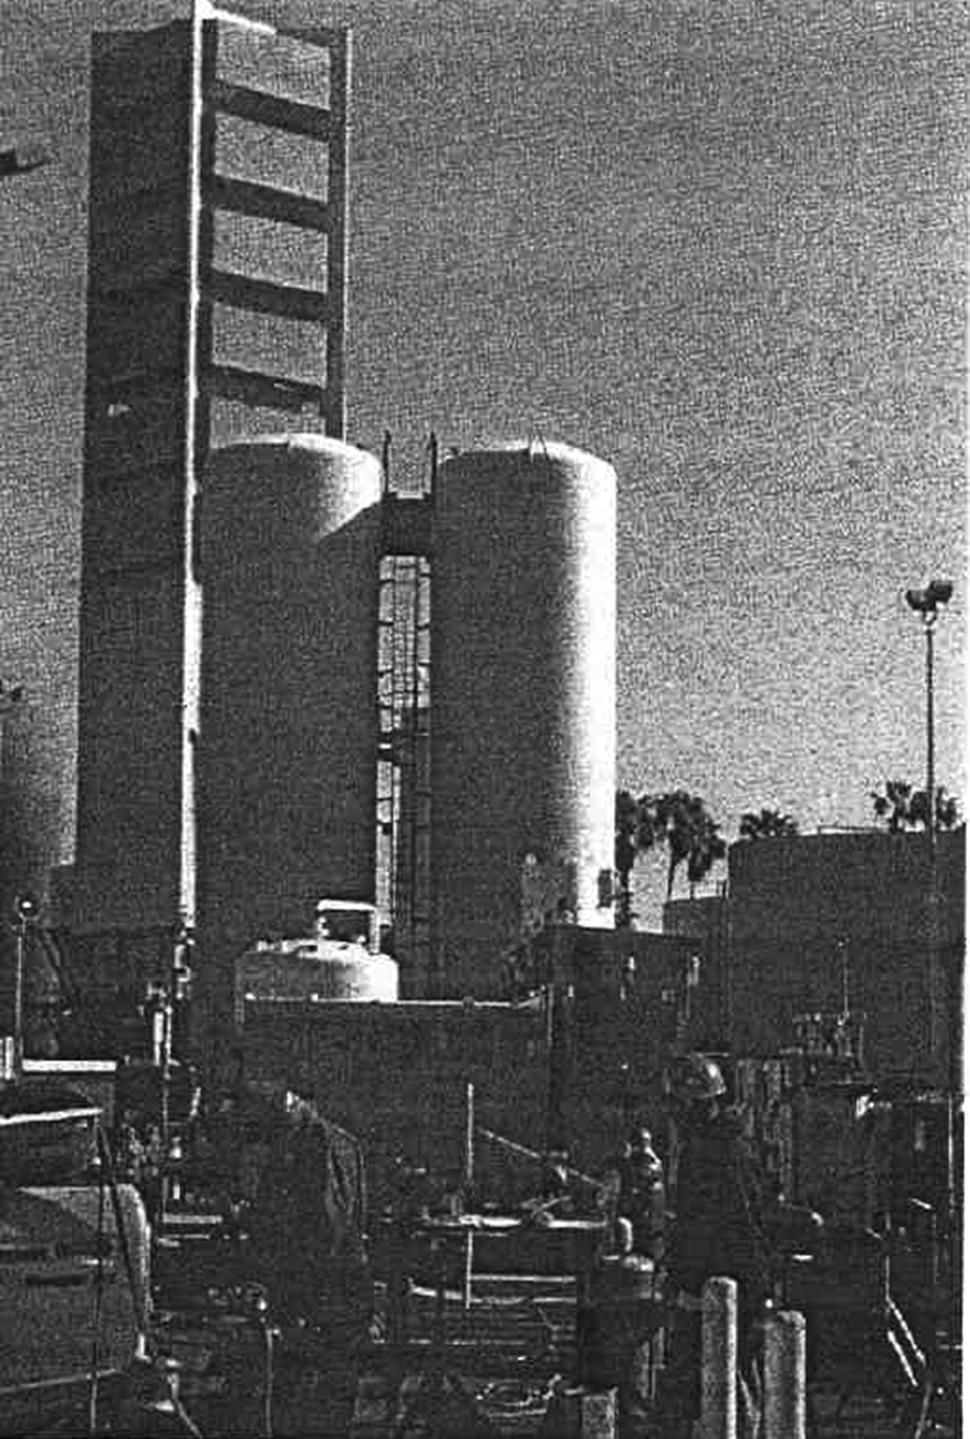
Figure 5.10 A modern drilling operation has been operating for decades camouflaged as a high‐rise condo building with palm trees in the background in the Long Beach, California, harbor.
Source: Image from Stephen Testa.

Figure 5.11 Urban drilling at the Packard drill site on Pico Boulevard in West Los Angeles, California, is at the edge of a residential area.
Source: Image from James Jacobs.
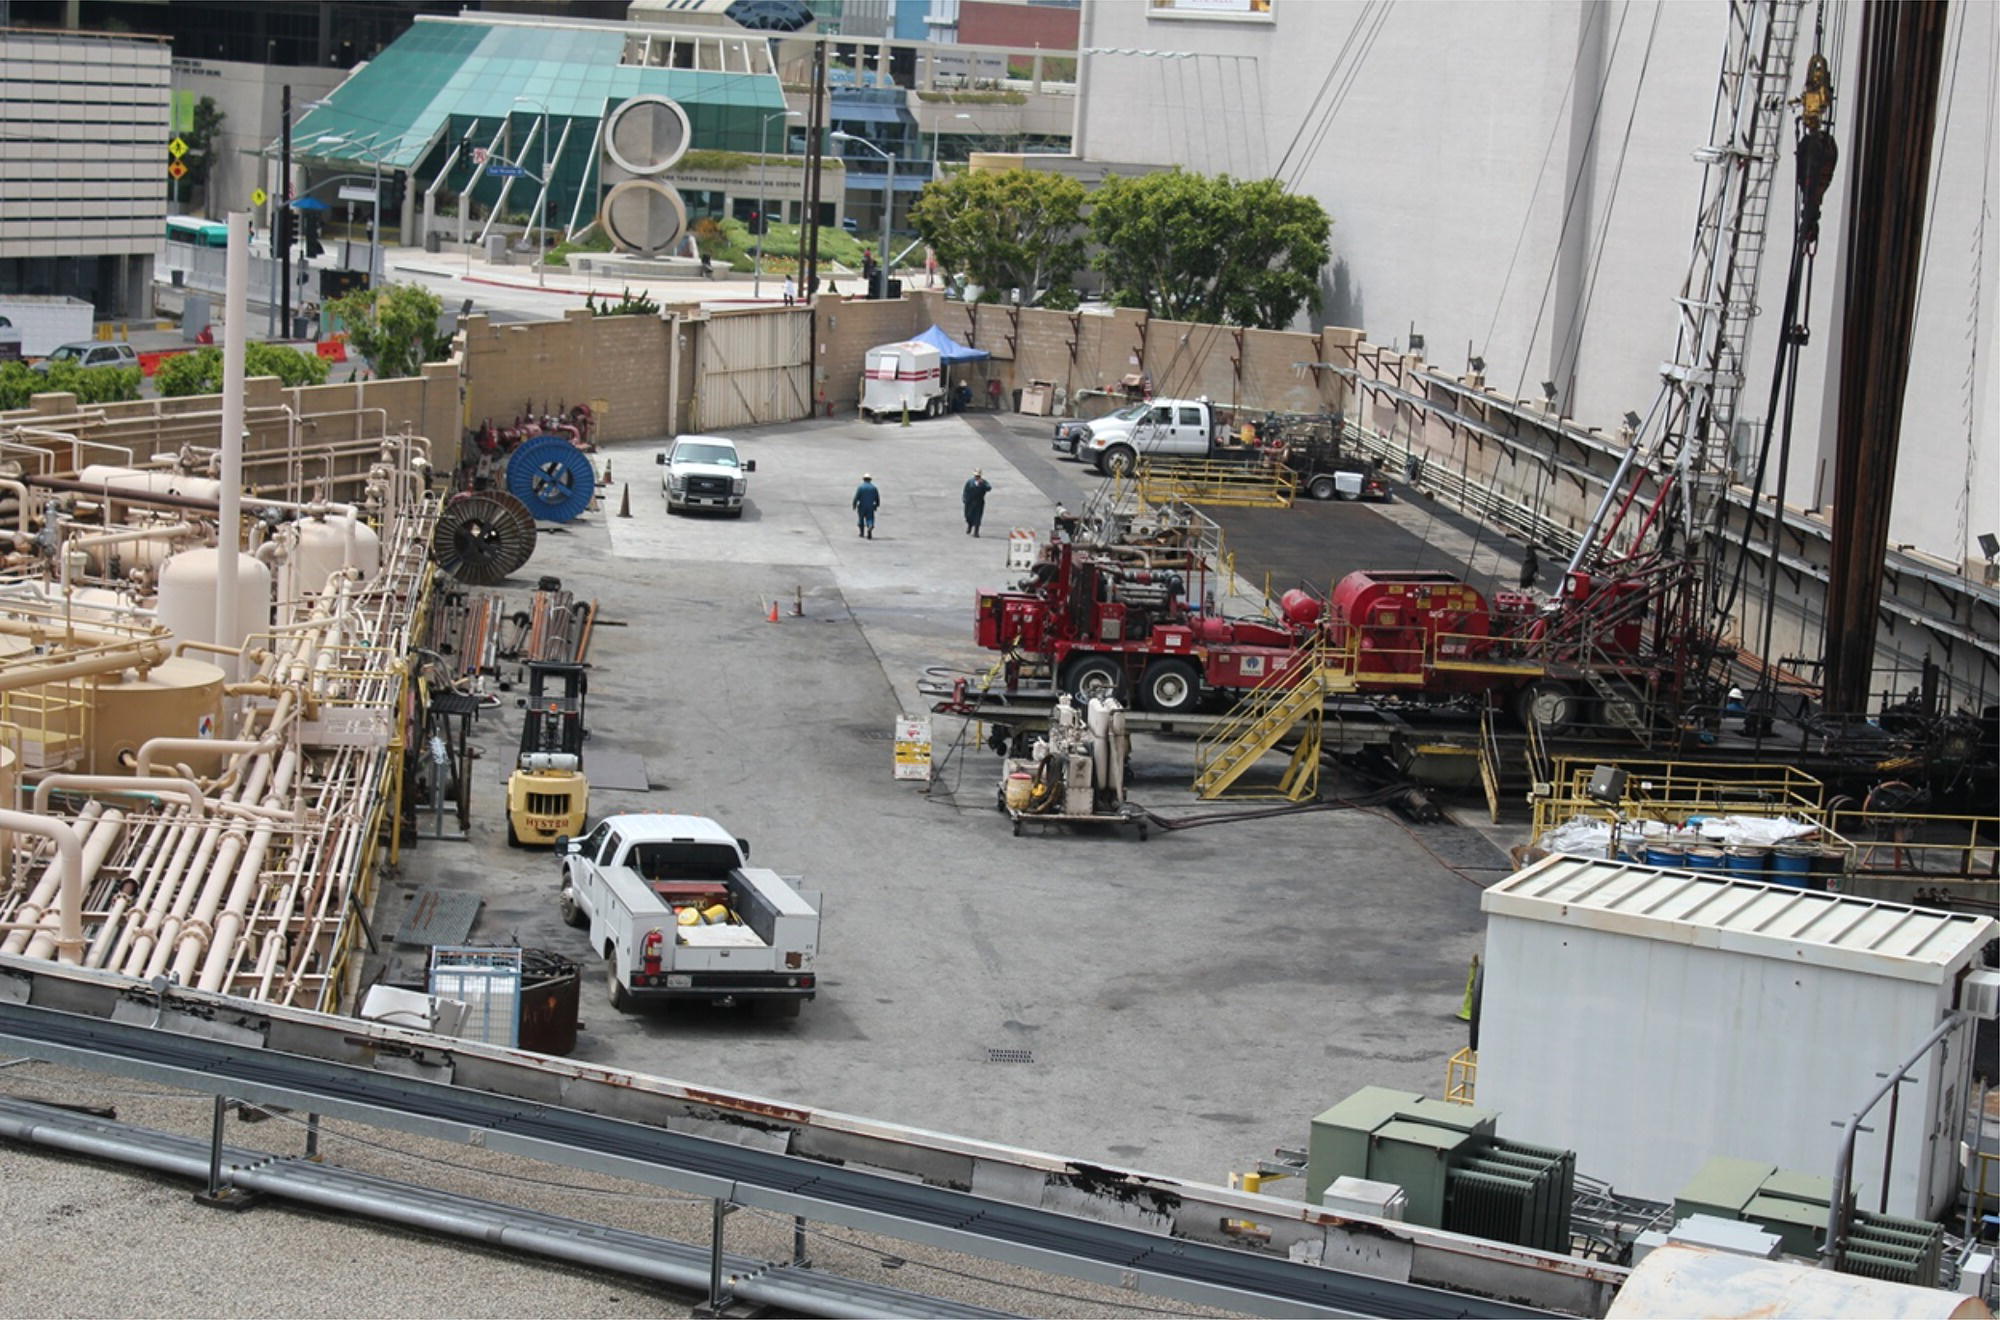
Figure 5.12 An urban drilling pad in the San Vicente oil field in the Los Angeles Basin is in Beverly Hills.
Source: Image from James Jacobs.
Water sources in rural areas tend to be decentralized and consist of individual wells or small public water supply systems, with reservoirs, lakes, and rivers, when surface resources and storage are available. In most urban centers, municipal water supplies are usually centralized and include reservoirs, lakes and rivers, and groundwater well fields. Large urban areas generally do not use individual residential water supply wells.
Mitigation Measures for Urban Use Issues Impacts – These resources should be included in the environmental impact analyses before the commencement of activities, and mitigation or best management practices should be applied, where appropriate. Examples might include capturing the methane for reinjection or sale, instead of flaring, specifying low‐noise equipment, installing sound proofing in certain areas of the operation, and developing field procedures to minimize noise. The complete camouflaging and soundproofing of drilling and production allow compact operations in tight urban settings.
Seismicity Issues – Injection of large volumes of fluids during hydraulic fracturing operations occurs; however the impacts are uncertain. The injection of waste fluids from oil and gas operations into large‐diameter injection class II injection wells (Figure 5.13) can cause low‐magnitude tremors. By 2014, Oklahoma had 528 magnitude 3.0 and greater earthquakes, which was 300 times the number of earthquakes as recorded in 2008. Additional information about seismicity is included in Chapter 6.
Figure 5.13 Schematic illustrating a typical injection well.
Mitigation Measures for Seismicity Issues Impacts – More recycling of drilling and backflow water would reduce the need for disposal and associated waste injections. Monitoring microseismicity in fracking areas and more importantly waste fluid disposal areas provides information for continued evaluation, discussion, and mitigation, if needed. Modeling earthquake rate changes and the analysis of earthquake seismicity data by the USGS (Llenos and Michael 2013; USGS 2014) suggest that the significant increase in earth movements over the past few years is likely triggered by waste liquids, such as flowback from hydraulic fracturing operations and coproduced fluids, being injected under high pressure into deep geologic formations.
Health and Safety Issues – Workers may be exposed to hazardous compounds at drilling and production facilities, most notably, dust with high levels of respirable crystalline silica during the fracking operations (OSHA 2012).
Mitigation Measures for Health and Safety Issues Impacts – NIOSH (Esswein et al. 2013) also recommended operators to control exposure to silica dust and evaluate each of their operations to determine the potential for worker exposure and implement procedures, monitoring, personal protective equipment, and controls, as needed, to reduce exposure and protect workers. Develop a long‐term health and medical monitoring program for workers exposed to hazardous materials (as directed in Code of Federal Regulations, CFR 1910.120) with annual medical physicals and fit testing of respirators. Operators should provide adequate public notice and instructional materials on all health and safety issues available at local schools and at public meetings to address workers and residents living or working near the oil and gas operations. In addition, operators can support community health screenings to address potential health and safety impacts related to drilling, hydraulic fracturing, and production activities. Operators can also support local libraries financially and develop information about the oil and gas industry (TEEIC 2017). Exposure to crude oil and specific petroleum hydrocarbon compounds is summarized in tables in Appendix G.
Socioeconomic and Infrastructure Issues – Rapid changes in local income, population density, and traffic can create social problems. Boom towns create rapid increases in population. Accelerated increases in population and their use of shared infrastructure such as roads, bridges, hospitals, emergency services, schools, water treatment, etc., push infrastructure to beyond design capacity. Roads designed for occasional use by sedans and small pickup trucks may now be used regularly by 18‐wheel trucks.
Mitigation Measures of Socioeconomic and Infrastructure Issues Impacts – Evaluate socioeconomic and infrastructure issues in environmental impact assessments to predict problem areas prior to drilling and production. Develop local strategies to address these challenges. Educating and protecting workers requires awareness training about the risks of drilling activities, and exposure to hazardous wastes and hydraulic fracturing additive chemicals. Identifying the potential hazards from exposure to these chemicals is important (Table 5.16). A general worker safety checklist provides an overview of the standards and mitigation strategies (see Table 5.17, Appendix I).
Table 5.16 Potential hazards from exposure to selected hydraulic fracturing chemicals and selected chemicals associated with crude oil, combustion and fuels.
Source: For hydraulic fracturing chemicals: OSHA (2017). For more information, see the Material Safety Data Sheet, the Agency for Toxic Substances and Disease Registry (ATSDR), or visit fracfocus.org/chemical‐use/what‐chemicals‐are‐used. Source for other chemicals (crude oil, gasoline, and products of combustion): OSHA (2012).
| Selected hydraulic fracturing chemicals | ||
| Product function | Chemicals used | Potential hazards from exposure to chemicals |
| Proppant | Sand, manufactured products, ceramics, sintered bauxite | Silicosis (sand), mechanical irritation of eyes, skin, nose, and throat |
| Acids | Hydrochloric acid, hydrofluoric acid | Corrosive, irritant to skin, eyes lungs |
| pH Adjustment | Acids, bases | Chemical burns, corrosive, irritant to skin, eyes, and lungs |
| Biocides | Aldehydes, quaternary ammonia compounds | Toxic by direct contact or inhalation. May cause irritation or allergic reactions |
| Reducers | Petroleum distillates, methanol, ethylene glycol | Flammable. Some hydrocarbons are suspected carcinogens. May be toxic by ingestion |
| Gelling agents, polymers | Guar gum, polysaccharides, polyacrylamides | May cause irritation by direct contact |
| Cross linkers | Sodium tetraborate and other borate salts, zirconium complexes | Toxic by direct contact or inhalation |
| Breakers | Magnesium peroxide, calcium peroxide, magnesium oxide, ammonium persulfate | May cause irritation by direct contact, ingestion or inhalation. Peroxides are oxidizers, that may cause a fire or release oxygen that intensifies a fire |
| Iron control agents | Citric acid, acetic acid, thioglycolic acid | Corrosive, irritant to skin, eyes, and lungs |
| Scale inhibitor | Copolymer of acrylamide and sodium acrylate, sodium polycarboxylate, phosphonic acid, salt | Irritant to skin, eyes, and lungs |
| Clay stabilizers | Choline chloride, tetramethyl ammonium chloride, sodium chloride | Hazardous to eyes, skin, lungs, and by ingestion |
| Corrosion control | Formic acid, acetaldehyde | Irritant to skin, eyes, and lungs |
| Surfactants | Lauryl sulfate, alcohols, 2‐butoxyethanol | May cause irritation by direct contact, ingestion, or inhalation |
| Selected chemicals associated with crude oil, combustion, and fuels | ||
| Product | Chemicals | Potential hazards from exposure to chemicals |
| Crude oil, gasoline | Benzene (crude oils high in BTEX, benzene, toluene, ethylbenzene, and xylene) | Irritation to eyes, skin, and respiratory system; dizziness; rapid heart rate; headaches; tremors; confusion; unconsciousness; anemia; cancer |
| Crude oil and gasoline combustion | Benzo(a)pyrene (a polycyclic aromatic hydrocarbon reproductive [see below], formed when oil or gasoline burns) | Irritation to eyes and skin, cancer, possible effects |
| Product of combustion | Carbon dioxide (inerting atmosphere, by‐product of combustion) | Dizziness, headaches, elevated blood pressure, rapid heart rate, loss of consciousness asphyxiation, coma |
| Product of combustion | Carbon monoxide (by‐product of combustion) irritation to eyes, skin, and respiratory system | Dizziness, confusion, headaches, nausea, weakness, loss of consciousness, asphyxiation, coma |
| Crude oil, gasoline | Ethyl benzene (high in gasoline, also in some crude oils) | Irritation to eyes, skin, and respiratory system; loss of consciousness; asphyxiation; nervous system effects |
| Crude oil | Hydrogen sulfide (oils high in sulfur, decaying plants, and animals) | Irritation to eyes, skin, and respiratory system; dizziness; drowsiness; cough; headaches; nervous system effects |
| Crude oil | Polycyclic aromatic hydrocarbons (PAHs) (occur in crude oil and formed during burning of oil) | Irritation to eyes and skin, cancer, possible reproductive effects, immune system effects |
| Product of combustion | Sulfuric acid (by‐product of combustion of sour petroleum product) | Irritation to eyes, skin, teeth, and upper respiratory system; severe tissue burns; cancer |
| Crude oil | Toluene (high BTEX crude oils) | Irritation to eyes, skin, respiratory system; fatigue; confusion; dizziness; headaches; memory loss; nausea; nervous system, liver, and kidney effects |
| Crude oil | Xylenes (high BTEX crude oils) | Irritation to eyes, skin, and respiratory system; dizziness; confusion; change in sense of balance; nervous system gastrointestinal system, liver, kidney, and blood effects |
Prepare for the likely influx of construction, operations, and maintenance workers from outside the area and understand, anticipate, and plan for the range of possible negative changes in local social and community life that could occur as a result of large socioeconomic changes. Socioeconomic studies should be developed to carefully monitor indicators of social disruption, such as increased crime, alcoholism, drug abuse, gambling, prostitution, and a rise in mental health needs. If social disruption occurs, public welfare and outreach combined with local vocational training programs could be developed to address these needs. Existing infrastructure, including roads, schools, emergency response services, and water and wastewater treatment services, may not be adequate for existing population and the major influx of new workers and their families (TEEIC 2017). The various impact reports and mitigation plans provide a description of the affected resources and methods to address hazards (see Table 5.18, Appendix I). A site‐specific safety and emergency planning and responses checklist covers many common planning and safety topics (see Table 5.19, Appendix I). A checklist of sources of historic and current information has been developed to assist in developing a better understanding of the site history, possible chemical use, and potential impacts (see Table 5.20, Appendix I). Many of the challenges for unconventional and conventional oil and gas operations provide opportunities for those with innovative thinking (Table 5.21).
Table 5.21 Summary of main challenges and opportunities of HVHF.
| Main challenges | Opportunities |
| Water resource availability | Improved water recycling technologies and conservation measures |
| Leaks and spills of toxic chemicals at the surface | Increase worker training, better spill response, reduce toxicity of chemicals, active sensing for spills and leaks |
| Impacts of industrial mineral mining such as sand, gravel, bentonite, and other materials used in the hydraulic fracturing process | Design operations to minimize footprint and ecological damage, recycle materials, as possible |
| Surface water quality degradation from waste fluid disposal | Recycle waste waters, use regulations and policies to encourage water recycling, create baseline database of local surface water quality prior to drilling |
| Groundwater quality degradation | Improved groundwater monitoring, improve chemical and fluid handling, locate all subsurface conduits in area prior to drilling (old water, oil and gas wells, utility trenches, etc.), create baseline database of local groundwater quality prior to drilling |
| Induced seismicity from the injection of waste fluids into deep disposal wells | Reduce wastes by recycling waters, removing valuable salts and minerals |
| Challenges for all oil and gas operations | |
| Reduced air quality | Active monitoring and rapid repair for fugitive gas leaks, improved dust control, create baseline database of local air quality prior to drilling or mining |
| Additional noise | Electric motors for noise reduction, equipment shrouds and insulation for noise abatement. Design drill pads in areas where noise propagation is minimal |
| Night sky pollution | Lighting designs that focus light toward activity, minimize lighting footprint, design drill pads in areas where light propagation is minimal |
| Landscape changes such as fragmentation | Minimize operational footprint |
| Disruption to wildlife corridors and habitats | Minimize operational footprint |
| Social and economic disruption | Public meetings, community education and programs for job training |
| Carbon emissions from field operations and the consumption of fossil fuels | Encourage alternate energy sources, capture carbon emissions, use electric motors and vehicles |
5.8 Summary
Controlled horizontal drilling combined with HVHF stimulation with specialized chemical additives are advanced oil and gas extraction technologies. The process and activities have been controversial due to local socioeconomic and environmental changes that can occur in oil‐ or gas‐producing areas. Some view the industrial technologies favorably and see that the offer of plentiful supplies of lower cost oil and natural gas come with benefits of economic growth, high paying jobs, and energy security. Others in the community who do not reap any economic benefits or disagree with the development of oil and gas resources may view the same technologies and same events differently. Critics see the potential environmental impacts, possible degraded air and water resources, and socioeconomic problems. They view changes in which drilling‐related vehicles and equipment tax local infrastructure beyond the original engineered designs and, in the process, lowers the overall quality of life for those living or working near the oil and gas fields.
Mitigation measures and best management practices, if designed properly and monitored carefully, go a long way to addressing many of the possible impacts and safety issues. A variety of categories of hazardous compounds are imported or produced on drilling and production facilities. These compounds must be accurately inventoried, stored, used, and disposed of with proper procedures and documentation. Operator transparency and disclosure of chemical additives to the community also helps to reduce conflicts over perceived chemical exposures by the public. Finding the least toxic imported compounds and using green chemistry to minimize hazards, when possible, lowers the environmental risks and reduces potential worker exposure and ecosystem damage. Appropriate worker safety training, public communication, and full disclosure about the hazardous compounds are important aspects of minimizing controversy and gaining community support for drilling, hydraulic fracturing, and producing operations.
5.9 Exercises
- 5.1 Take one of the five main categories of resources and explain how these might be degraded during an oil and gas operation.
- 5.2 With the answer from Question 5.1, describe the mitigation steps to prevent or minimize impacts.
- 5.3 Explain how historic conventional oil or gas fields without a responsible operator in the same area of nonconventional gas resource development might cause challenges for current shale gas operators.
- 5.4 How do poorly cemented annular spaces in oil, gas, or water wells act as possible conduits to shallow groundwater‐bearing zones? Please draw a diagram showing the concept.
- 5.5 Explain three examples of possible impacts, direct and indirect, affecting factors from Table 5.3 for one phase of activity.
- 5.6 Provide a possible mitigation for the possible impacts described in Question 5.6.
- 5.7 Review Tables 5.12 and 5.13 and find identify the nearest large urban area.
- 5.8 Describe some of the impacts (Question 5.7) that might occur in the nearest urban area.
- 5.9 Provide some ideas on mitigation measures of water impacts (Question 5.9).
- 5.10 Oil and gas E&P are industrial processes. Can all the potential impacts be mitigated? Explain your answer.
References
- Abdalla, C. and Drohan, J. (2010). Water Withdrawals for Development of Marcellus Shale Gas in Pennsylvania. Penn State Extension publication. 12 pp.
- Abdalla, C., Drohan, J., and Becker, J. (2011). River Basin Approaches to Water Management in the Mid‐Atlantic States. Penn State Extension and Mid‐Atlantic Water Program publication. 28 pp.
- Abdalla, C., Drohan, J., Rahm, B. et al. (2012). Water's Journey Through the Shale Gas Drilling and Production Processes in the Mid‐Atlantic Region. Penn State and Mid‐Atlantic Water Program publication, 10 pp.
- ALL Consulting, LLC (2012). The Modern Practices of Hydraulic Fracturing: A Focus on Canadian Resources, Tulsa, OK, USA, Revised November, 228 p. http://www.all‐llc.com/publicdownloads/ModernPracticesHFCanadianResources.pdf (accessed 20 October 2018).
- Bullin, K. and Krouskop, P. (2008). Composition variety processing plans for US Shale Gas. Presented at Annual Forum, Gas Processors Association, Houston, TX (7 October), 9 p.
- California Department of Conservation (CDOC) (2015). Environmental impact report analysis of oil and gas well stimulation treatments in California, State Clearinghouse No. 2013112046, Revised Draft Environmental Impact Report, June, Sacramento, CA; Vol III of III, Chapter 11 through Chapter 19, p. 1392.
- Coleman, J. (2017). Fracking Blowout in Texas Causes Huge Dead Zone (PHOTOS), Huffington Post, Updated Dec 6, original article: 6/11/15. https://www.huffingtonpost.com/jesse‐coleman/fracking‐blowout‐in‐texas_b_7561868.html (accessed 20 October 2018).
- Eger, C.K. and Vargo, J.S. (1989). Prevention, ground water contamination at the Martha Oil Field, Lawrence and Johnson Counties, Kentucky. In: Environmental Concerns in the Petroleum Industry (ed. S.M. Testa), 83–105. Palm Springs, CA: Pacific Section of the American Association of Petroleum Geologists.
- Ellsworth, W.L. (2013). Injection‐induced earthquakes. Science 341 (6142): 543–546.
- Esswein, E.J., Breitenstein, M., Snawder, J. et al. (2013). Occupational exposures to respirable crystalline silica during hydraulic fracturing. Journal of Occupational and Environmental Hygiene 10 (7): 347–356.
- Howarth, R.W., Santoro, R., and Ingraffea, A. (2011). Methane and the greenhouse gas footprint of natural gas from shale formations. Climatic Change Letters 106: 679–690.
- Howarth, R.W., Santoro, R., and Ingraffea, A. (2012a). Venting and leaking of methane from shale gas development: response to Cathles et al., climatic change. Released at press conference 19 January 2012; http://216.250.243.12/shalegasghgreport.html (accessed 17 March 2017).
- Howarth R.W., Santoro R., Ingraffea A., Phillips N., and Townsend‐Small, A., (2012b). Methane Emissions from Natural Gas Systems, Background Paper Prepared for the National Climate Assessment; Reference Number 2011‐0003; 25 February, 8 p. http://www.eeb.cornell.edu/howarth/Howarth%20et%20al.%20‐‐%20National%20Climate%20assessment.pdf (accessed 20 October 2018).
- Llenos, A.L. and Michael, A.J. (2013). Modeling earthquake rate changes in Oklahoma and Arkansas: possible signatures of induced seismicity. Bulletin of the Seismological Society of America 103: 2850–2861.
- Metz, P.A. and Brendle, D.L. (1996). Potential for Water Quality Degradation of Interconnected Aquifers in West‐Central Florida, Water‐Resources Investigations Report, vol. 96–4030. Denver, CO: U.S. Geological Survey, 54 p.
- National Energy Technology Laboratory (NETL) (2014). Office of Fossil Energy, U.S. Department of Energy, Environmental Impacts of Unconventional Natural Gas Development and Production, May 29, DOE/NETL‐2014/1651; p. 139. https://www.netl.doe.gov/File%20Library/Research/Oil‐Gas/publications/NG_Literature_Review3_Post.pdf (accessed 20 October 2018).
- Occupational Safety Heath Administration (OSHA) (2012). Training Marine Oil Spill Response Workers under OSHA’s Hazardous Waste Operations and Emergency Response Standard, OSHA, vol. 3172. Washington, DC: U.S. Department of Labor.
- Occupational Safety Heath Administration (OSHA) (2017). Oil and gas well drilling and servicing eTool. US Department of Labor; https://www.osha.gov/SLTC/etools/oilandgas/index.html (accessed 17 March 2017).
- Oswald, R. and Bamberger, M. (2012). Impacts of gas drilling on human and animal health. New Solutions 22: 51–77.
- Pruder, M.G., and Veil, J.A., 2006, Offsite Commercial Disposal of Oil and Gas Exploration and Production Waste: Availability, Options, and Costs, for U.S. Dept. of Energy, by the Envt. Sci. Division, Argonne National Laboratory, August, 148 p. https://publications.anl.gov/anlpubs/2006/09/57244.pdf (accessed 20 October 2018).
- Reuters (2014). UPDATE 2‐Oil well in North Dakota out of control, leaking, February 14. http://www.reuters.com/article/2014/02/14/energy‐crude‐blowout‐idUSL2N0LJ15820140214 (accessed 17 March 2017).
- Testa, S.M. (1997). The Reuse and Recycling of Contaminated Soil. Boca Raton, FL: CRC Press 288 p.
- The E&P Forum (1993). Exploration and Production (E&P) Waste Management Guidelines. Report No. 2.58/196, September, London, 45 p. https://deq.louisiana.gov/assets/docs/Land/EP‐waste‐mngt‐gdlns‐1993.pdf (accessed 20 October 2018).
- Tribal Energy and Environmental Information Clearinghouse (TEEIC) (2017). Energy resources for tribal energy development. Office of Indian Energy and Economic Development. http://teeic.indianaffairs.gov/er/oilgas/impact/drilldev (accessed 3 March 2017).
- US Department of Energy (US DOE) (2009). Modern Shale Gas Development in the United States, A Primer, April, Work Performed Under Grant DE‐FG26‐04NT15455, Prepared by Ground Water Protection Council, Oklahoma City, OK, USA; 116 p. https://www.energy.gov/sites/prod/files/2013/03/f0/ShaleGasPrimer_Online_4‐2009.pdf (accessed 20 October 2018).
- US Department of Energy (US DOE) (2013). Modern Shale Gas Development in the United States, A Primer, US DOE, Office of Fossil Energy, National Energy Technology Laboratory, September, Modern Shale Gas Development in the United States: An Update; 79 p. http://www.netl.doe.gov/File%20Library/Research/Oil‐Gas/shale‐gas‐primer‐update‐2013.pdf (accessed 17 March 2017).
- US Environmental Protection Agency (US EPA) (1995). Crude oil and natural gas exploration and production wastes: exemption from RCRA Subtitle C regulation: EPA530‐K‐95‐003, 30 p.
- US Environmental Protection Agency (US EPA) (2015). Assessment of the Potential Impacts of Hydraulic Fracturing for Oil and Gas on Drinking Water Resources: External Review Draft [EPA Report]. (EPA/600/R‐15/047a). Washington, D.C: U.S. Environmental Protection Agency, Office of Research and Development, p. 599.
- US Environmental Protection Agency (US EPA) (2016a). Hydraulic Fracturing for Oil and Gas: Impacts from the Hydraulic Fracturing Water Cycle on Drinking Water Resources in the United States. Washington, DC: Office of Research and Development. EPA‐600‐R‐16‐236Fa, Dec., 666 p.
- US Environmental Protection Agency (US EPA) (2016b). Executive Summary – Hydraulic Fracturing for Oil and Gas: Impacts from the Hydraulic Fracturing Water Cycle on Drinking Water Resources in the United States. Washington, DC: Office of Research and Development. EPA‐600‐R‐16‐236ES, Dec., 50 p.
- US Government Accountability Office (US GAO) (1995). Aboveground Oil Storage Tanks: Status od EPA’s Efforts to Improve Regulation and Inspections, RCED‐95‐180, 16 p. https://www.gpo.gov/fdsys/pkg/GAOREPORTS‐RCED‐95‐180/html/GAOREPORTS‐RCED‐95‐180.htm (accessed 20 October 2018).
- USGS (2014). Record number of Oklahoma tremors raises possibility of damaging earthquakes, Updated USGS‐Oklahoma Geological Survey Joint Statement on Oklahoma Earthquakes Originally Released: 10/22/2013 1:07:59 PM; Updated 2 May 2014. http://earthquake.usgs.gov/contactus/golden/newsrelease_05022014.php (accessed 29 October 2015).
- Veil, J.A., Smith, K.P., Tomasko, D., et al. (1998). Disposal of NORM‐Contaminated Oil Field Wastes in Salt Caverns, Argonne National Laboratory, August, 71 p. https://publications.anl.gov/anlpubs/1998/08/30570.pdf (accessed 20 October 2018).
- Veil, J., Gasper, J. R., Pruder, M., et al. (2004). Drilling Waste Management Information System, prepared by Argonne National Laboratory for the U.S. Department of Energy, National Energy Technology Laboratory, June 2004. http://web.ead.anl.gov/dwm (accessed 20 October 2018).
- Vengosh, A., Warner, N., Osborn, S., and Jackson, R. (2011). Elucidating Water Contamination by Fracturing Waters from Gas Wells: Integrating Isotopic and Geochemical Tracers, US EPA Workshop; Hydraulic Fracturing Workshop 1 – 28 pp. https://www.epa.gov/hfstudy/elucidating‐water‐contamination‐fracturing‐fluids‐and‐formation‐waters‐gas‐wells‐integrating (accessed 20 October 2018).
- Walters, K., Jacobson, J., Kroenig, Z., and Pierce, C. (2015). PM2.5 Airborne Particulates Near Frac Sand Operations. Journal of Environmental Health 78: 8–12.
- Warner, N.R., Christie, C.A., Jackson, R.B., and Vengosh, A. (2013). Impacts of shale gas wastewater disposal on water quality in Western Pennsylvania. Environmental Science and Technology 47 (20): 11849–11857.
Suggested Reading
- Agency for Toxic Substances and Disease Registry (ATSDR) (2017). On‐line toxic substance database. www.atsdr.cdc.gov (accessed 20 October 2018).
- Armendariz, A. (2009). Emissions from natural gas production in the Barnett Shale area and opportunities for cost‐effective improvements. Prepared for Environmental Defense Fund, Austin, TX, Version 1.1, 26 January, p. 45.
- Arthur, J.D., Bohm, B., Coughlin, B.J., and Layne, M. (2009). Evaluating implications of hydraulic fracturing in shale gas reservoirs. Proceedings, 2009 SPE Americas E&P Environmental and Safety Conference, San Antonio, TX (23–25 March 2009). Society of Petroleum Engineers, SPE, 121038. Richardson, TX: Society of Petroleum Engineers.
- Barlow, P.M. (2003). Ground water in fresh water‐salt water environments of the Atlantic, U.S. Geological Survey circular, vol. 1262. Denver, CO: U.S. Geological Survey, 121 p.
- Bowie, C.P. (1918). Oil‐Storage Tanks and Reservoirs with a Brief Discussion of Losses of Oil in Storage and Methods of Prevention, United States Bureau of Mines Bulletin No. 155, Petroleum Technology Report No. 41. Washington: U.S. GPO, 76 p.
- Boyer, E.W., Swistock, B.R., Clark, J. et al. (2011). The Impact of Marcellus Gas Drilling on Rural Drinking Water Supplies. Harrisburg, PA: The Center for Rural Pennsylvania, Pennsylvania State University, 28p.
- Cooley, H. and Donnelly, K. (2012). Hydraulic Fracturing and Water Resources: Separating the Frack from the Fiction. Oakland, CA: Pacific Institute, 34 p.
- Crafton, J.W. (1998). Well evaluation using early time post‐stimulation flowback data. Presented at the 1998 SPE Annual Technical Conference and Exhibition, New Orleans, LA (27–30 September 1998), Society of Petroleum Engineers, SPE# 49223; pp. 599–607.
- Cramer, D.D. (2008). Stimulating unconventional reservoirs: lessons learned, successful practices, areas for improvement. SPE Unconventional Reservoirs Conference, Keystone, CO (10–12 February 2008). SPE‐114172, 218–236.
- Darrah, T.H., Vengosh, A., Jackson, R.B. et al. (2014). Noble gases identify the mechanisms of fugitive gas contamination in drinking‐water wells overlying the Marcellus and Barnett Shales. Proceedings of the National Academy of Sciences in the United States of America 111 (39): 14076–14081.
- Dresel, P.E. and Rose, A.W. (2010). Chemistry and Origin of Oil and Gas Well Brines in Western Pennsylvania, Open File Report OFOG 10‐01.0, Fourth Series. Harrisburg, PA: Pennsylvania Department of Conservation and Natural Resources, Pennsylvania Bureau of Topographic and Geologic Survey, 56 p.
- Ely, J.W. (1985). Stimulation Engineering Handbook, Secondary Recovery of Oil, Oil Wells, Hydraulic Fracturing. Tulsa, OK: PennWell Books, 357 p.
- Eshleman, K.N. and Elmore, A. (2013). Recommended best management practices for Marcellus Shale Gas Development in Maryland. Submitted to Maryland Department of the Environment, Baltimore, MD (13 February), p. 172.
- Esswein, E.J., Breitenstein, M., Snawder, J. (2011). NIOSH Field Effort to Assess Chemical Exposures in Oil and Gas Workers. Health Hazards in Hydraulic Fracturing, Presentation.
- Esswein, E.J. and Hill, R. (2013). Keeping Up with the Oil and Gas Rush, NIOSH Seeks to Improve Worker Safety and Health in the U.S. Upstream Oil and Gas Industry. The Synergist 24 (6): 24–27.
- Fakhoury, E. and Patton, K.R. (1992). A practical approach for environmental site assessment of oilfield properties prior to redevelopment. Association of Engineering Geologists 35th Annual Meeting Proceedings, Los Angeles, CA (2–9 October 1992).
- Grace, R. (2003). Blowout and Well Control Handbook. Amsterdam; London: Gulf Professional Publishing, 469 p.
- Hamilton, D.H. and Meehan, R.L. (1992). Cause of the 1985 Ross Store explosion and other gas ventings, Fairfax District, Los Angeles. In: Engineering Geology Practice in Southern California (ed. B.W. Pipkin and R.J. Proctor), 145–157. Belmont, CA: Star Publishing Company.
- Hayes, T. and Severin, B.F. (2012). Final Report to RPSEA; Barnett and Appalachian Shale Water Management and Reuse Technologies. Report No. 08122‐05.FINAL.1; Contract 0812205, 30 March, 125 p. http://www.netl.doe.gov/file%20library/research/oil‐gas/Natural%20Gas/shale%20gas/08122‐05‐final‐report.pdf (accessed 17 March 2017).
- Hultman, N., Rebois, D., Scholten, M., and Ramig, C. (2011). The greenhouse impact of unconventional gas for electricity generation. Environmental Research Letters 6: 044008. https://doi.org/10.1088/1748‐9326/6/4/044008.
- Ladlee, J.R. (2013). PA Water Use, Penn State Extension, Marcellus.psuu.edu, 1 p.
- Maryland Institute for Applied Environmental Health (2014). Potential Public Health Impacts of Natural Gas Development and Production in the Marcellus Shale in Western Maryland, Maryland Institute for Applied Environmental Health School of Public Health University of Maryland, College Park, July, p. 173.
- Massachusetts Institute of Technology (MIT) Energy Initiative (2011). The Future of Natural Gas: An Interdisciplinary MIT Study. Cambridge, MA: MIT.
- McBurney, R. (2011). Radiation protection from NORM and TENORM in the oil and gas industry: regulatory and non‐regulatory approaches. Presented at IRPA‐12, Buenos Aires, Argentina (19–24 October 2008) http://www.irpa12.org.ar/KL/III.4.3/Mc%20Burney_pp.pdf (accessed 20 October 2018).
- Murphy, E. (2013). The impact of the Bakken Play on the North Dakota Geological Survey, 63 p. Presentation of the State Geologist of the NDGS. http://www.stategeologists.org/temp/2013%20Bakken.pdf (accessed 12 May 2014).
- National Institute for Occupational Safety and Health (NIOSH) (2014). NIOSH Hazard Review, Health Effects of Occupational Exposure to Respirable Crystalline Silica; CDC NIOSH. http://www.cdc.gov/niosh/docs/2002‐129/pdfs/2002‐129.pdf (accessed 4 June 2014).
- Neff, J.M., McKelvie, S., and Ayers, R.C. Jr. (2000). Environmental Impacts of Synthetic Based Drilling Fluids. Report Prepared for MMS by Robert Ayers & Associates, Inc. August 2000, OCS Study MMS 2000‐064. 118 pp. https://www.boem.gov/ESPIS/3/3175.pdf. New Orleans, Louisiana: U.S. Department of the Interior, Minerals Management Service, Gulf of Mexico OCS Region accessed 20 October 2018.
- Occupational Safety and Health Administration (OSHA) (2012). Worker exposure to Silica during Hydraulic Fracturing; OSHA‐NIOSH Hazard Alert, June, 7 p.
- Occupational Safety and Health Administration (OSHA) (2016). OSHA's Final Rule to Protect Workers from Exposure to Respirable Crystalline Silica. https://www.osha.gov/silica (accessed 13 March 2017).
- Occupational Safety and Health Administration (OSHA) (2017). Taking Action to Protect Against Silica, Silica Advisor eTools. https://www.osha.gov/dsg/etools/silica/protect_against/protect_against.html (accessed 13 March 2017).
- Osborn, S.G., Vengosh, A., Warner, N.R., and Jackson, R.B. (2011). Methane contamination of drinking water accompanying gas‐well drilling and hydraulic fracturing. Proceedings of the National Academy of Sciences of United States of America 108 (20): 8172–8176.
- Penn State Extension (PSE) (2011). Marcellus Shale wastewater issues in Pennsylvania: current and emerging treatment and disposal technologies. Penn State University College of Agricultural Sciences. http://extension.psu.edu/natural‐resources/water/marcellus‐shale/waste‐water/current‐and‐emerging‐treatment‐and‐disposal‐technologies (accessed 17 March 2017).
- Powell, R.J., McCabe, M.A., Slabaugh, B.F. et al. (1999). Applications of a new, efficient hydraulic fracturing system. Society of Petroleum Engineers, SPE Production and Facilities 14 (2): 131–138.
- Price, W.E. Jr., Kilburn, C., and Mull, D.S. (1962). Availability of Ground Water in Boyd, Carter, Elliott, Greenup, Johnson, Lawrence, Lee, Menifee, Morgan, and Wolfe Counties, Kentucky, Hydrologic Atlas, vol. HA‐37. Washington, D.C: U.S. Geological Survey, in cooperation with the Kentucky Geological Survey.
- Rajaretnam, G. and Sptiz, H.B. (2000). Effect of leachability on environmental risk assessment for naturally occurring radioactive materials in petroleum oil fields. Health Phys. 78 (2): 191–198.
- Rice, D.D. (1993). Composition and origins of coalbed gas. In: Hydrocarbons from Coal, AAPG Studies in Geology, vol. 38 (ed. B.E. Law and D.D. Rice), 159–184. Tulsa, OK: American Association of Petroleum Geologists.
- Sackett, R.L. and Bowman, I. (1905). Disposal of Strawboard and Oil‐Well Wastes, United States Geological Survey Water‐Supply and Irrigation Paper, vol. 113. Washington, DC: GPO 52 p.
- Schlumberger (2017). Oil field glossary. http://www.glossary.oilfield.slb.com/en/Terms/c/conductor_pipe.aspx (accessed 17 March 2017).
- US Department of Energy (DOE) (2014a). Shale Gas‐101. http://energy.gov/fe/shale‐gas‐101 (accessed 17 March 2017).
- US Department of Energy (DOE) (2014b). Enhanced oil recovery. http://energy.gov/fe/science‐innovation/oil‐gas/enhanced‐oil‐recovery (accessed 17 March 2017).
- US Energy Information Administration (EIA) (2011). The geology of natural gas resources, 14 February, Today in Energy. http://www.eia.gov/todayinenergy/detail.cfm?id=110 (accessed 17 March 2017).
- US Environmental Protection Agency (US EPA) (2004a). Evaluation of Impacts to Underground Sources of Drinking Water by Hydraulic Fracturing of Coalbed Methane Reservoirs, June, Chapter 4; Hydraulic Fracturing Fluids, EPA 816‐R‐04‐003, 26 p. US EPA, Washington, DC. https://fracfocus.org/sites/default/files/publications/evaluation_of_impacts_to_underground_sources_of_drinking_water_by_hydraulic_fracturing_of_coalbed_methane_reservoirs.pdf (accessed 20 October 2018).
- US Environmental Protection Agency (US EPA) (2004b). Evaluation of Impacts to Underground Sources June 2004 of Drinking Water by Hydraulic Fracturing of Coalbed Methane Reservoirs, June, Chapter 3; Characteristics of CBM Production and Associated HF Practices, EPA 816‐R‐04‐003, 32 p. US EPA, Washington, DC. https://fracfocus.org/sites/default/files/publications/evaluation_of_impacts_to_underground_sources_of_drinking_water_by_hydraulic_fracturing_of_coalbed_methane_reservoirs.pdf (accessed 20 October 2018).
- US Environmental Protection Agency (US EPA) (2011). Inventory of U.S. Greenhouse Gas Emissions and Sinks: 1990–2009, EPA 430‐R‐11‐005. Washington, DC: US EPA.
- US Environmental Protection Agency (US EPA) (2013a). Naturally‐occurring radiation: overview, Updated: 28 February 2013. http://www.epa.gov/radiation/natural‐radiation‐overview.html (accessed 17 March 2017).
- US Environmental Protection Agency (US EPA) (2013b). Class II wells: oil and gas related injection wells (Class II). http://water.epa.gov/type/groundwater/uic/class2 (accessed 17 March 2017).
- USGS (1999). Naturally Occurring Radioactive Materials (NORM) in Produced Water and Oil‐Field Equipment: An Issue for the Energy Industry, USGS Fact Sheet, vol. FS–142–99. Reston, VA: U.S. Department of the Interior, U.S. Geological Survey.
- Williams, J.H. (2014). The Marcellus Shale Gas Play, Geology, Development, and Water‐Resource Impact Mitigation. Troy, NY: USGS, New York Water Science Center.
- World Nuclear Association (2014). Naturally‐occurring radioactive materials (NORM); (updated January 2014). http://www.world‐nuclear.org/info/Safety‐and‐Security/Radiation‐and‐Health/Naturally‐Occurring‐Radioactive‐Materials‐NORM (accessed 19 April 2017).