CHAPTER 2
ELECTRIC NETWORK ANALYSIS IN ENERGY PROCESSING AND SMART GRID
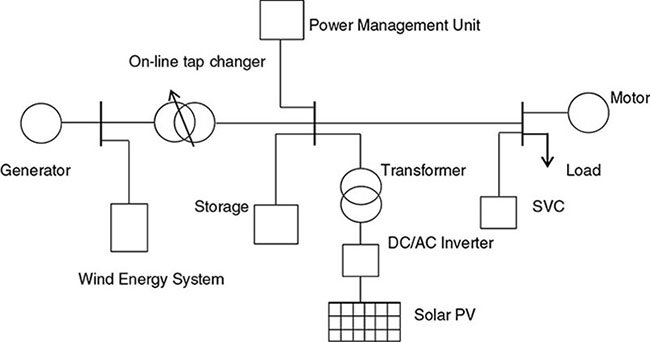
In modern AC electric power systems (Figure 2.1), power is generated, transmitted, and distributed as balanced, three-phase AC. The three-phase system was independently invented by Galileo Ferraris, Mikhail Dolivo-Dobrovolsky, Jonas Wenström, and Nikola Tesla in the 1880s and is the most widely used means of transferring power through power grids. The three-phase system has the advantage of economy over the single-phase system because more power can be transmitted with significant cost savings in conductors per unit line length. The three-phase system may be configured as three-wire star, four-wire star, or three-wire delta system. Figure 2.1 Simplified single-line diagram schematics of a modern electric power system. Because of advances in electronics, the future electric power system is headed in the direction of microgrids and smart grids. In anticipation of demands, researchers and students need to be equipped with relevant knowledge on the emerging trends in this area. This chapter introduces the fundamentals of electric power systems and the basic computational tools needed for the design and analysis of the future-generation power system. In electrical power systems, we are mainly concerned with flow in the electrical circuit, such as Voltage (V), Frequency (f), Current (I), and Power (P). To treat sinusoidal, steady-state behavior of an electric current, some further definitions are necessary. Let
and
and
where
In polar form,
or
It is important to recall the following trigonometric identities:
For a voltage signal represented in terms of root mean square (rms) value:
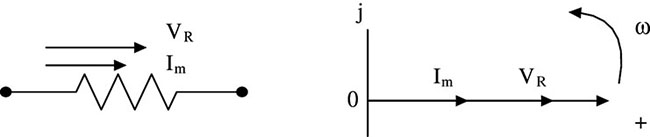
For impedance, if the circuit is purely resistive, inductive, or capacitive, there will be difference in current and angle phase shift. In a purely resistive circuit, Figure 2.2, the current is in phase with voltage:
Figure 2.2 Phasor diagram of a purely resistive circuit. Current lags behind V by 90° as seen in Figure 2.3:
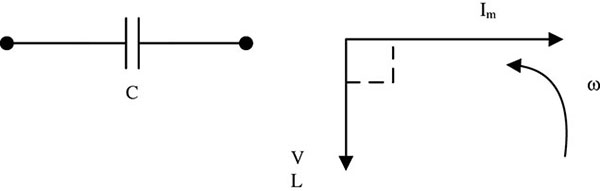
Figure 2.3 Phasor diagram of purely inductive circuit. In a purely capacitive circuit Figure 2.4, current leads voltage by 90°:
Figure 2.4 Phasor diagram of a purely capacitive circuit. The instantaneous power is given by:
where Cosϕ is the power factor. The power factor of a system is defined as:
where P = VICosϕ and Q = VISinϕ. Q is the reactive power measured in kilo-var (kvar). The apparent power S is then:
and
If the load impedance is Z, then,
In terms of load admittance,
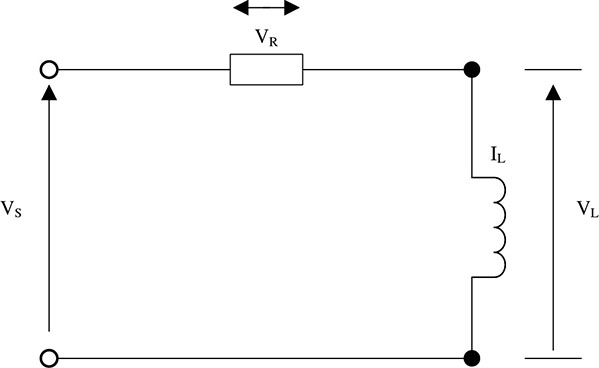
Consider the AC circuit of Figure 2.5. The load, operating at a voltage VL, draws a current IL from the source whose voltage is Vs, through resistance R and inductive reactance jX. Figure 2.5 AC circuit analysis with phasor diagram. By Kirchhoff's voltage rule:
where
If the load is operated at power factor Cosϕ and voltage VL then
Then Equation 2.29 may be rewritten as:
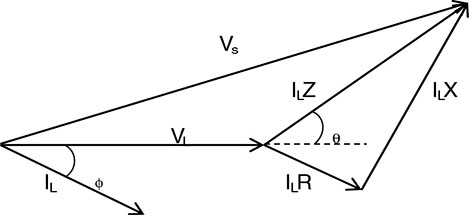
A phasor diagram Figure 2.6 may be constructed based on Equation 2.35 from which the source voltage Vs may be determined. Figure 2.6 Phasor relationships of power system quantities. One of the methods of transmitting and distributing AC electric power is by means of polyphase systems. This is a system with three or more energized AC currents carrying conductors with a phase deviation between them. For a balanced n-phase system, the phase difference is given by:
For two-, three- … six-phase systems, voltages will be out of phase by
90°, 120°, …60°, respectively. Polyphase systems are particularly useful for transmitting power as more power can be transmitted than when a single phase is used. Power generation, transmission, and distribution are usually connected in a type of polyphase system for heavy utilization of AC electric power. These types of connections provide economic advantages as well as system stability and capacity control. Both voltage and currents are sinusoidal waveforms equal in magnitude, but are displaced from one another by 120° in time phase. Stator windings are connected in three-phase through a ground wire, leading to four wires. The center of the four wires (Figure 2.7) leads to a Y-connected system, where each is referred to as a phase and the fourth conductor is called the neutral wire, which has four-wire balanced connection. Figure 2.7 Equivalent Y diagram. In vector (phasor) form
Similarly, for Δ-connected system
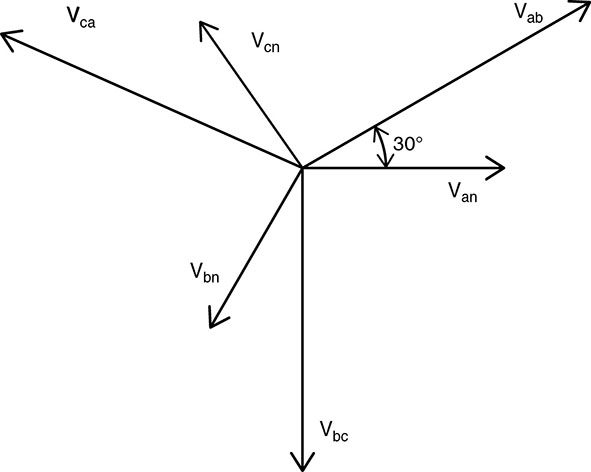
The line-neutral and line–line voltages with proper relations are shown in Figure 2.8. Figure 2.8 Phase and line voltage representation.
Taking VNA as a reference from Figure 2.9,
Figure 2.9 Equivalent Y-connected voltage phasor representation.
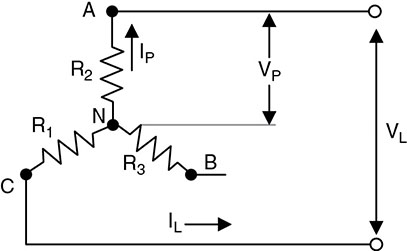
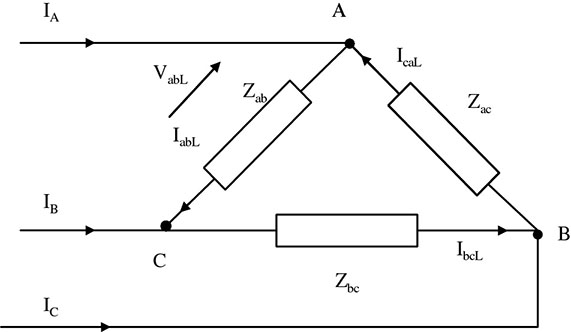
These connections are not properly balanced to maintain balanced voltage across each load. A delta-connected generator Figure 2.10 is possible but not desirable for two main reasons: Figure 2.10 Mesh or delta connection. A delta-connected load or Y-connected load (Figure 2.11) uses the same configuration as discussed in Section 2.8.
Figure 2.11 Delta-connected three-phase loads.
From which the individual phase currents may be computed as
The line currents are
Also, under a balanced condition,
In general, the sum of the three line currents in a three-phase, three-wire system is zero. This implies that power is also balanced. Total power
These are also given as real power for each phase, i.e.,
Accordingly, if
then |Pp| are equal and out of phase 120° apart and the line currents are Therefore, we write: VCB = VPh = VLfor delta connection
Total power
Therefore,
Cosθ is referred to as the power factor. The same applies to a Y-connected system (Figure 2.12)
Figure 2.12 Y-connected load. A Y-connected load can have four wires, as shown:
The phase and line currents have the same value
This leads to:
So that total power
Total power
Example 1 Find the positive-sequence, line-to-line voltages in the balanced Y-connected generator if the line-to-neutral voltages have a magnitude of 12 kV and phase a is the reference.
Hence,
Example 2 Given a Y-connected load of impedance
ZY = 10∠30° Ω and a balanced positive sequence source with
Vab = 14.4∠30°
kV, find the load currents. Solution:
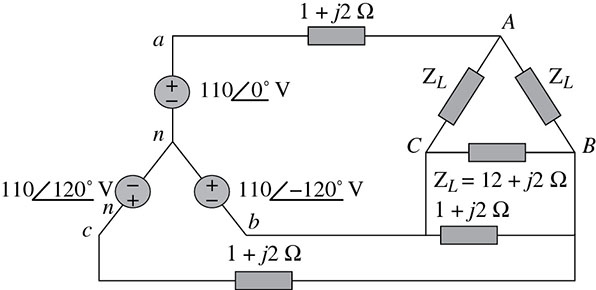
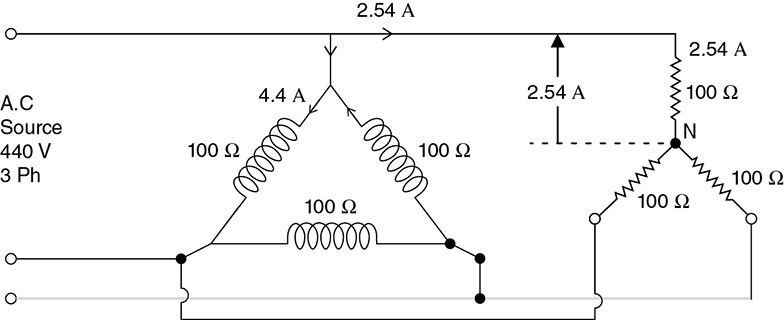
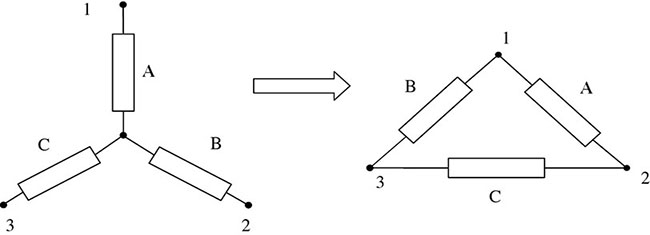
Example 3 Three noninductive resistances, each of 100 ohms, are connected in star to a three-phase 440 V supply. Three inductive coils, each of reactance 100 ohms connected in delta are also connected to the supply. Calculate the (a) line current and (b) power factor of the system. Solution: Voltage across each phase resistance = Current flowing through each resistor For three inductive coils connected in delta, Vφ = VL = 440V Total line current drawn from the source = (2.53 − j7.62) = 8.032 A In power-network computations, it is often required to convert a Y network to a delta (Δ) and vice versa. Consider the Y connection of impedances shown in Figure 2.13. Figure 2.13 Star-delta conversion of impedances. Given ZA, ZB, and ZC,
For balance, if
then
For conversion of delta to Y, the diagram and process is as shown in Figure 2.14: Figure 2.14 Delta-star impedance conversion.
If
then
Table 2.1 shows a summary of phase and line voltages and currents for balanced three phase systems. TABLE 2.1 Summary of Phase and Line Voltages/Currents for Balanced, Three-Phase Systems Example 1 A balanced, delta-connected load having an impedance 20 − j15Ω is connected to a delta-connected, positive-sequence generator having Vab = 330∠0°V. Calculate the phase currents of the load and the line currents. Solution: The load impedance per phase is: ZΔ = 20 − j15 = 25∠ − 36.87°Ω. Since VAB = Vab, the phase currents are:
For delta load, the line current always lags the corresponding phase current by 30° and has a magnitude Example 2 A balanced abc sequence, Y-connected source with Van = 100∠10° is connected to a Δ-connected, balanced load 8 + j4Ω per phase. Calculate the phase and line currents. Option 1 If the phase voltage Van = 100∠10°, then the line voltage is
or
The phase currents are
The line currents are
Option 2 Use a single-phase analysis approach. Solution: Convert the delta-connected load to the star using the delta–star conversion procedure where
hence Recall that line current and phase current are the same in a star-connected system. Hence, using the abc sequence, line currents are obtained as:
Also
Example 3 A balanced, delta-connected load with an impedance 20 − j5Ω is connected to a delta-positive sequence generator with Vab = 330∠0°. Calculate the phase currents of the load and the line currents. Solution: The load impedance per phase is
For a delta-connected system, phase voltage is equal to line voltage, i.e., VAB = Vab, hence the phase currents are
For a delta load, the line current always lags the corresponding phase current by 30° and has a magnitude of
Example 4 A balanced, Y-connected load with a phase impedance of 40 + j25Ω is supplied by a balanced, positive-sequence delta-connected source with a line voltage of 210 V. Calculate the phase currents. Use Iab as a reference. Solution: The load impedance is
and the source voltage is Vab = 210∠0°. When the delta-connected source is transformed into a Y-connected source,
The line currents are
which are the same as the phase currents. The power-system quantities such as voltage, current, and power are normalized for ease of computation. In power-system analysis, per unit or percent of specified base values typically are expressed as measurements. The advantages of using per unit measurements are: The per unit definition allows an actual quantity to be normalized to unity and facilitates the comparison of all other measured values to that base-unit value. By definition, the per-unit value of a quantity X is given by
The actual quantity is the value of the quantity in actual units such as watts, vars, or hertz. The base values are determined by the mass quantity allowed for a device in terms of V, I, P, or f by the operation. The base value has the same unit as the actual quantity, hence per unit is dimensionless. For electrical laws to be valid in the per unit system, the following relations must be used for other bases: given that
where
then
such that
Note that: Example 1 Consider a 100 V sinusoidal source in series with a 3Ω resistor, an 8Ω inductor, and a 4Ω capacitor. Taking base voltage as 100 V and base VA as 500VA and working in per unit: Solution:
or
Converting the circuit component values to per unit:
The circuit is: 4.0∠ − 53.1° Solution:
For Δ connection,
Solution: The voltage leads the current by 30°. Solution: In this chapter we presented the fundamentals of electric power network analysis concepts and principles, which are essential in analysis and computations in any electric power system. The nature and behavior of electric currents and voltage signals, and the effects of their interactions with discrete circuit components, are important base knowledge for students, as is awareness of the three-phase system as a better, more reliable carrier of electric power. Circuit analysis at this level is equally beneficial to dealing with more advanced electric power-system issues. Overall, fundamental computational skills needed for any analysis of the power system was presented here. This information is particularly applicable for competitive work in the micogrid. Determine the line current drawn from a three-phase, 440 V line by a three-phase, 10HP motor operating at rated load. The motor has an efficiency of 91.6 percent and a power factor of 0.85 lagging. Also calculate the real and reactive power drawn by the motor. In Problem 4, if the line connecting the motor has an impedance of 0.5 + j1.0Ω, find the line–line voltage at the supply bus, assuming the motor bus voltage is 440 V. Determine the current drawn from a three-phase, 440 V line by a three-phase 15HP motor operating at full load, 90 percent efficiency, and 80 percent power-factor lagging. Find the values of P and Q drawn from the line. If the impedance of each of the three lines connecting the motor of Problem 5 to a bus is 0.3 + j0.85, find the line-to-line voltage at the bus that supplies 440 V at the motor. A balanced delta load consisting of pure resistance 15ohm per phase is in parallel with a balanced Y load having phase impedances of (8 + j6) ohm. Identical impedances of (2 + j5) ohm are in each of the three lines connecting the combined loads to a 110 V, three-phase supply. Find the current drawn from the supply and line voltage at the combined loads. A balanced, delta-connected load having an impedance 12 – j10Ω is connected to a delta connected, positive-sequence generator having Vab = 210∠0°V. Calculate the phase currents of the load and line currents. A balanced, Y-connected load with a phase impedance of 60 + j25Ω is supplied by a balanced, positive-sequence, delta-connected source with a line voltage of 220 V. Using Iab as a reference, calculate the phase currents.2.1 INTRODUCTION
2.2 COMPLEX POWER CONCEPTS
![]()
![]()
![]()
![]()
![]()
![]()
![]()
![]()
![]()
![]()
![]()
![]()
![]()
2.2.1 Purely Resistive Circuit
![]()
2.2.2 Purely Inductive Circuit
![]()

2.2.3 Purely Capacitive Circuit
![]()
2.2.4 Instantaneous Power
![]()
![]()
![]()
![]()
2.2.5 Power Factor
![]()
2.2.6 Complex Power
![]()
![]()
![]()
![]()
![]()
![]()
![]()
2.3 REVIEW OF AC-CIRCUIT ANALYSIS USING PHASOR DIAGRAMS
![]()
![]()
![]()
![]()
![]()
![]()
2.4 POLYPHASE SYSTEMS
![]()
2.4.1 Three-Phase Circuits
2.4.2 Balanced Y-Connected Three-Phase Source


![]()
![]()
![]()
![]()
2.4.3 Phase and Line Voltages: Delta Connected
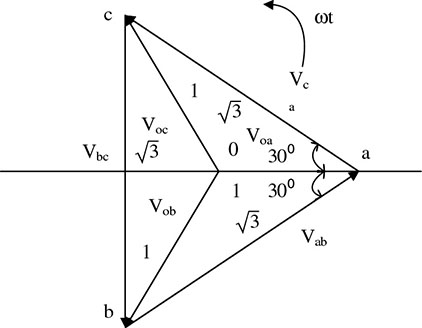
![]()
![]() Line-Neutral, VBA leads VNA by 30°, VCB leads VNB by 30°.
Line-Neutral, VBA leads VNA by 30°, VCB leads VNB by 30°.2.4.4 Equivalent Y-Connected Voltage Phasor Representation

![]()
![]()
![]()
2.4.5 Mesh or Delta Connection
![]()
![]()
![]()

2.5 THREE-PHASE IMPEDENCE LOADS
![]()
![]()
![]()
![]()
![]()
![]()
![]()
![]()
![]()
![]()
![]()
![]()
![]()
![]()
![]()
![]() . Similarly, voltages are equal and out of phase by 120°.
. Similarly, voltages are equal and out of phase by 120°.
![]()

![]()
![]()
![]()

![]()
![]()
![]()
![]()
![]()
![]()
![]()
![]()
![]()
![]()
![]()
![]()
![]()
![]()
![]()
![]()
![]()
![]()
![]()
![]()
![]()
2.6 TRANSFORMATION OF Y TO DELTA AND DELTA TO Y NETWORKS
![]()
![]()
![]()
![]()
![]()

![]()
![]()
![]()
![]()
![]()
2.7 SUMMARY OF PHASE AND LINE VOLTAGES/CURRENTS FOR BALANCED THREE-PHASE SYSTEMS
Connection
Phase Voltages/Currents
Line
Y–Y
Voltage
VYAN = Vp∠0°
![]()
1.1
VYBN = Vp∠ − 120°
![]()
VYCN = Vp∠120°
![]()
Current
Phase currents same as line currents
![]() where + θ is for leading pf and − θ is for lagging pf
where + θ is for leading pf and − θ is for lagging pf
IB = IA∠ − 120° ± θ
IC = IA∠120° ± θ
Y − Δ
Voltage
VYAN = Vp∠0°
![]()
1.2
VYBN = Vp∠ − 120°
![]()
VYCN = Vp∠120°
![]()
Current
![]()
IΔ1 = IA = IA∠ ± θ
1.3
![]()
IΔ2 = IB = IA∠ − 120° ± θ
![]()
IΔ3 = IA∠120° ± θ
Δ − Δ
Voltage
![]()
Same as phase voltage
![]()
![]()
Current
![]()
IΔ1 = IA∠ ± θ
1.4
![]()
IΔ2 = IA∠ − 120° ± θ
![]()
IΔ3 = IA∠120° ± θ
![]()
Voltage
VYAN = Vp∠0°
![]()
1.5
VYBN = Vp∠ − 120°
![]()
VYCN = Vp∠120°
![]()
Current
![]()
IΔ1 = IA = IA∠ ± θ
![]()
IΔ2 = IB = IA∠ − 120° ± θ
![]()
IΔ3 = IA∠120° ± θ
![]() times that of the phase current. Hence, the line currents are:
times that of the phase current. Hence, the line currents are:
![]()
![]()
![]()
![]()
![]()
![]()
![]()
![]()
![]()
![]()
![]()
![]()
![]()
![]()
![]()
![]()
![]()
![]()
![]()
![]() times that of the phase current. Hence, the line currents are
times that of the phase current. Hence, the line currents are
![]()
![]()
![]()
![]()
![]()
![]()
![]()
![]()
2.8 PER-UNIT SYSTEMS
![]()
![]()
![]()
![]()
![]()
![]()
![]()
![]()
![]()
![]()
![]()
![]()
![]()
![]()
![]()
![]()
![]()
![]()

= 0.15 + j0.2
0.25∠53.1°
Illustrative Problems and Examples
![]()
![]()
![]()
![]()
![]()
![]()
![]()
![]()
![]()
![]()
![]()
![]()
![]()
![]()
![]()
![]()
![]()
![]()
![]()
![]()
![]()
![]()
![]()
![]()


2.9 CHAPTER SUMMARY
EXERCISES
BIBLIOGRAPHY