
CHAPTER
7
Performance-Related New Features
When discussing “Oracle performance,” it can mean one of a dozen different things. Regardless of how you describe Oracle performance, it usually boils down to optimizing your storage, ensuring that statistics are up to date, and leveraging your SGA and PGA as a first-tier storage device.
In this chapter, I’ll first describe how index monitoring has been completely reinvented to provide a much higher level of granularity than previous incarnations of index monitoring. Next, I’ll explain how the Optimizer Statistics Advisor can force you to stay “up to date” on Oracle statistics best practices by incorporating the best practices into maintenance window jobs. Finally, I’ll discuss two memory-related enhancements: a new In-Memory feature that allows you to store more than just columns from a specific set of tables as well as controlling PGA memory usage on a per-session basis.
Monitoring Index Usage
Inevitably, your database has too few indexes or too many. You want to have the best performance for your user queries by retrieving as few database blocks as possible to get the relatively small number of rows that would take much longer to retrieve if you used full table scans. Even if you err on the side of having more indexes, you need to keep in mind that indexes can take up a lot of disk space (sometimes they can be bigger than the table itself!) as well as require more CPU and I/O to maintain each index during DML statements (in particular during the nightly ETL window). For the sample table HR.EMPLOYEES, there are six indexes, shown in Figure 7-1. Depending on the types of reporting for the EMPLOYEES table, some of those indexes might be used very infrequently or not at all.

FIGURE 7-1. Default indexes for HR.EMPLOYEES
Since Oracle9i Database, up to and including Oracle Database 12c Release 1, Oracle has provided a somewhat rudimentary way to determine if an index is being used or not with the MONITORING USAGE clause. You mark an index for MONITORING like this:

Going forward, you query the V$OBJECT_USAGE dynamic performance view to see if the index has been used or not:

There are a number of problems with this method. First, the indicator for the index usage is only a binary indicator: either the index was used since 2/20/2017 or it was not. That’s not very granular. The index could have been used once by a report writer who ran one ad hoc query and may never run that query again. That alone would not be a justification for keeping that index. Worse yet, you don’t even have to run the query for the index monitoring flag to be set: if you run an EXPLAIN PLAN on a query and the execution plan indicates that an index would be used to run that query (and it might never be run!), the index monitoring flag will be set.
If you change index monitoring by running ALTER INDEX … NOMONITORING USAGE, it will reset the flag, but that can be a labor-intensive and error-prone task. The overhead for monitoring indexes can be significant using this method as well, so it is not wise in Oracle Database 12c Release 1 to turn on index monitoring for all indexes in the database at once!

NOTE
The view V$OBJECT_USAGE still exists in Oracle Database 12c Release 2 but is deprecated and is not populated when an index is referenced.
To address the index monitoring issue with a much more granular solution, Oracle Database 12c Release 2 includes a new data dictionary view, DBA_INDEX_USAGE, to monitor indexes over time, as well as a related dynamic performance view, V$INDEX_USAGE_INFO.
DBA_INDEX_USAGE
Oracle went from 0 to 60 in under 3 seconds on its index monitoring solution: DBA_INDEX_USAGE. This data dictionary view tracks every index, all the time. There is nothing to turn on or off, and it is very lightweight with negligible CPU overhead. Here is what the view looks like:

Quite a few things to note here. This view tracks not only index usage but also the last time that the index was used. Therefore, even if the index has been accessed thousands of times, it might still be a candidate for retirement if the last time it was used was over a year ago (perhaps the application has been changed significantly in the last year, no longer requiring the index on a table).
It’s even more granular than that: it’s like a histogram for index usage. Each of the “buckets” in DBA_INDEX_USAGE accumulates a count for various levels of index access and rows returned. If an index has been accessed very infrequently but, when it is accessed, returns over 1000 rows, you may decide that some query tuning or application changes are required.
Last, but not least, note the distinction between TOTAL_ACCESS_COUNT and TOTAL_EXEC_COUNT. When running an EXPLAIN PLAN, an index will be marked as accessed but may not necessarily be used in the execution plan. Therefore, it’s possible that TOTAL_ACCESS_COUNT could be very high but TOTAL_EXEC_COUNT could be close to zero. Conversely, an index could be used for every query running against a certain table, in which case the values of TOTAL_EXEC_COUNT and TOTAL_ACCESS_COUNT would be very similar.
In this example, the table called EMPLOYEES_HIST has over 1,000,000 rows and has a primary key index called PK_EMP_HIST on the column UPK:

The lookups in this table are almost always by the primary key UPK, as in this example:
![]()
The execution plan shows that the index PK_EMP_HIST will be used to retrieve this row since we’re retrieving only two rows out of over 1,000,000. That means we should see this index access in DBA_INDEX_USAGE:

A few things to note here. Since the index was created, it has been accessed five times and used in a query five times. Because it was a very selective index, retrieving only one or two rows at a time, the TOTAL_ROWS_RETURNED count is 27 across 7 executions that used the index. Finally, the index was last used on 2/23/2017. If you had been testing this index recently to determine how useful it is, then the LAST_USED column might not be very useful! If only there were a histogram for the LAST_USED dates too…maybe in Oracle Database 12.3!
To get the most accurate and complete index usage count, you must set the hidden parameter “_iut_stat_collection_type” to ALL. Do not set hidden parameters without the advice of Oracle Support.
V$INDEX_USAGE_INFO
Remember that database views starting with V$ are called dynamic performance views. The dynamic part means that the views are not persistent—every time the database instance is restarted, the contents of the V$ views are cleared and are repopulated over time while the instance is open. The dynamic performance view V$INDEX_USAGE_INFO is no different, and it feeds into DBA_INDEX_USAGE, discussed in the previous section. It looks like this:

This view is updated when indexes are accessed, and is flushed to the Automatic Workload Repository (AWR) via the DBA_INDEX_USAGE view every 15 minutes. There isn’t much granularity in this view, but a couple of columns are of interest:

The column INDEX_STATS_COLLECTION_TYPE with a value of 0 means that all index accesses are being recorded; a value of 1 means that index accesses are sampled. At this moment, there is one index access recorded in the column ACTIVE_ELEM_COUNT. That column will be set back to 0 after the next flush.
Optimizer Statistics Advisor
Statistics on database tables and indexes, whether they be histograms, minimum and maximum values, row counts, or correlated, have been the key to optimal database performance for every version of Oracle Database that uses the cost-based optimizer (you shouldn’t want or need to use the rule-based optimizer for any reason). Given the types of joins that Oracle can use even when you are joining only two tables, knowing the number of rows and the distribution of data for the join columns and predicates in the WHERE clause is key to a good execution plan. With bad cardinalities, a nested loop join on a 1-billion-row table when the optimizer only expected 10 rows means that you’ll get a phone call at 3 A.M. when that critical report due tomorrow isn’t finished yet.
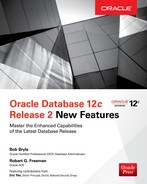
Knowing that statistics are critical to a well-performing database, the next question is whether statistics are being kept up to date adequately using the default maintenance windows. Should statistics be collected on some tables more often than once a day—maybe several times during the day? Are statistics being collected too often? Oracle Database 12c Release 2 addresses this with the Optimizer Statistics Advisor (OSA). Figure 7-2 shows the components and inputs for the Optimizer Statistics Advisor.
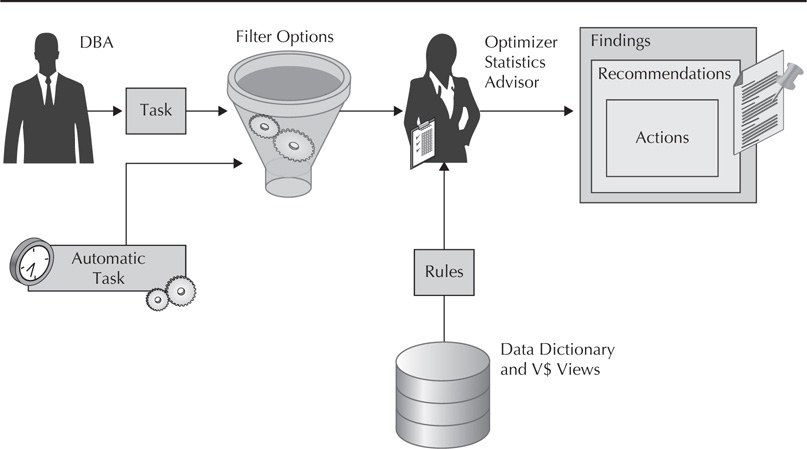
FIGURE 7-2. Process flow for Optimizer Statistics Advisor
Keep in mind that the Optimizer Statistics Advisor does not collect statistics itself—it only analyzes how you are collecting statistics now and suggests changes to your statistics collection strategy. In Figure 7-2, the DBA has set up manual statistics collection tasks that complement the automatic tasks that run in the default maintenance window. But the DBA might not be aware that the manual tasks or extra scheduled tasks may be redundant or that there are still tables that keep missing out on statistics collection. The busy DBA (which is every DBA) may not be aware of newer optimizer and statistics collection features. Newer Oracle recommendations for statistics collection include specifying AUTO_SAMPLE_SIZE for almost all statistics collection jobs. Many of the DBA’s existing statistics collection jobs, having been set up in previous versions of Oracle Database, are likely specifying a sample size of 100 percent. This may be excessive and not beneficial for most tables.
Various other issues may plague the database and may be difficult or time consuming for the DBA to find. Table statistics may not be in sync with the table’s indexes, causing more than expected fluctuations in elapsed time when an index is incorrectly chosen by the optimizer over a full table scan with the expectation that the index will drive fewer I/O requests.
The OSA automates many of the tasks that the DBA has been performing in previous releases of Oracle Database. Here are just a few of those tasks and features:
![]() When new statistics-related best practices are documented by Oracle with each release of Oracle Database, the OSA automatically incorporates those into its rule engine when analyzing the statistics collection in the database.
When new statistics-related best practices are documented by Oracle with each release of Oracle Database, the OSA automatically incorporates those into its rule engine when analyzing the statistics collection in the database.
![]() The OSA generates findings, recommendations, and actions in HTML reports.
The OSA generates findings, recommendations, and actions in HTML reports.
![]() The OSA provides scripts that can be run by the DBA to address findings and recommendations.
The OSA provides scripts that can be run by the DBA to address findings and recommendations.
![]() By default, the OSA runs a task in the maintenance window called AUTO_STATS_ADVISOR_TASK once per day.
By default, the OSA runs a task in the maintenance window called AUTO_STATS_ADVISOR_TASK once per day.
![]() The OSA is incorporated into the results of the SQL Tuning Advisor and the AWR reporting infrastructure.
The OSA is incorporated into the results of the SQL Tuning Advisor and the AWR reporting infrastructure.
![]() The OSA adds new procedures to DBMS_STATS to allow fine-tuning of the OSA analysis tasks.
The OSA adds new procedures to DBMS_STATS to allow fine-tuning of the OSA analysis tasks.
![]() The OSA enables filtering of tasks or task results. For example, you may only want to see statistics staleness for a key subset of schemas.
The OSA enables filtering of tasks or task results. For example, you may only want to see statistics staleness for a key subset of schemas.
NOTE
The parameter STATISTICS_LEVEL must be set to TYPICAL or ALL for the AUTO_STATS_ADVISOR_TASK to run.
The OSA framework is hierarchical in its deployment and use. Figure 7-3 shows the relationships between the OSA’s components.

FIGURE 7-3. Optimizer Statistics Advisor hierarchy
In the following sections, I’ll go into more detail of each layer and how much interaction you’ll have with each layer. Hint: It’s a very automated process, as you’ve gathered by now, and if you’re working too much in the rules layer, you’re doing it wrong!
Rules
The rules in the OSA often reflect new features in the current release, which further translates into recommended parameter settings. The OSA will tell you when you haven’t followed the rules! Looking at the available rules is as easy as viewing the data dictionary view V$STATS_ADVISOR_RULES. This view doesn’t have many columns, but it is a “parent” table from a data modeling perspective—the primary key of this table drives other tables and internal Oracle code to analyze the database for compliance with the rules. Here are the columns:

In Oracle Database 12c Release 2 (12.2.0.1), there are only 24 rules, but they’re big ones! The column RULE_TYPE can have one of three values:
![]() SYSTEM Preferences for statistics collection. Did you disable SQL Plan Baselines? Did all of your statistics jobs complete successfully?
SYSTEM Preferences for statistics collection. Did you disable SQL Plan Baselines? Did all of your statistics jobs complete successfully?
![]() OPERATION Variations from defaults. Are you using the defaults for DBMS_STATS procedures?
OPERATION Variations from defaults. Are you using the defaults for DBMS_STATS procedures?
![]() OBJECT Recommendations for specific types of objects or specific objects: volatile objects should have statistics locked, keeping table and index statistics updated together.
OBJECT Recommendations for specific types of objects or specific objects: volatile objects should have statistics locked, keeping table and index statistics updated together.
Here are the 24 rules. As you can see, most of the rule names are self-describing.


For example, rule 20, AvoidOutOfRange, will show you objects whose statistics may become stale quickly when key columns have timestamps and any low/high or histogram statistics could drive poor execution plans during the ETL to the data warehouse phase since the (stale) statistics may mislead the optimizer to think that there are no rows in the table with a given date or date range.
In summary, the rules fall into these three categories: how you should be gathering statistics, when to gather statistics, and how to optimize the efficiency of statistics gathering.
Findings
The “findings” phase means that the OSA has examined the evidence, has sequestered the jury, and has decided if you have broken the rules or not. The sources for the findings include the statistics history in the data dictionary, the metrics gathered in the AWR, the log files from statistics gathering operations, and of course the existing state of statistics. You are very familiar with the location of statistics information: DBA_TAB_STATISTICS and DBA_TAB_COL_STATISTICS. Each finding references one of the 24 rules. However, as you might expect, especially with the object-level rules, a given rule may generate several or hundreds of findings.
Recommendations
The OSA generates recommendations while running a scheduled task, which can be part of the auto-task framework or invoked manually at any time. These recommendations run the gamut from detecting obsolete settings to individual object recommendations. The data dictionary view you can use to view the recommendations is DBA_ADVISOR_RECOMMENDATIONS. Looking at one particular recommendation:

Apparently, some users are collecting statistics at the table level instead of the schema level, and the OSA is reminding them of that. Of course, these recommendations aren’t always absolute—the developer may have had a very good reason to gather statistics on a specific table. If this is a legitimate frequent exception to the rule, you can filter out this particular recommendation going forward.
Actions
In many cases, the recommendations generated by the OSA will be accompanied by SQL statements or a PL/SQL block to make it easier to implement the recommendation. The code to implement recommendations is stored in DBA_ADVISOR_ACTIONS. Not all recommendations have corresponding action code, however. Take the example in the previous section—the recommendation was to not do something. There is no code sample to prevent a developer from using a certain method for manual statistics gathering short of locking the developer out of the database!
Other generated actions are more straightforward. If the current default statistics level is set to a fixed percentage instead of AUTO_SAMPLE_SIZE, the view DBA_ADVISOR_ACTIONS will have code to fix that. If one of the OSA actions is to set incremental statistics on a large partitioned table, the “fix code” will look something like this:
![]()
In-Memory Enhancements
The Oracle In-Memory features introduced in Oracle Database 12c Release 1 were revolutionary, not evolutionary. In previous releases of Oracle Database, you could use memory-resident features such as pinning a table in the buffer cache or using the query result cache to take frequently referenced aggregate queries and keep them in a special memory area so that the aggregation process would not have to be repeated—assuming, of course, that the underlying table rows did not change.
In Oracle Database 12c Release 1, Oracle In-Memory takes one or more tables, or even specific columns of a table, and stores them in a special SGA area called, appropriately, the In-Memory cache. When these tables or columns are referenced in a query, the memory-resident versions of those tables or columns are used in the query, reducing the execution time by a factor of 10 or even 1,000 depending on the type of query and the number of rows needed from the In-Memory cache.
To ensure that In-Memory performs, Oracle Database 12c Release 1 leverages hardware features to process more than just one column at a time. To save space in memory (even with a terabyte of RAM, you still seem to run out of memory), Oracle In-Memory can use one of four levels of compression that trade CPU overhead for a smaller memory footprint.
There are some limitations to those features, however. First, In-Memory can only save actual table columns in memory, not virtual columns or expressions. In addition, if two memory-resident columns have different compression levels, they can’t be used in a query join until they are uncompressed first. Finally, the contents of the In-Memory cache are lost when the database instance is shut down and restarted—but what if the table is truly read-only and it takes hours to repopulate?
Oracle Database 12c Release 2 addresses many of these limitations by adding two new types of columns that can reside in the In-Memory area and by giving you the option to persist an In-Memory area through an instance restart. The procedure DBMS_INMEMORY_ADMIN manages two of the new In-Memory features: In-Memory FastStart and In-Memory Expressions.
Initialization Parameters
Oracle Database 12c Release 2 adds two new initialization parameters to support the new types of objects that can reside in the In-Memory cache: INMEMORY_EXPRESSIONS_USAGE and INMEMORY_VIRTUAL_COLUMNS.
The parameter INMEMORY_EXPRESSIONS_USAGE controls whether any types of expressions used in SELECT queries or JSON columns will be cached. The default is ENABLE. Numeric columns take up even less space when this parameter is set to ENABLE or STATIC_ONLY: other data types compress more effectively but now NUMBER columns can benefit from additional storage reductions as well.
The other new column, INMEMORY_VIRTUAL_COLUMNS, further refines what can be stored in the In-Memory area at the table level. It’s likely that many of your tables have virtual columns that are used for a variety of purposes, such as for partitioning a table or hiding the business logic for a derived column used in a report. Allowing virtual columns to reside in the In-Memory cache avoids constant reevaluation and makes In-Memory joins on these columns possible too. The default for this column is MANUAL, meaning that you have to explicitly identify a virtual column as a candidate for In-Memory. Setting it to ENABLE means that all of a table’s virtual columns are cached into the In-Memory area when the entire table or table partition is marked for In-Memory.
We’ll talk more about these two parameters in the following sections when discussing specific new features.
Dynamic Memory Area for In-Memory Objects
One of the limitations of the In-Memory feature in Oracle Database 12c Release 1 is that you can’t change the memory allocated for In-Memory (either up or down) using the INMEMORY_SIZE parameter. You wouldn’t want to allocate too little memory, knowing that you’d have a system downtime if newly added tables or columns needed to reside in the In-Memory area. Conversely, you wouldn’t want to over-allocate memory for In-Memory objects since any unused memory in the In-Memory area could not be used for anything but table columns.
In Oracle Database 12c Release 2, you have much more flexibility and can change the value of the INMEMORY_SIZE parameter dynamically. You can now start out with INMEMORY_SIZE on the low end and keep as much memory available for the rest of the SGA objects (shared pool, buffer cache) until needed by In-Memory. Here, you add 2 GB to the In-Memory area:

There are a few restrictions when resizing In-Memory, but most of them make sense:
![]() In-Memory must be enabled (INMEMORY_QUERY=ENABLE).
In-Memory must be enabled (INMEMORY_QUERY=ENABLE).
![]() The COMPATIBLE parameter must be 12.2.0 or higher.
The COMPATIBLE parameter must be 12.2.0 or higher.
![]() You cannot decrease the value of INMEMORY_SIZE dynamically.
You cannot decrease the value of INMEMORY_SIZE dynamically.
![]() You must be using an SPFILE to start the database.
You must be using an SPFILE to start the database.
![]() The increased size of the In-Memory area must be at least 128 MB.
The increased size of the In-Memory area must be at least 128 MB.
If you are not using an SPFILE to start the database, you must edit your PFILE and restart the instance. Even if you are using an SPFILE, you must restart the instance if you want to decrease the value of INMEMORY_SIZE.
New In-Memory Objects
Two new types of objects can reside in the In-Memory cache: query expressions and virtual columns. Your typical ad hoc or report query returns not only columns from one or more tables being joined but also the results of calculations against one or more columns. These calculations are generally arithmetic expressions (e.g., SALARY * 1.1) but can also be the result of single-row functions against one or more columns (e.g., COALESCE(LAST_NAME, FIRST_NAME, 'UNKNOWN'). The In-Memory cache now permits those types of expressions to be scanned and accessed just as quickly as any table column.
In addition, you may have one or more virtual columns defined on a table. These columns are now able to reside in the In-Memory cache. Virtual columns are very similar to query expressions in that some kind of transformation is occurring on another column in the same table, but there is a key distinction to query expressions: you don’t want every expression for every query to be cached by In-Memory. Query expressions, therefore, must have a bit more infrastructure around them, including how Oracle tracks “hot” expressions and how you can make sure that Oracle thinks that one or more of your expressions should reside in the In-Memory cache regardless of how popular it is.
Query Expressions
Query expressions, also known as In-Memory (IM) Expressions, add the full functionality of In-Memory columns to a wide range of expressions on table columns—and those table columns don’t even have to be in the IM Expression itself. If the results of your frequently evaluated expressions are expensive to calculate, participate in a join condition for tables already using In-Memory, or are often a predicate in a WHERE clause, then those expressions are good candidates for IM Expressions.
An expression that’s eligible for IM Expressions includes a combination of constants, single-row functions operating on table columns, arithmetic operators, and PL/SQL functions that return a value. Notice that columns are not eligible for IM Expressions—you can already put individual columns into the In-Memory cache using the existing ALTER TABLE syntax.
NOTE
PL/SQL functions must be defined as DETERMINISTIC to be eligible for the In-Memory cache.
Unlike tables whose columns are placed into the In-Memory cache by using the ALTER TABLE … INMEMORY MEMCOMPRESS statement, you use procedures in the DBMS_INMEMORY_ADMIN package to capture potential IM Expressions and populate the In-Memory cache. Here are the three procedures related to IM Expressions:
![]() IME_CAPTURE_EXPRESSIONS Given a specific time range, identify the 20 most frequently accessed expressions across all queries recently executed in the database.
IME_CAPTURE_EXPRESSIONS Given a specific time range, identify the 20 most frequently accessed expressions across all queries recently executed in the database.
![]() IME_POPULATE_EXPRESSIONS Take the expressions gathered by IME_CAPTURE_EXPRESSIONS and populate the IM Expression cache.
IME_POPULATE_EXPRESSIONS Take the expressions gathered by IME_CAPTURE_EXPRESSIONS and populate the IM Expression cache.
![]() IME_DROP_ALL_EXPRESSIONS Remove all populated expressions from the IM Expression cache.
IME_DROP_ALL_EXPRESSIONS Remove all populated expressions from the IM Expression cache.
The workflow for using IM Expressions is very straightforward. IM Expressions are implemented as virtual columns in a table: we’ll discuss explicitly defined virtual columns in the next section.
Virtual Columns
Oracle virtual columns have been available for any of your tables since Oracle Database 10g. Virtual tables are somewhat like a row-level view: the virtual column occupies no space in the table itself (only the metadata in the data dictionary). The column is treated like any other column would in a join or report, except that the value of the column is calculated “on the fly” whenever the row is retrieved from the database. The obvious advantage to virtual columns is that no additional disk space is required, but on the flip side, the column’s value must be recalculated every time it’s accessed.
In Oracle Database 12c Release 1, virtual columns cannot be in the In-Memory cache even if you mark the entire table as INMEMORY. In Oracle Database 12c Release 2, any expression including columns from the same table, SQL single-row functions, and user-defined functions declared as DETERMINISTIC can reside in the In-Memory cache right alongside the rest of the columns in the table. Once the virtual column is “materialized” in the In-Memory cache, it can participate in join operations and fast memory scans just like any column can.
However, what if you have a table with several virtual columns, but only want one or two to utilize the In-Memory cache? You can fine-tune the placement of virtual columns into the In-Memory cache by using the parameter INMEMORY_VIRTUAL_COLUMNS. By default, this parameter is set to MANUAL, which means that when a table is marked as INMEMORY it leaves behind the virtual columns. However, you can still explicitly mark a virtual column for In-Memory use in the ALTER TABLE … INMEMORY MEMCOMPRESS statement. If you want virtual columns to automatically populate the In-Memory cache along with the rest of the table columns when the table itself is marked as INMEMORY, set INMEMORY_VIRTUAL_COLUMNS to ENABLE.
NOTE
In Oracle Database 12c Release 2, you can mark a regular or virtual column as INMEMORY without marking the table as INMEMORY.
In-Memory FastStart
You shouldn’t have to restart your production database very often, but when you do, you lose all the information in the V$ views. Even worse, any tables or columns that occupied the In-Memory cache also have to be reloaded. Regardless of whether In-Memory tables are marked for high-priority population, on-demand, or just one column of that table, it could take minutes or even hours to get back the contents of the In-Memory tables given all the system activity that happens at startup. That results in yet another performance hit to queries that were relying on the contents of In-Memory.
If you have many tables residing in the In-Memory cache, and those tables rarely change, having the In-Memory cache repopulate more quickly is a huge advantage for the DBA who is already dealing with an unscheduled system restart. As a result, using the FastStart feature in Oracle Database 12c Release 2 you can designate a tablespace to hold the contents of the In-Memory cache that is continuously updated and available to repopulate the In-Memory cache when the instance is restarted.
Your initial thought may be that saving a copy of the In-Memory cache on disk is redundant or defeats the purpose of using In-Memory. However, the copy of the In-Memory cache on disk will occupy very little space—in fact, the amount of space occupied will be less than the size of your SGA. Once the FastStart area is updated after a new column or table is added to the In-Memory cache, there is virtually no activity against the tablespace until the database is restarted and the In-Memory cache can be reloaded from disk.
To manage the In-Memory FastStart functionality, you use several procedures in the DBMS_INMEMORY_ADMIN package:
![]() FASTSTART_ENABLE Enable FastStart and assign a tablespace to hold the contents of the In-Memory cache.
FASTSTART_ENABLE Enable FastStart and assign a tablespace to hold the contents of the In-Memory cache.
![]() FASTSTART_DISABLE Disable FastStart. The In-Memory cache will not be recoverable after an instance restart but the current state of the In-Memory cache is not changed.
FASTSTART_DISABLE Disable FastStart. The In-Memory cache will not be recoverable after an instance restart but the current state of the In-Memory cache is not changed.
![]() GET_FASTSTART_TABLESPACE Identify which tablespace is being used for FastStart.
GET_FASTSTART_TABLESPACE Identify which tablespace is being used for FastStart.
![]() FASTSTART_MIGRATE_STORAGE Move the copy of the In-Memory cache and its associated metadata to another tablespace.
FASTSTART_MIGRATE_STORAGE Move the copy of the In-Memory cache and its associated metadata to another tablespace.
Note that for the FASTSTART_ENABLE procedure, you can specify whether the LOB used for FastStart is created with the LOGGING or NOLOGGING attribute, much like you would specify LOGGING or NOLOGGING for a table.
Compress Join Groups
Much like the expression “no man is an island,” it is often true that no table stands alone in a query: you’ll more likely than not join that table to another. If all of those tables are marked as INMEMORY, you would assume that Oracle will perform the join completely from the In-Memory cache. However, if the compression types of the columns being joined are different, then a decompress operation must be performed before the join can occur. That’s still faster than reading the rows from disk and joining them. In this example, a table has three different types of In-Memory compression defined:

If the OBJECT_NAME column is joined to another table that has an OBJECT_NAME column but defined with an In-Memory attribute of FOR ARCHIVE LOW, the join operation will be delayed because the column in both tables must be decompressed to perform the join operation.
Oracle Database 12c Release 2 solves this dilemma by using join groups. A new object called a common dictionary is created in the In-Memory cache to maintain the mapping between sets of columns that are frequently joined. The common dictionary is created the first time you create a mapping. Here is how you would create the mapping between the OBJECT_NAME table in MY_OBJECTS and THEIR_OBJECTS:

Having the join group in place means that all operations occur directly on the compressed memory images. In addition, the join can use an array instead of building a hash table for the join. The data dictionary view DBA_JOINGROUPS shows that the join group has been instantiated:

Per-Process PGA Limits
Sometimes the PGA does not get as much attention as it should and is treated by Oracle as a bit player in an off-Broadway musical. Even though the PGA per client session might never reach the theoretical limit of 2 GB, in aggregate the PGA is using up memory on the database server, sometimes at a rate that can exceed that of the entire SGA. I’ve seen occasions where the simultaneous allocation of PGA for dozens of query sessions has taken down the database server because the DBA thought he had set PGA_AGGREGATE_TARGET and PGA_AGGREGATE_LIMIT high enough. Even PGA_AGGREGATE_LIMIT can be exceeded on a rare occasion.
Oracle Database Resource Manager is now capable of managing the use of the PGA at the session level. When creating the plan directive, you can set the SESSION_PGA_LIMIT parameter to control how much PGA memory a given session assigned to a consumer group is allowed to use. So, depending on the consumer group, a given session’s limit may well vary. This limit won’t apply to background or system processes, though it can have impacts on parallel queries and any jobs running via the Oracle Scheduler.
Summary
Many of the new performance features in Oracle 12c Release 2 appear at first glance to be extensions to existing features. But when you look more closely, many of these features don’t even resemble the features they extend!
The Optimizer Statistics Advisor keeps you honest and up to date with all current Oracle best practices. When you wander from a solid statistics collection configuration, Optimizer Statistics Advisor will even give you scripts to get your objects and statistics collection tasks back on track.
Index monitoring in Oracle Database 12c Release 2 is no longer a “yes/no” flag for each index. Each index now has a multitude of statistical information available on a continuous basis: how often it is accessed, how many rows were retrieved for each execution plan using the index, and when the index was used last. Having this metadata makes it much easier to decide if the index is worthy of the space it’s using on disk.
The In-Memory enhancements let you add new types of objects in addition to table columns. Virtual columns defined on a table can be added to the In-Memory cache one at a time or all at once. Frequently accessed expressions, called IM Expressions, are tracked on a continuous basis and can be populated into the In-Memory cache on demand. IM Expressions are much like virtual columns except that IM Expressions are not explicitly tied to a table and populate the In-Memory cache based on a popularity contest! The more often a query expression is referenced in a given timeframe, the more likely it is to end up as an IM Expression when you run the IME_POPULATE_EXPRESSIONS procedure.
Last, but not least, you can use the Resource Manager to more tightly control how much PGA a given session can use. PGA_AGGREGATE_LIMIT is just not granular enough to effectively allocate and manage one of the most critical memory areas in your database.