Query performance tuning is an important part of today's database applications. Often you can achieve large savings in both time and money with proper query performance tuning. Hardware performance is constantly improving, which can lead to an attitude suggesting that other methods of performance tuning are no longer important. Upgrades to SQL Server—especially to the optimizer, which helps determine how a query is executed, and the query engine, which executes the query—lead to better performance all on their own. The beauty of query performance tuning is that, in many cases, a small change to an index or a SQL query can result in a far more efficient application at a very low cost.
There are, however, many pitfalls for the unwary. As a result, a proven process is required to ensure that you correctly identify and resolve performance bottlenecks. To whet your appetite for the types of topics essential to honing your query optimization skills, here is a quick list of the query optimization aspects I cover in this book:
Identifying problematic SQL queries
Analyzing a query execution plan
Evaluating the effectiveness of the current indexes
Avoiding bookmark lookups
Evaluating the effectiveness of the current statistics
Analyzing and resolving fragmentation
Optimizing execution plan caching
Analyzing and avoiding stored procedure recompilation
Minimizing blocking and deadlocks
Analyzing the effectiveness of cursor use
Applying performance-tuning processes, tools, and optimization techniques to optimize SQL workload
Before jumping straight in to these topics, let's first examine why we go about performance tuning the way we do. In this chapter, I discuss the basic concepts of performance tuning for a SQL Server database system. I detail the main performance bottlenecks and show just how important it is to design a database-friendly application, which is the consumer of the data, as well as how to optimize the database. Specifically, I cover the following topics:
The performance-tuning process consists of identifying performance bottlenecks, troubleshooting their causes, applying different resolutions, and then quantifying performance improvements. It is necessary to be a little creative, since most of the time there is no one silver bullet to improve performance. The challenge is to narrow down the list of possible causes and evaluate the effects of different resolutions. You can even undo modifications as you iterate through the tuning process.
During the tuning process, you must examine various hardware and software factors that can affect the performance of a SQL Server-based application. You should be asking yourself the following general questions during the performance analysis:
Is any other resource-intensive application running on the same server?
Is the hardware subsystem capable of withstanding the maximum workload?
Is SQL Server configured properly?
Is the database connection between SQL Server and the database application efficient?
Does the database design support the fastest data retrieval (and modification for an updatable database)?
Is the user workload, consisting of SQL queries, optimized to reduce the load on SQL Server?
What processes are causing the system to slow down as reflected in the measurement of various wait states?
Does the workload support the maximum concurrency?
If any of these factors is not configured properly, then the overall system performance may suffer. Let's briefly examine these factors.
Having another resource-intensive application on the same server can limit the resources available to SQL Server. Even an application running as a service can consume a good part of the system resources and limit the resources available to SQL Server. For example, running Windows Task Manager continuously on the server is not recommended. Windows Task Manager is also an application, taskmgr.exe, which runs at a higher priority than the SQL Server process. Priority is the weight given to a resource that pushes the processor to give it greater preference when executing. To determine the priority of a process, follow these steps:
Launch Windows Task Manager.
Select View

Select the Base Priority check box.
Click the OK button.
These steps will add the Base Priority column to the list of processes. Subsequently, you will be able to determine that the SQL Server process (sqlservr.exe) by default runs at Normal priority, whereas the Windows Task Manager process (taskmgr.exe) runs at High priority. Therefore, to allow SQL Server to maximize the use of available resources, you should look for all the nonessential applications/services running on the SQL Server machine and ensure that they are not acting as resource hogs.
Improperly configuring the hardware can prevent SQL Server from gaining the maximum benefit from the available resources. The main hardware resources to be considered are processor, memory, disk, and network. For example, in a server with more than 4GB of memory, an improper memory configuration will prevent SQL Server from using the memory beyond 4GB. Furthermore, if the capacity of a particular resource is small, then it can soon become a performance bottleneck for SQL Server. Chapter 2 covers these hardware bottlenecks in detail.
You should also look at the configuration of SQL Server, since proper configuration is essential for an optimized application. There is a long list of SQL Server configurations that define the generic behavior of a SQL Server installation. These configurations can be viewed and modified using a system stored procedure, sp_configure. Many of these configurations can be managed interactively through SQL Server Enterprise Manager.
Since the SQL Server configurations are applicable for the complete SQL Server installation, a standard configuration is usually preferred. The good news is that, generally, you need not modify these configurations; the default settings work best for most situations. In fact, the general recommendation is to keep the SQL Server configurations at the default values. I discuss the configuration parameters in detail throughout the book.
Poor connectivity between SQL Server and the database application can hurt application performance. One of the questions you should ask yourself is, How good is the database connection? For example, the query executed by the application may be highly optimized, but the database connection used to submit this query may add considerable overhead to the query performance. Based on the distribution of the application and the database, different network protocols should be used to reduce the network overhead. Additionally, the data access layer used to manage the database connectivity above the network connection may not be efficient. The data access layer technology or the way the data access layer is used by the application may not be optimal.
The design of the database should also be analyzed while troubleshooting performance. This helps you understand not only the entity-relationship model of the database but also why a query may be written in a certain way. Although it may not always be possible to modify a database design because of wider implications on the database application, a good understanding of the database design helps you focus in the right direction and understand the impact of a resolution. This is especially true of the primary and foreign keys and the clustered indexes used in the tables.
The application may be slow because of poorly built queries, the queries might not be able to use the indexes, or perhaps even the indexes themselves are incorrect or missing. If any of the queries are not optimized sufficiently, they can seriously impact other queries' performance. I cover index optimization in depth in Chapters 3, 4, 5, and 6. The next question at this stage should be, Is a query slow because of its resource intensiveness or because of concurrency issues with other queries? You can find in-depth information on blocking analysis in Chapter 12.
When processes run on a server, even one with multiple processors, at times one process will be waiting on another to complete. You can get a fundamental understanding of the root cause of slowdowns by identifying what is waiting and what is causing it to wait. You can realize this through operating system counters that you access through dynamic management views within SQL Server. I cover this information in Chapter 2 and in Chapter 12.
The challenge is to find out which factor is causing the performance bottleneck. For example, with slow-running SQL queries and high pressure on the hardware resources, you may find that both poor database design and a nonoptimized workload are to blame. In such a case, you must diagnose the symptoms further and correlate the findings with possible causes. Because performance tuning can be time consuming and tiresome, you should ideally take a preventive approach by designing the system for optimum performance from the outset.
To strengthen the preventive approach, every lesson that you learn during the optimization of poor performance should be considered an optimization guideline when implementing new database applications. There are also proven best practices that you should consider while implementing database applications. I present these best practices in detail throughout the book, and Chapter 18 is dedicated to outlining many of the optimization best practices.
Please ensure that you take the performance optimization techniques into consideration at the early stages of your database application development. Doing so will help you roll out your database projects without big surprises later.
Unfortunately, we rarely live up to this ideal and often find database applications needing performance tuning. Therefore, it is important to understand not only how to improve the performance of a SQL Server-based application but also how to diagnose the causes of poor performance.
Performance tuning is an iterative process, where you identify major bottlenecks, attempt to resolve them, measure the impact of your changes, and return to the first step until performance is acceptable. While applying your solutions, you should follow the golden rule of making only one change at a time. Any change usually affects other parts of the system, so you must reevaluate the effect of each change on the performance of the overall system.
As an example, adding an index may fix the performance of a specific query, but it could cause other queries to run more slowly, as explained in Chapter 4. Consequently, it is preferable to conduct a performance analysis in a test environment to shield users from your diagnosis attempts and intermediate optimization steps. In such a case, evaluating one change at a time also helps in prioritizing the implementation order of the changes on the production server, based on their relative contributions.
You can keep on chipping away at performance bottlenecks and improving the system performance gradually. Initially, you will be able to resolve big performance bottlenecks and achieve significant performance improvements, but as you proceed through the iterations, your returns will gradually diminish. Therefore, to use your time efficiently, it is worthwhile to quantify the performance objectives first (for example, an 80 percent reduction in the time taken for a certain query, with no adverse effect anywhere else on the server) and then work toward them.
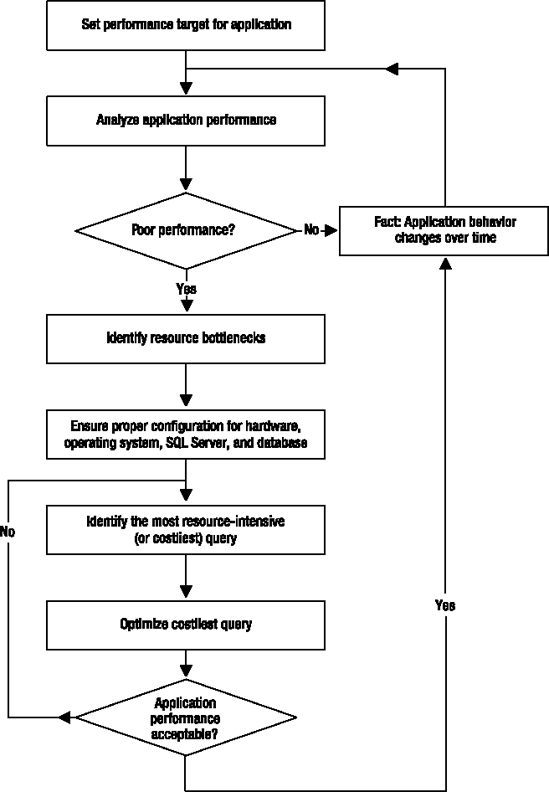
The performance of a SQL Server application is highly dependent on the amount and distribution of user activity (or workload) and data. Both the amount and distribution of workload and data change over time, and differing data can cause SQL Server to execute SQL queries differently. The performance resolution applicable for a certain workload and data may lose its effect over a period of time. Therefore, to ensure an optimum system performance on a continuing basis, you will need to analyze performance at regular intervals. Performance tuning is a never-ending process, as shown in Figure 1-1.
You can see that the steps to optimize the costliest query make for a complex process, which also requires multiple iterations to troubleshoot the performance issues within the query and apply one change at a time. Figure 1-2 shows the steps involved in the optimization of the costliest query.
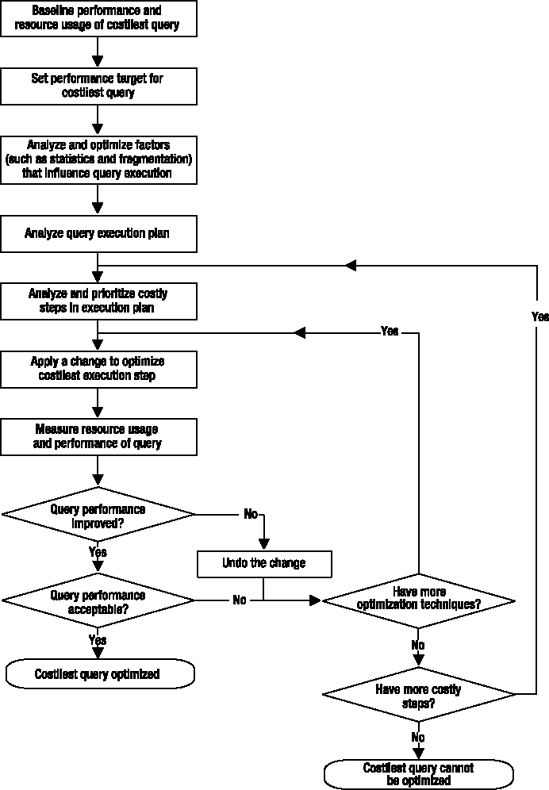
As you can see from this process, there is quite a lot to do to ensure that you correctly tune the performance of a given query. It is important to use a solid process like this in performance tuning to focus on the main identified issues.
Having said this, it also helps to keep a broader perspective about the problem as a whole, since sometimes you may believe that you are trying to solve the correct performance bottleneck when in reality something else is causing the problem.
One of the points I touched on earlier is that to gain increasingly small performance increments, you need to spend increasingly large amounts of time and money. Therefore, to ensure the best return on your investment, you should be very objective while optimizing performance. Always consider the following two aspects:
What is the acceptable performance for your application?
Is the investment worth the performance gain?
To derive maximum efficiency, you must realistically estimate your performance requirements. You can follow many best practices to improve performance—for example, you can have your database files on the most efficient disk subsystem. However, before applying a best practice, you should consider how much you may gain from it and whether the gain will be worth the investment.
Sometimes it is really difficult to estimate the performance gain without actually making the enhancement. That makes properly identifying the source of your performance bottlenecks even more important. Are you CPU, memory, or disk bound? Is the cause code, data structure, or indexing, or are you simply at the limit of your hardware? Be sure you can make these possibly costly decisions from a known point rather than guessing. A practical approach can be to increase a resource in increments and analyze the application's scalability with the added resource. A scalable application will proportionately benefit from an incremental increase of the resource, if the resource was truly causing the scalability bottleneck. If the results appear to be satisfactory, then you can commit to the full enhancement. Experience also plays a very important role here.
Instead of tuning a system to the theoretical maximum performance, the goal should be to tune until the system performance is "good enough." This is a commonly adopted performance-tuning approach. The cost investment after such a point usually increases exponentially in comparison to the performance gain. The 80:20 rule works very well: by investing 20 percent of your resources, you may get 80 percent of the possible performance enhancement, but for the remaining 20 percent possible performance gain, you may have to invest an additional 80 percent of resources. It is therefore important to be realistic when setting your performance objectives.
A business benefits not by considering pure performance but by considering price performance. However, if the target is to find the scalability limit of your application (for various reasons, including marketing the product against its competitors), then it may be worthwhile investing as much as you can. Even in such cases, using a third-party stress test lab may be a better investment decision.
One of the main objectives of performance analysis is to understand the underlying level of system use or pressure on different hardware and software subsystems. This knowledge helps you in the following ways:
Allows you to analyze resource bottlenecks.
Enables you to troubleshoot by comparing system utilization patterns with a preestablished baseline.
Assists you in making accurate estimates in capacity planning and scheduling hardware upgrades.
Aids you in identifying low-utilization periods when the database administrative activities can be executed.
Helps you estimate the nature of possible hardware downsizing or server consolidation. Why would a company downsize? Well, in the past, some companies leased very high-end systems expecting strong growth, but because of poor growth, they are now forced to downsize their system setups. And consolidation? Companies may sometimes buy too many servers or realize that the maintenance and licensing costs are too high. This would make using fewer servers very attractive.
Therefore, to better understand your application's resource requirements, you should create a baseline for your application's hardware and software usage. A baseline serves as a statistic of your system's current usage pattern and as a reference with which to compare future statistics. Baseline analysis helps you understand your application's behavior during a stable period, how hardware resources are used during such periods, and what the software characteristics are. With a baseline in place, you can do the following:
Measure current performance and express your application's performance goals.
Compare other hardware or software combinations against the baseline.
Measure how the workload and/or data changes over time.
Evaluate the peak and nonpeak usage pattern of the application. This information can be used to effectively distribute database administration activities, such as full database backup and database defragmentation during nonpeak hours.
You can use the System Monitor tool (also referred to as Performance Monitor) to create a baseline for SQL Server's hardware and software resource utilization. Similarly, you may baseline the SQL Server workload using the SQL Profiler tool, which can help you understand the average resource utilization and execution time of SQL queries when conditions are stable. You can also get snapshots of this information by using dynamic management views and dynamic management functions. You will learn in detail how to use these tools and queries in Chapters 2 and 3.
One other option is to take advantage of one of the many tools that can generate an artificial load on a given server or database. Numerous third-party tools are available. Microsoft offers SQLIO (available at http://www.microsoft.com/downloads/details.aspx?familyid=9a8b005b-84e4-4f24-8d65-cb53442d9e19&displaylang=en), which measures the I/O capacity of your system. Microsoft also has SQLIOSim, a tool for generating SQL Server-specific calls and simulated loads (available at http://download.microsoft.com/download/3/8/0/3804cb1c-a911-4d12-8525-e5780197e0b5/SQLIOSimX86.exe). Many third-party tools are available that can also help with this. If your system is not yet in production, using one of these tools to simulate a load to test the system is a very good idea.
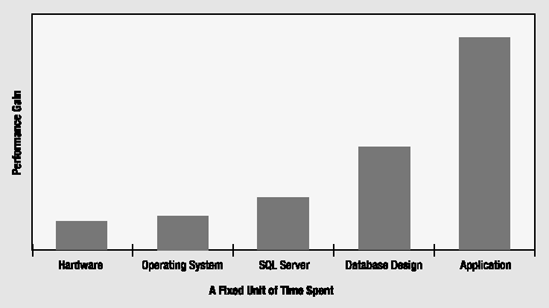
When you tune a particular system, pay special attention to the application layer (the database queries and stored procedures executed by Visual Basic/ADO or otherwise that are used to access the database). You will usually find that you can positively affect performance in the application layer far more than if you spend an equal amount of time figuring out how to tune the hardware, operating system, or SQL Server configuration. Although a proper configuration of hardware, operating system, and SQL Server is essential for the best performance of a database application, these fields have standardized so much that you usually need to spend only a limited amount of time configuring them properly for performance. Application design issues such as query design and indexing strategies, on the other hand, are application dependent. Consequently, there is usually more to optimize in the application layer than in the hardware, operating system, or SQL Server configuration. Thus, for a unit of time spent in each area, work in the application layer usually yields the maximum performance benefit, as illustrated in Figure 1-3.
In my experience, you can obtain the greatest improvement in database application performance by looking first at the area of application design, including logical/physical database design, query design, and index design.
Sure, if you concentrate on hardware configuration and upgrades, you may obtain a satisfactory performance gain. However, a bad SQL query sent by the application can consume all the hardware resources available, no matter how much you have. Therefore, a poor application design can make the hardware upgrade requirements very high, even beyond your limits. In the presence of a heavy SQL workload, concentrating on hardware configurations and upgrades usually produces a poor return on investment.
You should analyze the stress created by an application on a SQL Server database at two levels:
High level: Analyze how much stress the database application is creating on individual hardware resources and what the overall behavior of the SQL Server installation is. The best measures for this are the various wait states. This information can help you in two ways. First, it helps you identify the area to concentrate on within a SQL Server application where there is poor performance. Second, it helps you identify any lack of proper configuration at the higher levels. You can then decide which hardware resource may be upgraded if you are not able to tune the application using the Performance Monitor tool, as explained in Chapter 2.
Low level: Identify the exact culprits within the application—in other words, the SQL queries that are creating most of the pressure visible at the overall higher level. This can be done using the SQL Profiler tool and various dynamic management views, as explained in Chapter 3.
Let's now consider the major problem areas that can degrade SQL Server performance. By being aware of the main performance killers in SQL Server in advance, you will be able to focus your tuning efforts on the likely causes.
Once you have optimized the hardware, operating system, and SQL Server settings, the main performance killers in SQL Server are as follows, in a rough order (with the worst appearing first):
Poor indexing
Inaccurate statistics
Excessive blocking and deadlocks
Non-set-based operations, usually T-SQL cursors
Poor query design
Poor database design
Excessive fragmentation
Nonreusable execution plans
Poor execution plans, usually caused by parameter sniffing
Frequent recompilation of execution plans
Improper use of cursors
Improper configuration of the database log
Excessive use or improper configuration of
tempdb
Let's take a quick look at each of these, before considering them in more depth in later chapters.
Poor indexing is usually one of the biggest performance killers in SQL Server. In the absence of proper indexing for a query, SQL Server has to retrieve and process much more data while executing the query. This causes high amounts of stress on the disk, memory, and CPU, increasing the query execution time significantly. Increased query execution time then leads to excessive blocking and deadlocks in SQL Server. You will learn how to determine the indexing strategies and resolve indexing problems in Chapters 4, 5, and 6.
Generally, indexes are considered to be the responsibility of the database administrator (DBA). However, the DBA cannot define how to use the indexes, since the use of indexes is determined by the database queries and stored procedures written by the developers. Therefore, defining the indexes must be a shared responsibility since the developers usually have more knowledge of the data to be retrieved and the DBAs have a better understanding of how indexes work. Indexes created without the knowledge of the queries serve little purpose.
Note
Because indexes created without the knowledge of the queries serve little purpose, database developers need to understand indexes at least as well as they know T-SQL.
SQL Server relies heavily on cost-based optimization, so accurate data-distribution statistics are extremely important for the effective use of indexes. Without accurate statistics, SQL Server's built-in query optimizer cannot accurately estimate the number of rows affected by a query. Because the amount of data to be retrieved from a table is highly important in deciding how to optimize the query execution, the query optimizer is much less effective if the data distribution statistics are not maintained accurately. You will look at how to analyze statistics in Chapter 7.
Because SQL Server is fully atomicity, consistency, isolation, and durability (ACID) compliant, the database engine ensures that modifications made by concurrent transactions are properly isolated from one another. By default, a transaction sees the data either in the state before another concurrent transaction modified the data or after the other transaction completed—it does not see an intermediate state.
Because of this isolation, when multiple transactions try to access a common resource concurrently in a noncompatible way, blocking occurs in the database. A deadlock occurs when two resources attempt to escalate or expand locked resources and conflict with one another. The query engine determines which process is the least costly to roll back and chooses it as the deadlock victim. This requires that the database request be resubmitted for successful execution. The execution time of a query is adversely affected by the amount of blocking and deadlock it faces.
For scalable performance of a multiuser database application, properly controlling the isolation levels and transaction scopes of the queries to minimize blocking and deadlock is critical; otherwise, the execution time of the queries will increase significantly, even though the hardware resources may be highly underutilized. I cover this problem in depth in Chapters 12 and 13.
Transact-SQL is a set-based scripting language, which means it operates on sets of data. This forces you to think in terms of columns rather than in terms of rows. Non-set-based thinking leads to excessive use of cursors and loops rather than exploring more efficient joins and subqueries. The T-SQL language offers rich mechanisms for manipulating sets of data. For performance to shine, you need to take advantage of these mechanisms rather than trying to force a row-by-row approach to your code, which will kill performance. Examples of how to do this are available throughout the book; also, I address T-SQL best practices in Chapter 11 and cursors in Chapter 14.
The effectiveness of indexes depends entirely on the way you write SQL queries. Retrieving excessively large numbers of rows from a table, or specifying a filter criterion that returns a larger result set from a table than is required, renders the indexes ineffective. To improve performance, you must ensure that the SQL queries are written to make the best use of new or existing indexes. Failing to write cost-effective SQL queries may prevent SQL Server from choosing proper indexes, which increases query execution time and database blocking. Chapter 11 covers how to write effective queries.
Query design covers not only single queries but also sets of queries often used to implement database functionalities such as a queue management among queue readers and writers. Even when the performance of individual queries used in the design is fine, the overall performance of the database can be very poor. Resolving this kind of bottleneck requires a broad understanding of different characteristics of SQL Server, which can affect the performance of database functionalities. You will see how to design effective database functionality using SQL queries throughout the book.
A database should be adequately normalized to increase the performance of data retrieval and reduce blocking. For example, if you have an undernormalized database with customer and order information in the same table, then the customer information will be repeated in all the order rows of the customer. This repetition of information in every row will increase the I/Os required to fetch all the orders placed by a customer. At the same time, a data writer working on a customer's order will reserve all the rows that include the customer information and thus block all other data writers/data readers trying to access the customer profile.
Overnormalization of a database is as bad as undernormalization. Overnormalization increases the number and complexity of joins required to retrieve data. An overnormalized database contains a large number of tables with a very small number of columns.
Having too many joins in a query may also be because database entities have not been partitioned very distinctly or the query is serving a very complex set of requirements that could perhaps be better served by creating a new view or stored procedure.
Database design is a large subject. I will provide a few pointers in Chapter 18 and throughout the rest of the book. Because of the size of the topic, I won't be able to treat it in the complete manner it requires. However, if you want to read a book on database design, with an emphasis on introducing the subject, I recommend reading Data Modeling for Everyone by Sharon Allen (Apress, 2003).
While analyzing data retrieval operations, you can usually assume that the data is organized in an orderly way, as indicated by the index used by the data retrieval operation. However, if the pages containing the data are fragmented in a nonorderly fashion or if they contain a small amount of data because of frequent page splits, then the number of read operations required by the data retrieval operation will be much higher than might otherwise be required. The increase in the number of read operations caused by fragmentation hurts query performance. In Chapter 8, you will learn how to analyze and remove fragmentation.
To execute a query in an efficient way, SQL Server's query optimizer spends a fair amount of CPU cycles creating a cost-effective execution plan. The good news is that the plan is cached in memory, so you can reuse it once created. However, if the plan is designed so that you cannot plug variable values into it, SQL Server creates a new execution plan every time the same query is resubmitted with different variable values. So, for better performance, it is extremely important to submit SQL queries in forms that help SQL Server cache and reuse the execution plans. I will also address topics such as plan freezing, forcing query plans, and the problems associated with parameter sniffing. You will see in detail how to improve the reusability of execution plans in Chapter 9.
The same mechanisms that allow SQL Server to establish an efficient stored procedure and reuse that procedure again and again instead of recompiling can, in some cases, work against you. A bad execution plan can be a real performance killer. Bad plans are frequently caused by a process called parameter sniffing, which comes from the mechanisms that the query optimizer uses to determine the best plan based on statistics. It's important to understand how statistics and parameters combine to create execution plans and what you can do to control them. I cover statistics in depth in Chapter 7 and execution plan analysis in Chapter 9.
One of the standard ways of ensuring a reusable execution plan, independent of variable values used in a query, is to use a stored procedure. Using a stored procedure to execute a set of SQL queries allows SQL Server to create a parameterized execution plan.
A parameterized execution plan is independent of the parameter values supplied during the execution of the stored procedure, and it is consequently highly reusable. However, the execution plan of the stored procedure can be reused only if SQL Server does not have to recompile the execution plan every time the stored procedure is run. Frequent recompilation of a stored procedure increases pressure on the CPU and the query execution time. SQL Server has partially addressed this problem with the addition of statement-level recompilation, but it's not a complete fix to the issue. I will discuss in detail the various causes and resolutions of stored procedure, and statement, recompilation in Chapter 10.
By preferring a cursor-based (row-at-a-time) result set—or as Jeff Moden has so aptly termed it, Row By Agonizing Row (RBAR; pronounced "ree-bar")—instead of a regular set-based SQL query, you add a large amount of overhead on SQL Server. Use set-based queries whenever possible, but if you are forced to deal with cursors, be sure to use efficient cursor types such as fast-forward only. Excessive use of inefficient cursors increases stress on SQL Server resources, slowing down system performance. I discuss how to work with cursors, if you must, properly in Chapter 14.
By failing to follow the general recommendations in configuring a database log, you can adversely affect the performance of an Online Transaction Processing (OLTP)–based SQL Server database. For optimal performance, SQL Server heavily relies on accessing the database logs effectively.
Chapter 2 covers how to configure the database log properly.
There is only one tempdb for any SQL Server instance. Since temporary storage such as operations involving user objects such as temporary tables and table variables, system objects such as cursors or hash tables for joins, and operations such as sorts and row versioning all use the tempdb database, tempdb can become quite a bottleneck. All these options and others that you can use lead to space, I/O, and contention issues within tempdb. I cover some configuration options to help with this in Chapter 2 and other options in other chapters appropriate to the issues addressed by that chapter.
In this introductory chapter, you have seen that SQL Server performance tuning is an iterative process, consisting of identifying performance bottlenecks, troubleshooting their cause, applying different resolutions, quantifying performance improvements, and then going back to the start until your required performance level is reached.
To assist in this process, you should create a system baseline to compare with your modifications. Throughout the performance-tuning process, you need to be very objective about the amount of tuning you want to perform—you can always make a query run a little bit faster, but is the effort worth the cost? Finally, since performance depends on the pattern of user activity and data, you must reevaluate the database server performance on a regular basis.
To derive the optimal performance from a SQL Server database system, it is extremely important that you understand the stresses on the server created by the database application. In the next two chapters, I discuss how to analyze these stresses, both at a higher system level and at a lower SQL Server activities level. Then I show how to combine the two.
In the rest of the book, you will examine in depth the biggest SQL Server performance killers, as mentioned earlier in the chapter. You will learn how these individual factors can affect performance if used incorrectly and how to resolve or avoid these traps.