
PowerPivot is an exciting combination of improvements to Microsoft Excel that enable you to do your own data analysis and mining from your desktop. You can connect to a database, pull data down into Excel, perform analysis on that data, and push the results back up to your server for others in your organization to view. PowerPivot provides extraordinary functionality, giving you full control over your data analysis and mining efforts.
PowerPivot is closely linked to SQL Server. It depends on some key features that are new in SQL Server 2008 Release 2 (R2). Before looking at PowerPivot, it's worth getting familiar with the key features that form its foundation.
About two years after the launch of SQL Server 2008, Microsoft released SQL Server 2008 R2. This launch was in conjunction with Office 2010 and SharePoint Server 2010 as part of a "business intelligence wave." The biggest changes we're interested in are as follows:
- Master Data Services:
A centralized repository for business data, such as product lists, office locations, customers, and so forth.
- VertiPaq mode:
A new way of installing an Analysis Services instance that is oriented toward in-memory storage so that queries can be answered in real time. Also referred to as PowerPivot for SharePoint, this provides a new layer in the business intelligence structure, for self-service BI.
- Excel writeback:
We discussed writeback previously, but one problem we had was that there was no real client that could write back to SSAS cubes. Excel 2010 has writeback capabilities, opening some interesting new doors for what-if analysis.
We're going to provide a brief overview of Master Data Services. Because the technology is so new, it's still a little "wait and see," especially from the perspective of Analysis Services. Then we'll take a deep dive into PowerPivot, and finally look at Excel Writeback and what it can do for us.
Much of our discussion about SQL Server Analysis Services has been around the idea of "one version of the truth." However, on occasion we may create our own stovepipe in the data warehouse. We want the dimensions and their members to be representative of the business, but we're either pulling them from a random business system or setting them up in the EDW ourselves. Although this is great for our BI system, it can be problematic for other business systems that may want to reflect the same structure.
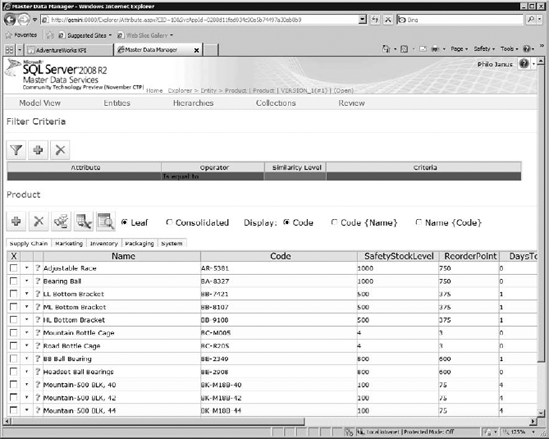
Master Data Services (MDS), a new feature in SQL Server 2008 R2, provides a central repository for the canonical data of an organization. It's an answer to part of the problem with stovepipes, in which each stovepipe refers to some aspect of the business in a different way. It also provides the data of record for new systems being designed (as opposed to spending an entire four-hour meeting on "we have three customer lists—which one is the right one?").
Figure 12-1 shows the data management interface for Master Data Services.
Note
MDS is a separate installation from SQL Server 2008 R2. You can find the installer, MasterDataServices.msi, in the installation media for SQL Server 2008 R2.
So the question is—why do you, the Analysis Services DBA, care? If MDS is being implemented as a master data repository, you should plan to take advantage of it for any and all dimensions that use master data. It's possible to use the MDS database as a data source for a dimension, but the problem is that changes to MDS may happen without warning, which would cause serious problems with the relationships between the dimensions and the fact data. There is version data in the MDS schema, so it would be possible to filter by a specific version; then subsequent changes wouldn't affect the dimension until the DBA deals with it.
There is an alternative approach: MDS has a robust business rule engine, which can activate and pass data to a SharePoint workflow. As a result, you could design a workflow to be kicked off when the master data you are tracking for a dimension changes. Perhaps if the change doesn't affect fact data, you could allow the workflow to make the change in place; otherwise, send a notification to the DBAs. Alternatively, you could have the workflow follow an approval chain in which responsible DBAs indicate to either process the change, or to log and hold it until they can evaluate the changes.
Master data management is a field unto itself, and the handling of Master Data Services will evolve as the technology in SQL Server matures. For more information on master data management, especially the business aspects of MDM, I recommend Master Data Management by David Loshin (Morgan Kaufmann, 2008). For technical information, the best starting point is always the Books Online: http://msdn.microsoft.com/en-us/library/ee633763(SQL.105).aspx.
We've discussed writeback to some degree, regarding the ability to change dimensions and edit fact data. In Excel 2010 we have the ability to edit cube fact data directly from Excel. Well, we don't actually edit the fact data; what happens is that when we enable writeback on a cube partition, Analysis Services creates a table in the underlying data source, and a writeback partition in the cube. Then when queries are performed against the fact table that has a parallel writeback partition, the values are combined on the fly.
Writeback is enabled in the Partitions tab of the Cube Designer; right-click on a partition and select Writeback Settings to enable writeback. This will create a writeback partition related to the main partition. That writeback "partition" will actually map to a table in one of the data sources (if you want the writeback tables kept in a unique location, obviously you can create a data source for writeback tables). Analysis Services stores the difference value in the table, along with the user that entered it and a timestamp.
Note
You can enable writeback only on a partition where all the measures are aggregated with the SUM function. The big gotcha here is that by default, measure groups usually have a COUNT member.
After changes have been made via writeback, they will be seen by any other user querying the cube. After you've written data back to the database, there are three follow-up actions that you can take:
- Convert to Partition:
This makes the writeback changes a permanent part of the cube. This is accomplished by right-clicking on the writeback partition and selecting Convert to Partition.
- Clear Writeback Data:
Deleting the contents of the writeback table effectively "resets" the writeback data. Just remember that the same table is used by all users!
- Disable Writeback:
Right-clicking on the writeback partition in the Partitions tab and selecting Writeback Settings brings up the Disable Writeback dialog box. Clicking OK disables writeback for that partition.
Because every user sees the writeback data, your having these three choices can be problematic if a user is changing values for what-if scenarios. The best solution is to have a Scenario dimension. For those users who need to perform writeback analysis, you can give them control over the Scenario dimension. (That dimension can even have a user-based hierarchy.) Any other user can have a default member of Actuals, with no writeback abilities to the dimension.
Let's take Excel's new writeback capability for a spin. Follow the instructions in Exercise 12-1 to experience writeback for yourself.
Use Excel Writeback
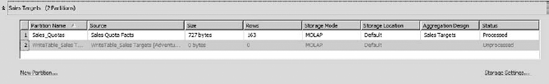
Ensure that Writeback is enabled on the Sales Targets partition in the AdventureWorks cube, as shown in Figure 12-2.
Open Excel 2010.
Click the Data tab in the Ribbon.
In the Get External Data panel, click From Other Sources and then select From Analysis Services.
Enter the Server name and then click Next.
Select the AdventureWorks cube and then click Next.
Click Finish to close the Data Connection dialog box. When the Import Data dialog box opens, leave the default selection of PivotTable Report and click OK.
After the pivot table is created, in the Pivot Table Field List select Sales Amount Quota.
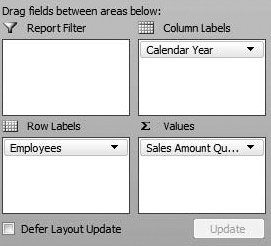
Under the Date dimension, open the Calendar folder, and drag Date.Calendar Year to the Column Labels area.
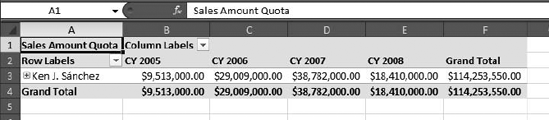
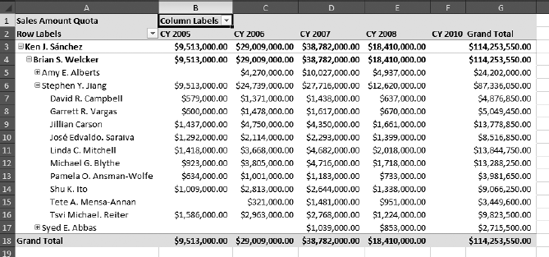
Under the Employee dimension, drag Employees to Row Labels. The setup should look like Figure 12-3, and the resulting pivot table should look like Figure 12-4.
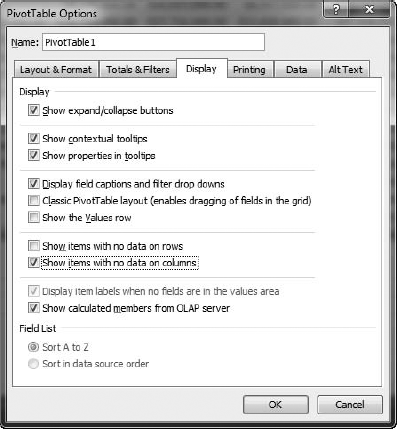
Right-click on the cell labeled Column Labels and select PivotTable Options to open the PivotTable Options dialog box.
Click the Display tab, as shown in Figure 12-5, and select the Show Items with No Data on Columns check box.
Click OK. This shows the CY 2010 member of the Date dimension.
Open the Employees tree to show Stephen Jiang's subordinates. The pivot table should now look like Figure 12-6.
Now in the Ribbon, under PivotTable Tools/Options, click the What-If Analysis option and then select Enable What-If Analysis.
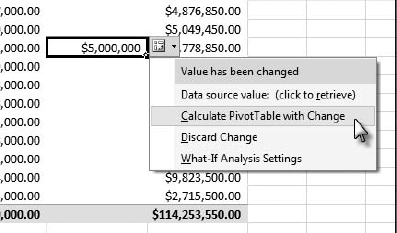
In the CY 2010 column for Jillian Carson, enter $5,000,000.
Note the little tag that appears in the lower right of the cell. If you click on the cell, you'll get a context button. Click it to see the context menu shown in Figure 12-7.
Select Calculate PivotTable with Change. Note that the $5,000,000 value has been propagated up the hierarchy, totaled for CY 2010, and added to the Grand Total for Jillian.
At this point, the changes exist only in Excel. If anyone else queried the cube, that person would still see the underlying values. If we didn't want to keep this result, we could select Discard Change, or use the Discard Changes option on the What-If option in the Ribbon to discard all the session values.
Now let's select Publish Changes from the What-If Analysis button. This commits our writeback changes to the cube, and they will show up for anyone else running a cube report.
Let's look at our "written back" data. Open SQL Server Management Studio.
Connect to the AdventureWorksDW2008R2 database. This should be the data source for your cube. Look for the table named dbo.WriteTable_Sales Targets.
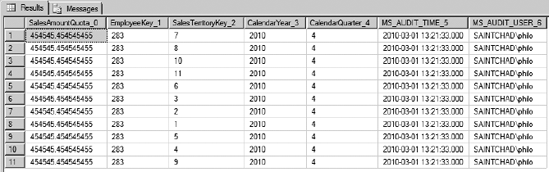
Right-click on the table and select Select Top 1000 Rows to view the contents of the table. You should see something like Figure 12-8.
The EmployeeKey is the Primary Key (PK) for Jillian. CalendarYear looks like we expect, as does Quarter. But what are those values, and why are the Sales Territory keys all over the place? Well, remember that we didn't select a territory, so Excel indicated to Analysis Services to spread the values between the territories. There are 11 territories, and 5,000,000 / 11 = 454,545.4545.
As I mentioned previously, Analysis Services will now seamlessly combine these values with the cube values for anyone who browses the cube. If you want to drop the writeback data, the simplest way is to simply delete the records from this table. (Yes, this is nontrivial, but there isn't an easy client tool for this at this time.)
Although this was a very simplistic solution, you can imagine more-complex cubes, and adding formulas on the Excel side to perform what-if analysis on stock levels, consultant hourly rates, quotas, and so on.
That covers the essentials of Excel writeback capabilities. As you can see, it's a fairly straightforward feature, but an incredibly powerful tool in the analyst's toolbox. Writeback is simply part of Excel 2010 out of the box, and requires SQL Server Enterprise Edition on the server side, but those are the only special requirements. For real analytic power on the desktop, let's talk about PowerPivot.
Of course the biggest news in SQL Server 2008 R2 (in fact, the whole reason for the release) is the new PowerPivot functionality. PowerPivot is the next logical step in eliminating spreadmarts, or the use of Excel as a database/data mart. PowerPivot is a combination of the following:
What PowerPivot enables the user to do is to design a cube with data sources in Excel, and work with that cube in pivot tables and pivot charts just as if it were an Analysis Services cube. In addition, an analyst can publish an Excel workbook with PowerPivot cube(s) to a SharePoint Server that has been provisioned with Analysis Services, Excel Services, and PowerPivot. After an Excel workbook with a PowerPivot cube has been published, it can be used as a data source by any client that can connect to Analysis Services.
Note
In VertiPaq mode, SQL Server Analysis Services runs as an in-memory service, and keeps all its cubes in memory for rapid query response. Furthermore, you cannot publish solutions from BIDS. A VertiPaq SSAS instance is intended solely to service PowerPivot databases.
The Excel add-in for PowerPivot is simply a free download from Microsoft.com. The best way to find it is to start at www.powerpivot.com/download.aspx, which has links to both the 32-bit and 64-bit versions of the Excel add-in.
Note
The 32-bit or 64-bit versions are with respect to what bitness of Excel you installed, not the operating system. If you have 32-bit (x86) Excel running on 64-bit (x64) Windows 7, then use the 32-bit add-in.
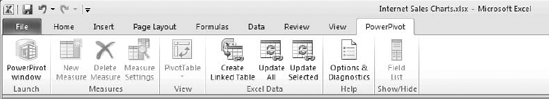
The Excel client adds a tab to the Ribbon for PowerPivot, as shown in Figure 12-9. This is used for managing the PowerPivot client. Think of PowerPivot as a cube running under Excel—the PowerPivot tab gives you access to the designer, and enables you to create calculated measures from the underlying data, add pivot tables and charts based on the PowerPivot cube to the workbook, or link data from tables in the workbook.
Note
The PowerPivot help file comes with a great tutorial for creating a PowerPivot workbook. The data files necessary are located on CodePlex. In lieu of creating another exercise that duplicates the tasks in that tutorial, I recommend walking through the tutorial; that model is what we'll be looking at as we move forward.
Clicking the PowerPivot Window button opens the PowerPivot Designer, which is like a stripped-down version of Excel, focused on data. Figure 12-10 shows the PowerPivot Designer. If you note the tabs along the bottom, you will see multiple tables of data. You can import data from any number of sources. Out of the box PowerPivot supports connections to the following:
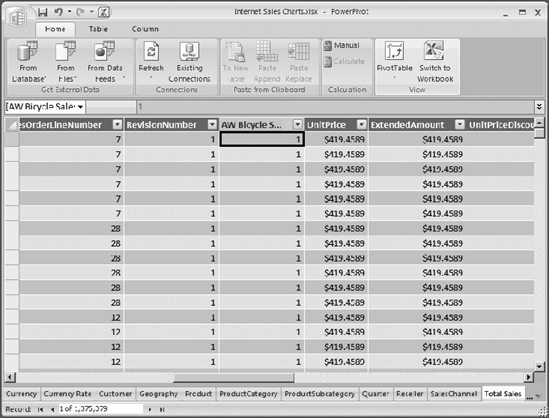
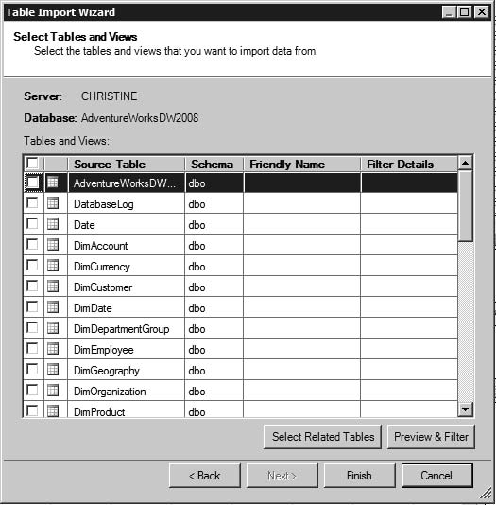
Note once again that the data in Figure 12-10 is imported from a database, so connecting to large data sources may take some time and memory. However, PowerPivot has been optimized to enable data tables with millions of rows to be usable. When you import data from a relational source, you can import multiple tables at once, as shown in Figure 12-11. When you import multiple tables, PowerPivot will recognize and maintain relationships between the tables. In addition, for each table you can select which columns to import, and you can filter the data (for example, if you want to bring in sales from only a specific year). If you are working with large data sets, try to minimize what you are importing in every way possible.
Note
If you're an experienced DBA, you may look for some form of entity relationship designer to graphically set up relationships. There isn't one. The reason is twofold: time constraints in getting the product finished, and some philosophical considerations over how to best present the concept of entity relationship design to a nontechnical analyst audience.
You can also create relationships in the PowerPivot Designer between tables from unrelated sources. When you create the relationship, PowerPivot will verify the suitability of the data in the columns for a relationship—that the data types match, and that one column has unique values.
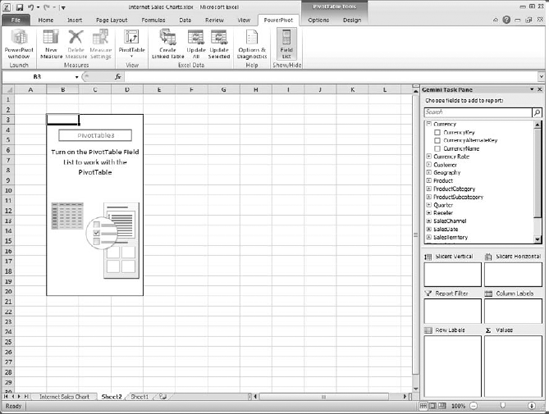
After you have imported the necessary data and created the relationships you need, you can create a pivot table and chart(s) from the PowerPivot Designer, or from the PowerPivot tab in Excel. When you insert a pivot table, it should look pretty familiar, as shown in Figure 12-12. You have the task pane with panels for values, columns, rows, and filters. You also have two new panels, for horizontal and vertical slicers. These are new features of Excel 2010 to provide attractive, dynamic filtering for pivot tables.
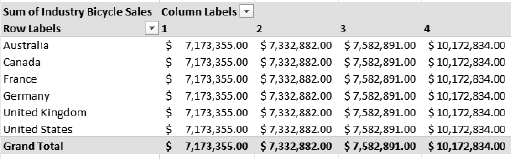
You can design a pivot table here just as we did in the earlier exercise. If you get a string of the same values, as shown in Figure 12-13, you know that there isn't a relationship between the dimension in the labels and the values in the table.
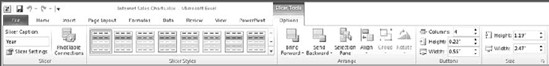
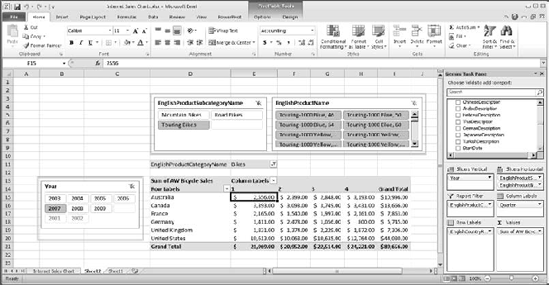
You can add slicers by dragging a field from a table (what we're used to thinking of as a dimension attribute) down to the slicers area. Excel will then create a filter area with the values from the filter field, as shown in Figure 12-14. You can have multiple slicers, and selecting a slicer will enable the Slicer Tools tab in the Ribbon, with which you can customize the slicer, as shown in Figure 12-15. (Remember to click in the pivot table or chart to get the task pane back if you need it.)
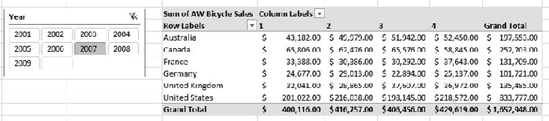
You can add multiple filters and slicers, and the slicers will cascade as necessary. Figure 12-16 shows a pivot table with a filter, horizontal slicers on Subcategory and Product, and a vertical slicer on the Year.
If you've been through the tutorial and you've tried some of these reports, you should notice that building the reports is pretty quick—selecting a slicer filters the report in subsecond time. This is even though the Total Sales table we're building it from has almost 1.4 million rows of data! Remember, this isn't an Excel pivot table; we actually have SQL Server Analysis Services running on the desktop and performing these aggregations for us!
Building and manipulating these models on the desktop is great, but the next great thing is collaborative analysis. We want to be able to share what we've created. In SharePoint 2007, we had the ability to publish a spreadsheet to Excel Services, and it was somewhat interactive for our users. PowerPivot opens a whole new world.
SharePoint Server 2010 integrates with SQL Server Analysis Services, leveraging the VertiPaq mode to run PowerPivot models on the server. The net result of this is that after you build a model in Excel, you can publish the workbook to Excel Services on SharePoint, and that model will be available just like an Analysis Services cube for any client that can connect to Analysis Services.
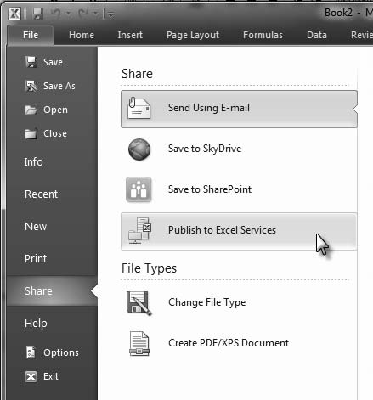
The interface point is a site named the PowerPivot Gallery on the SharePoint Server. When you're ready to publish a PowerPivot workbook, click the File tab above the Ribbon, and then select Share and then Publish to Excel Services, as shown in Figure 12-17. This will publish the Excel workbook to Excel Services, where it can be rendered in a browser, and publish the PowerPivot model to the integrated SQL Server Analysis Services instance (and create the necessary connections between them).
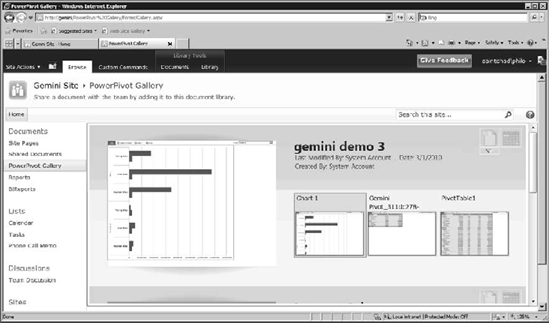
After your workbook is published to SharePoint, it will appear in the PowerPivot Gallery (see Figure 12-18). From the gallery you can manage your PowerPivot workbooks, with a screen preview of the reports and charts contained in each workbook. Of course, you can still switch to the standard SharePoint document library views if you need to.
Warning
When you publish a PowerPivot Excel workbook to SharePoint, you are saving the entire data store, which can get pretty large pretty fast. PowerPivot uses a lot of data compression to get the file size smaller, but be aware that with a PowerPivot Gallery, you are going to be seeing file sizes you're not used to.
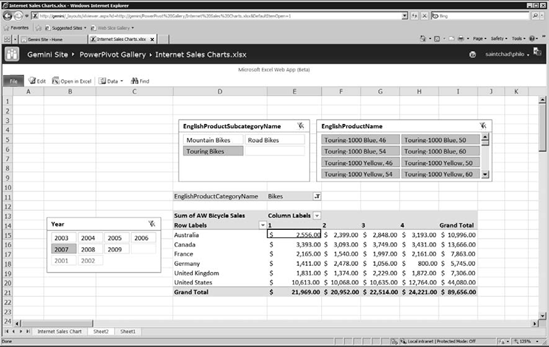
You can click on a PowerPivot document to open it in Excel Services, as shown in Figure 12-19. This is a lightweight interactive spreadsheet view of your document, with parsing and processing being performed on the server. You can also click the Edit link at the top left, and if the document is available for editing, it will open in the new Excel Web App—an interactive version of Excel Services, or a browser-based spreadsheet application.
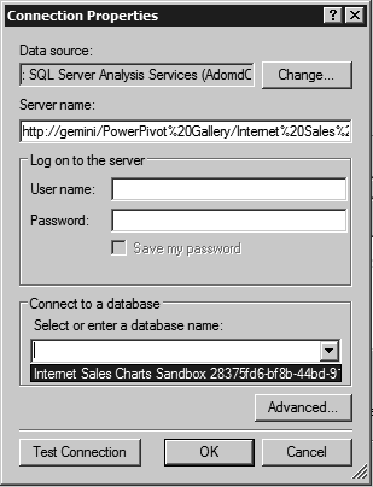
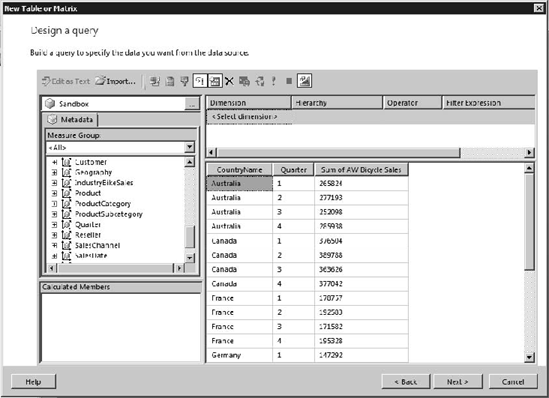
Now is where it really gets cool. Open Report Builder (or Excel, or Reporting Services, or any application that connects to SQL Server Analysis Services), create a connection to Analysis Services, and enter the document URL for the server name. You should then get one option for the database—a Sandbox, as shown in Figure 12-20.
After you've connected, you will have the standard view of a dimensional data source. Figure 12-21 shows our PowerPivot demo workbook loaded in the Matrix Designer for Report Builder. This is part of the power of the new designer: all the client tools are exactly the same. Analysts can build models by using Excel, publish them to SharePoint (where they can be viewed online), and then the data sources can be consumed in any client you choose to use.
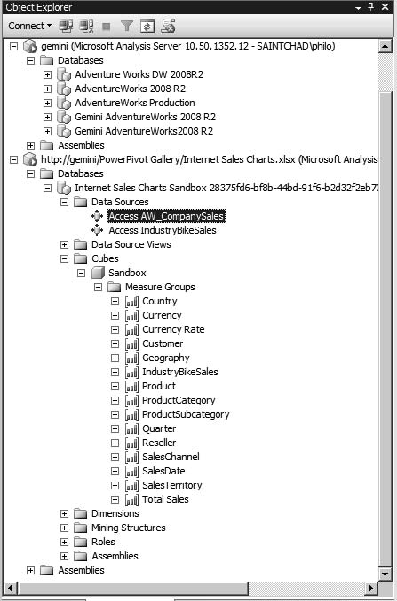
Remember that the data stored in a PowerPivot workbook was a copy? Part of the PowerPivot Services on SharePoint runs on a timer service to automatically refresh data in the workbook (for that data that has live connections). Of course, you'll have to be sure that the appropriate security is in place; the query will run under the credentials of the timer service. Incidentally, to verify those credentials, you can even connect to a PowerPivot workbook with SQL Server Management Studio, shown in Figure 12-22. Again, the server address is the URL of the workbook.
Those are the fundamental areas of change in SQL Server Analysis Services 2008 R2. Of course, three little terms—Master Data Services, Excel writeback, and PowerPivot—each create whole new areas of discovery in their own rights. This interim release has given us the tools to manage our corporate data, bringing us one step closer to "one version of the truth." It's given end users the ability to perform what-if scenarios with the multidimensional models that we deliver via Analysis Services, and we can empower end users to build their own cubes and publish them for reuse around the enterprise.
In Chapter 13, let's take a look at how we're going to keep all of this stuff running. We'll look at Analysis Services administration, and we'll talk about how to manage an Analysis Services environment.