
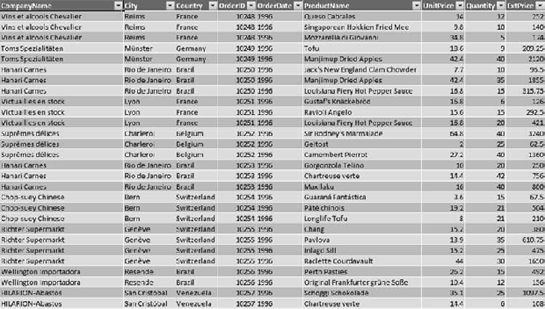
Online analytical processing (OLAP) is a technique for aggregating data to enable business users to dig into transactional data to solve business problems. You may be familiar with pivot tables from Microsoft Excel or other reporting solutions—for example, taking a list of order details (Figure 1-1) and creating a table that shows the total for each product ordered by month (Figure 1-2).
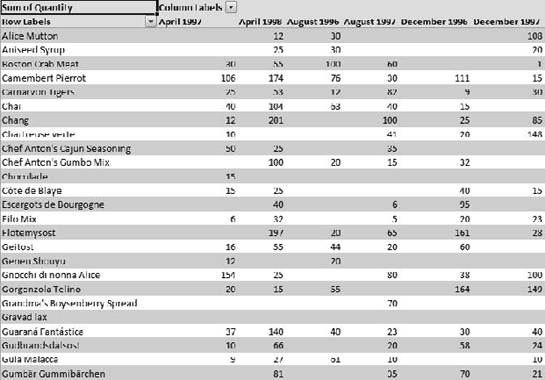
This is an interesting report, but what if we want to see the breakdown by quarter? Or by year? Or by fiscal year? Perhaps we want to combine the products into groups—for example, if we don't care so much how a specific product is faring, but we do want to know how our condiments are selling overall. We might be able to create some of these reports from existing data, or we might be able to write a query to do so. Some will require modifications to the database.
However, we have another problem: in this database, we have only 2,155 order details and 77 products—a pretty easy group of data to deal with. What do we do when we have 500 products (or more—consider Amazon.com!) and tens of thousands of records? What about millions? We can't expect Microsoft Excel to create pivot tables from all those records for us. To solve this problem of analyzing large amounts of data, we turn to a server-based solution that can take large amounts of tabular data and create these aggregations for us.
Take another look at Figure 1-2, order totals of products by month ordered. We have two dimensions to our data: product and month. This is a pretty basic pivot table based on a tabular data source. Now let's say we want to see this same table, but broken down for each geographic region (Figure 1-3).
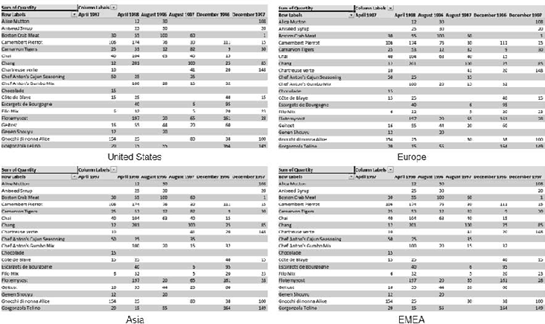
Now we have a third dimension: geographic region. Consider arranging the data as shown in Figure 1-4.
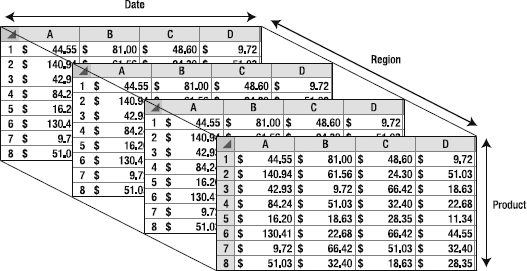
With three dimensions to the data, we have a cube. We will be using that term a lot. Of course, we don't have to stop with three dimensions. We can break the orders down by customer, by discount level, by product type, and so on. As you start to consider the exponential impact of having multiple dimensions, with each dimension having dozens of members, you will start to appreciate that presenting a tool to a nontechnical user to deal with this type of analysis is a nontrivial problem.
Looking at Figure 1-4, what does it look like when we want to also break it down by warehouse location and shipping method? And yes, we still call it a cube when there are more than three dimensions.
Let's take a step back and look at another problem we can face when aggregating data. Let's take our order data and create a pivot table to show products ordered by customer (Figure 1-5).
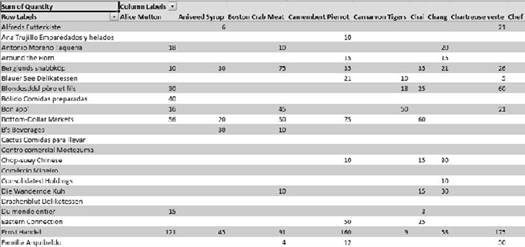
Obviously, few customers would order every product, so we see there is a lot of empty space. This is referred to as a sparse data set. The problem we have is that we are taking up space for every combination of customer and product, and these empty cells add up pretty quickly. OLAP servers are designed to optimize for storage of sparse data sets and aggregations.
A term that you'll frequently encounter in analytic processing—and that is horribly overused—is data warehouse. You may also hear data mart. (I will confess to also occasionally using model when I'm more interested in presenting the business problem we're trying to solve than getting into a debate about semantics.) Although these terms are not completely synonymous, they are often used interchangeably.
Data warehouse is easily the scariest word on the list. As this book will show you, working with OLAP technologies is relatively straightforward. I don't mean to trivialize the work necessary to build a robust dimensional solution, but the difficulty can be overhyped. A data warehouse is, most basically, a compilation of data fundamental to the business that has been integrated from numerous other sources. For example, you can pull salary data from an HR system, vendor data from an ERP system, customer billing information from a financial system, and create a financial data warehouse for the company (to start calculating profits and losses, profit margins, and so forth).
A data warehouse does not need to be dimensional. You could create a normalized relational database for querying and reporting. However, you will find it difficult to create many of the types of reports users expect from a very large storage of data (users and analysts will generally focus on aggregation and large-scale analysis as opposed to basic tabular reports).
Because data warehouse generally implies large-scale and cross-corporate information, people may perceive, as I mentioned, that data warehouses are heavy engineering efforts requiring a great deal of big up-front design. Where possible, I prefer to grow these types of resources organically: start with small projects, solve individual business problems, and grow the resulting data marts as necessary, finally bridging over to create an actual data warehouse if and when it is deemed necessary. I am very much about iterative design, and the work in this book supports that approach in design and maintenance of OLAP solutions.
Multidimensional analysis of large quantities of data has applications in every line of business, as well as scientific analysis and research. Following are some examples:
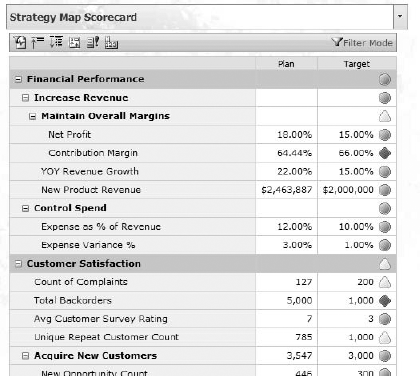
An executive might use a front-end analysis tool against corporate data to identify overall trends or causal relationships in corporate performance. In addition, aggregated data enables creation of corporate scorecards to provide "at a glance" views of how the business is doing (Figure 1-6).
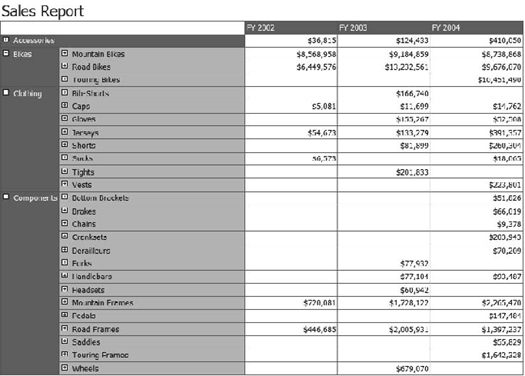
A sales manager would find sales reports combining the transactional data we've been discussing (Figure 1-7) useful. These reports can show how products have been selling and can easily be configured to break down the data in a sensible way. Also, using a special OLAP query language, reports can be built to "roll" forward as time goes on—for example, a report may show just the last three quarters. Instead of having to write a complex query or constantly update the report, a simple statement such as
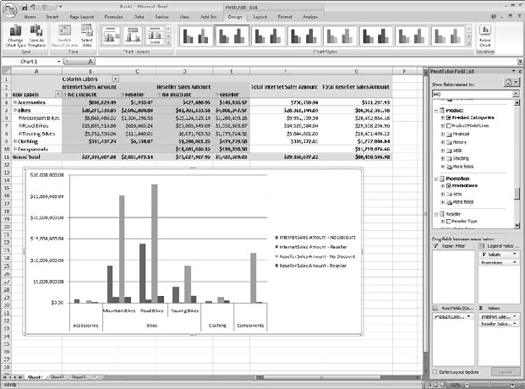
[Dimensions].[Time].[FiscalQuarter].PrevMemberwould always show the last full quarter of data.A business user will prefer using a desktop tool such as Excel to perform ad hoc analysis of data (Figure 1-8). Excel, ProClarity, and other tools like these provide the ability to dig through data, produce reports, and perform analysis on large amounts of information from numerous data sources that have been aggregated, scrubbed, and normalized.
Now that you have a rough feel of what OLAP is and why we're interested in it, let's take a look at where OLAP came from.
Multidimensional analysis dates back to the 1960s and IBM's implementation of APL for managing large-scale arrays. However, although APL was very important, the requirement of a mainframe to run it on and its arcane language (including Greek letters) kept it firmly in a small niche. APL continues to run applications to this day, but when is the last time you encountered anyone discussing it?
In the 1970s, the next step in OLAP evolution came forth in an actual application: Express. Express was designed to provide data-aggregation services and eventually became Express Server. Express was a command-line-based application, and data was managed with scripts. Express Server was acquired by Oracle in 1996, and the OLAP technologies were folded into Oracle9i.
E.F. Codd (father of the relational database) coined the term OLAP in 1993. Although other products performed large-scale data aggregation before that, Codd's creation of the term formed a foundation for technologies to grow on. Around the same time, Arbor Software (which merged with Hyperion Software in 1998) released their OLAP product, Essbase (originally eSSbase). Essbase was a client-server product that presented a (proprietary) spreadsheet as the front end, and ran a PC-based server application on the back end.
A number of OLAP vendors followed through the 1990s, but by the close of the 20th century, Microsoft would change the game twice. First, although other vendors were the first to consider using a spreadsheet application as a front end for OLAP, Microsoft's Excel was the first platform that truly became a ubiquitous analysis front end and had the extensibility hooks enabling other vendors to leverage it for their own use. By 2004, most OLAP vendors leveraged Excel as a user-friendly front end. Microsoft's second game-changer was to enter the OLAP server market themselves.
In 1996, Microsoft acquired OLAP technology from Panorama Software. It shipped with SQL Server 7 as OLAP Services (www.microsoft.com/technet/prodtechnol/sql/70/maintain/olap.mspx). OLAP Services offered a Cube Creation Wizard to design cube schemas, a Microsoft Management Console (MMC) snap-in to manage the services, and Pivot Table Services for client-side OLAP. In SQL Server 2000, the feature was renamed SQL Server Analysis Services (SSAS).
OLAP capabilities were underappreciated in SQL Server 7 and 2000. Between the perception that SQL Server wasn't ready for larger database tasks, and the lack of an easy way of viewing the output of the aggregations, it pretty much sailed under the radar. (SQL Server 2000 had a community solution that allowed viewing cube info, but having to download and compile a viewer for an enterprise data solution can make one wonder.) Another drawback to SSAS 2000 was that the underlying relational data had to already be in a star schema, which you mapped the cube onto. This made a staging database (intermediate data storage) almost mandatory.
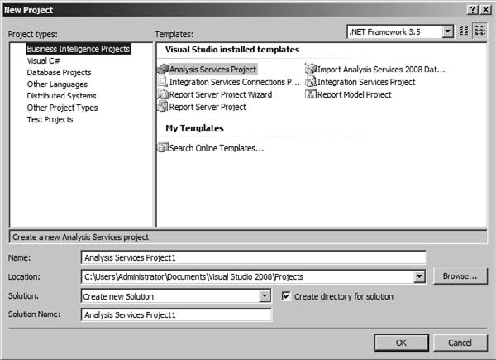
SQL Server 2005 really brought Analysis Services into the spotlight. The cube designer was united with Integration Services and Reporting Services in the Business Intelligence Development Studio, or BIDS (Figure 1-9), and Analysis Services was accessible via the unified environment of SQL Server Management Studio (Figure 1-10).

SSAS 2005 also made configuration management easier. In SSAS 2000, data connections to underlying databases were hard-coded and had to be manually changed when migrating a cube from development to test or production environments. SSAS 2005 provided tools to automate this process.
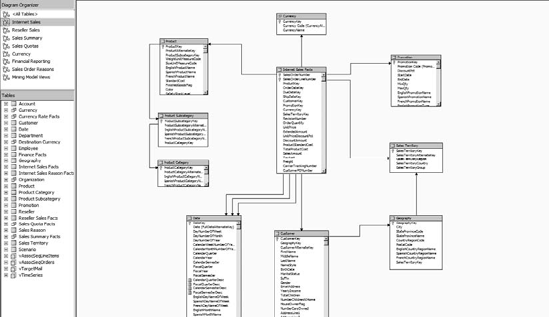
In 2005, Analysis Services also introduced the data source view (DSV), which allows a more robust management of how relational data sources are mapped within the cube solution. It also enables a developer to unify data from multiple sources (SQL Server, Oracle, DB2, and so forth). Figure 1-11 shows an example of a DSV from the AdventureWorks solution.
SQL Server Analysis Services 2005 also introduced the unified dimensional model (UDM). The UDM acts as a virtual model for data from a data warehouse or other RDBMS. With some planning and management, the UDM eliminates the need for various staging and normalized databases all containing the same data.
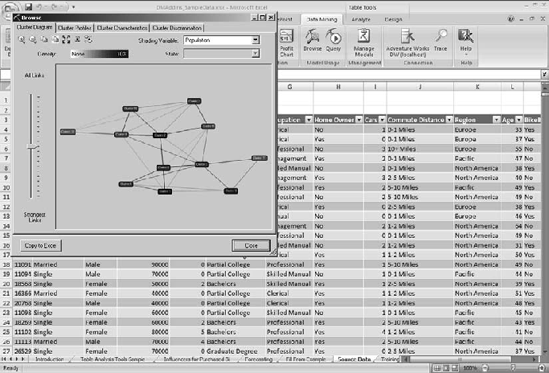
In 2005 we also saw the addition of a robust data-mining engine into SSAS. More important, Service Pack 2 added a data mining add-in for Excel 2007. This really made data mining accessible to the masses; instead of installing a database administrator (DBA) tool and having to understand all the data-mining models before really starting to work with them, Excel enables a more "point and play" approach (Figure 1-12).
Microsoft established SQL Server as their business intelligence platform by adding key performance indicator (KPI) features to Analysis Services, as shown in Figure 1-13. Key performance indicators are structures for performance management or business intelligence. They allow defining a current value, a target value, and a trend indicator.
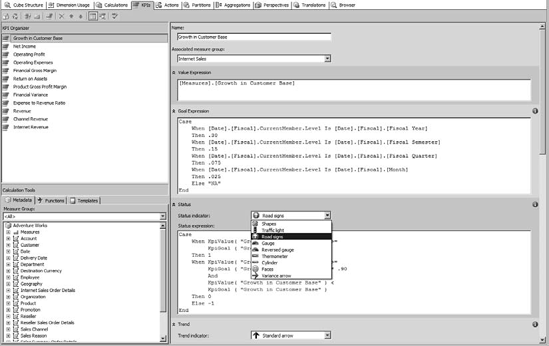
The real value in defining KPIs in a cube is that you will then have a uniform measurement to use for comparing various aspects of your business. Instead of every department defining profit margin with different business rules, they simply provide the underlying data, and the KPI does the work at any level of aggregation.
Note
Chapter 11 covers KPIs to some degree, but for an in-depth examination of how SQL Server Analysis Services fits into business intelligence, check out Philo's book Pro PerformancePoint Server 2007 (Apress, 2008).
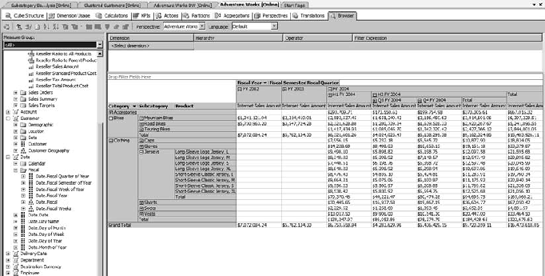
Most notably, the Business Intelligence Development Studio included a browser (Figure 1-14), which made it easy to view the structure and content of the cubes you create. The drag-and-drop design is very intuitive for anyone who's worked with Excel pivot tables or most charting packages.
SQL Server Analysis Services 2008 is somewhat more evolutionary than revolutionary. After the upheaval in the SQL Server 2000-to-2005 transition, Microsoft was intent not to stir the pot again so soon. As a result, SSAS 2008 focused on improving performance, implementing user feedback on the tools used, supportability, extensibility, and data-mining improvements. Of course, you'll be reviewing all these improvements in depth as you go through this book.
In its most basic form, data mining is the process of sifting through large quantities of information to gain insight into the underlying processes. A classic data-mining example is law enforcement, where officers may comb through reams of information (phone records, credit card receipts, noted meetings, and so forth) to identify the relationships in a crime syndicate.
Another form of data mining is running volumes of transactional data through a process to find patterns in the transactions. An example of this form of data mining is crunching through years of sales receipts for a grocery store to identify buying patterns of customers. This type of data mining is a perfect application of OLAP technologies, because it is dependent on aggregation of data.
An interesting aspect of this use of the OLAP engine is that you most likely won't be operating on a cube. Instead, you will create a data-mining model, train it on transactional data, and use it to process transactional data. To some degree, data-mining engines coexist in the same box as multidimensional cubes, but they are only tangentially related.
You will examine the data-mining capabilities of SQL Server 2008 Analysis Services in Chapter 13.
This chapter is simply meant to give you an idea of what this OLAP thing is all about, and where SQL Server fits in. You were introduced to data warehousing and data marts. You learned some OLAP history and were exposed to the various companies and individuals that contributed. You finished up the chapter with your first look at the SSAS environment.
In Chapter 2, you'll start to dig into the fundamental concepts behind how OLAP cubes work and what pieces make up an OLAP solution. You will learn the importance of cubes, dimensions, and measures. Finally, you'll see how these building blocks work together.