
P A R T 4
![]()
Troubleshooting and Tuning
C H A P T E R 14
![]()
Monitoring Your Server
As a database administrator, you are required to monitor the performance of SQL Server, the users who are logging in to your server, and to identify changes to objects within your environment. When you are effectively monitoring SQL Server, then you can proactively make informed decisions about changes made in your environment. The alternative is that you make reactive decisions, which are often times not thought out completely.
Fortunately, SQL Server 2008 and Windows Server provide useful tools to help you monitor both of them. The three primary tools that you'll use are as follows:
- The performance monitor (PerfMon)
- The Dynamic Management Views (DMVs)
- The profiling and tracing features
Baseline Your Server
The techniques discussed later on in this chapter will demonstrate methods for identifying problems on SQL Server. However, in order to proactively monitor your server and recognize when things are changing, you have to baseline your server. This captures statistical information regarding your server over time, and then declares those measurements as the baseline performance measurements. Your monitoring then, involves comparing new measurements against that baseline in order to detect changes.
When you collect baseline metrics, there are a number of areas to consider. Your server uses CPU, memory and disk, and there are other aspects of SQL Server to consider as well. You should try to capture a baseline of statistics for the following items:
- CPU
- Memory
- Physical disk
- SQL server activity
- Buffer manager
- General statistics
- SQL statistics
Creating baseline statistics for your server not only helps you determine what is normal for your environment, but you also document the norm for other members of your team. That definitely helps new employees when their responsibilities consist of supporting existing applications on servers that have baselines documented.
Even if your application has been running on the current server for years, it is still not too late to baseline your server. You need to have some method to determine if your server is gradually performing worse. Having that information will help you justify server replacement and provide better support for your application.
Familiarizing Yourself with the Performance Monitor
Performance monitor is a graphical tool that comes with Microsoft operating systems to monitor different activity of the system. Performance monitor is divided into two basic parts: the system monitor and performance logs and alerts. The System Monitor section provides realtime statistics on system activity in a graph, histogram, or report format. The Performance Logs and Alerts section allows you to store information about the activity on your system and set alerts to fire after surpassing your defined thresholds.
There are multiple methods of launching the performance monitor. You can navigate to the Administrative Tools folder from the Control Panel or Start menu, and then select Performance. Or you can go to the Start menu, select Run, and then type perfmon. Once the application launches, you will see a graph with the default counters displayed, as shown in Figure 14-1.
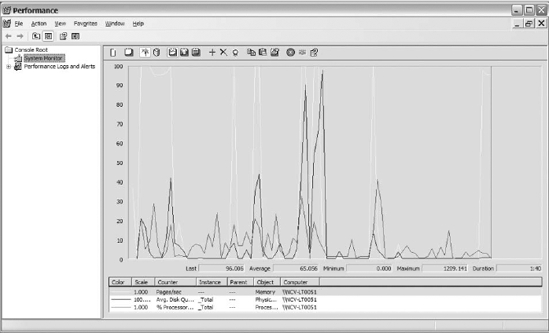
Figure 14-1. The default counters displayed within the performance monitor
After you launch the application, there are two options that you need to be familiar with: Add (represented by a plus sign on the toolbar) and Highlight (represented by a yellow light bulb on the toolbar).
The Add option is important because it allows you to increase the number of counters that you can monitor. Once you click on the plus sign or Add option, the Add Counters dialog box will launch (see Figure 14-2).
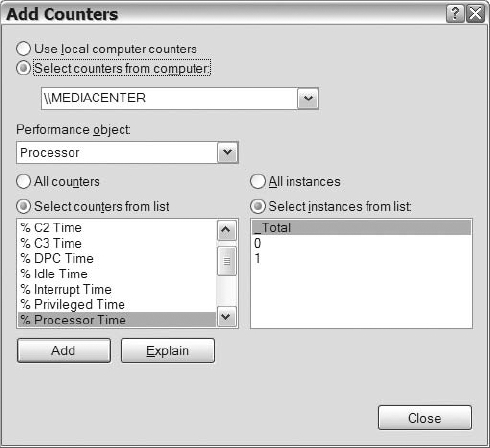
Figure 14-2. The performance monitor Add Counters dialog
After reviewing Figure 14-2, you should notice that you have multiple options to choose from when adding counters. You can determine the source of the counters that you want to add. Next, you have to decide which object you want to add counters from. After you select an object, you can determine if you want all counters for the object or if you want to select specific objects from the list. Lastly, where it applies, you can select the instance of the counter that you want to capture. Whatever you do, don't forget about the Explain button, which gives you a brief description of the selected counter. That will definitely help you sort out the meaning of the numerous counters that exist. Once you decide on the counter you want, click on the Add button, and it will populate the graph, histogram, or report.
As you familiarize yourself with the performance monitor, you will add a large number of counters to your graph simultaneously. When you reach that point, it will become increasingly challenging to identify the values of each counter. That's where the Highlight option comes into play. The Highlight option lets you to quickly determine the values of the counters by highlighting them on the display (see Figure 14-3).
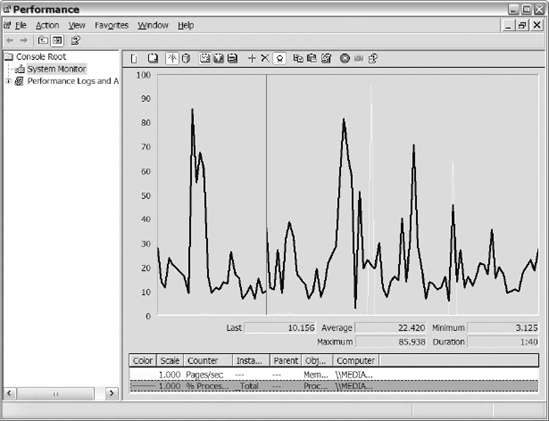
Figure 14-3. A highlighted counter in the performance monitor
Monitoring Your CPU
The CPU of the server that SQL Server resides on will do the processing for your applications running SQL Server. Any CPU bottlenecks will thus impact the performance of your server. Monitoring your CPU and the counters that reflect current CPU activity over a given period enables you to identify gradual changes within your environment. Identifying those changes before the situation becomes unmanageable is the key to keeping management and your customers happy.
Using multiple performance monitor counters to identify CPU problems is the best way to determine when you have a CPU bottleneck. Table 14-1 lists some performance counters and recommended values for those counters. You can refer to these recommended values when trying to determine whether you have potential CPU issues.
MONITORING CPU WITH TASK MANAGER
This section primarily focuses on the performance monitor and DMVs, but don't forget about tools like the Task Manager. Using Task Manager to monitor CPU is a quick-and-easy method of determining if your CPU is high and the application that is using the bulk of it. When you know what is consuming your CPU, you can better determine the best course of action for further investigation. Figure 14-4 shows an example of Windows Task Manager Processes tab.
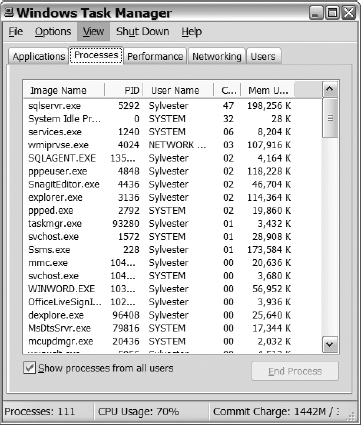
Figure 14-4. The Processes tab within Windows Task Manager
The thresholds may vary from environment to environment and may need tweaking to identify problems in your environment. Use the thresholds from Table 14-1 as a starting point for monitoring your environment, not as absolute values that you are bound to stay within.
Once the performance monitor is launched, the first thing we do is remove the default counters and add the counters for the resource that we are monitoring. For this example, we added the counters listed in Table 14-1 and any other counters that we have found useful for monitoring CPU. After adding the counters to the display, you should go through them and remove the counters that are in line with your baseline or the thresholds listed in Table 14-1. That way, you remove some of the “busyness” on the screen, and the only counters that remain will be the counters that you really need to evaluate and analyze. Figure 14-5 shows an example of the performance monitor with the counters listed in Table 14-1.
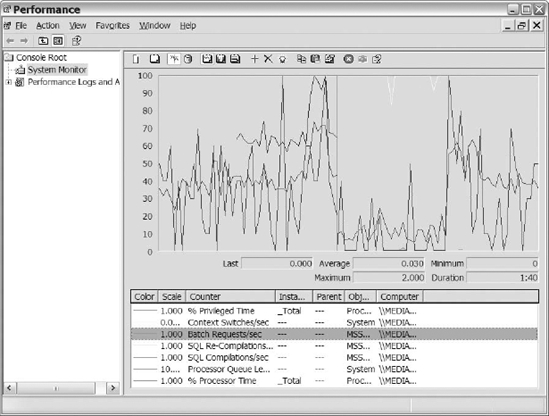
Figure 14-5. Sample PerfMon counters listed in Table 14-1
Windows Counters That Indicate CPU Utilization
This section provides additional information about the Windows counters listed in Table 14-1. The Processor object lists two counters that we want to discuss: % Processor Time and the % Privilege Time. The System object lists the other two counters that we care about: Context Switches and Processor Queue Length. Following are our thoughts on these four key counters:
- % Processor Time: The percentage of CPU used on your server. Ideally, we like to keep our servers running in the 20% to 50% range. Spikes above this range will occur, so don't be alarmed when your server temporarily runs high. You should try to identify the process or processes causing the increase in your CPU when it sustains above 80% for a given period. That threshold is one indicator that you may be headed toward a CPU bottleneck.
- % Privilege Time: A counter that helps you identify the impact of kernel or system processes on your server. The execution of system processes should consume less than 30% of your total CPU. When this value is consistently greater than 30%, it probably indicates that a Windows service is having a problem.
- Context Switches/Sec: These counters list the number of SQL Server threads switching among processors. A high number of context switches can prove costly to your CPU. Numbers higher than 5000 per second could indicate problems, but review the other counters in this section before making that determination. If counters like Processor Queue Length and Compilations/Sec look good, then chances are your context switches are okay. Another good reference point is your server baseline, which will contain the context switches when the system performance was acceptable. Track changes in the baseline number to help you identify gradual changes.
- Processor Queue Length: This counter identifies the number of ready threads waiting on processor resources for processing. Numbers exceeding two per processor should definitely encourage you to investigate CPU. Threads in a ready state waiting on processing indicate that processes are waiting on their opportunity to run. When threads are waiting to run, the applications are not processing requests as fast as they would like to. That could definitely be a problem for the applications using the server.
SQL Server Counters That Impact CPU
This section discusses the SQL Server counters that track CPU-intensive processes that influence your CPU. The counters do not necessarily indicate that you will have performance problems because of the values of the counters. However, CPU utilization should be lower on your system as the following counters values decrease.
- Batch Requests/Sec: Measures the number of batch requests received by the SQL Server instance. This number generally represents the activity on SQL Server. Unfortunately, this counter does not capture every statement executed in a stored procedure, but it is the best counter to use to gauge the activity on SQL Server.
Servers with more than 1000 batch requests/sec generally carry a heavy transactional load. Busy database servers are not a bad thing, but they could cause CPU problems. So baseline your servers and keep an eye on the number of batch requests/sec against your server.
- SQL Compilations/Sec: Represents the number of compiles that occur on your SQL Server instance. The first execution of a query on SQL Server generates a compilation and stores the execution plan in the procedure cache. When the query executes again, SQL Server checks to see if that execution plan exists in the procedure cache. Reusing an execution plan found in the procedure cache ultimately saves SQL Server the CPU time needed to compile a plan. Applications that execute ad hoc queries don't take advantage of execution plan reuse, causing increased CPU as plans must be generated often.
SQL Server compilations should be less than 10% of your batch requests/sec. Results greater than that threshold probably indicate that an application running against that instance of SQL Server is not taking advantage of execution plan reuse. Using Dynamic SQL and stored procedures increases the chances of execution plan reuse, minimizing the number of compiles.
- SQL Recompilations/Sec: Represents the number of recompiles that occur on your SQL Server instance. SQL Server decides to recompile for a number of reasons, but some of the most common are statistics updates, schema changes, changes to an index used by an execution plan, and your specifying the recompile option. Once a plan is marked for recompile, the next batch that executes the query will cause the recompile to occur. Recompiles are CPU intensive, especially on complex queries.
SQL Server recompilations should be less than 10% of the number of SQL Server compilations that occur on your instance of SQL Server. When your system exceeds that threshold, you should spend some time identifying the cause of the recompiles. Pay close attention to recompiles after application upgrades. Recompiles after an upgrade generally indicate new changes in the application that are causing the recompiles to occur, and those changes may end up affecting performance. Your baseline can be useful when comparing change in the number of recompiles on your system. Recompiles will happen, but minimize them on your system if you can.
While using the Windows counters, try to combine the results of counters to help identify CPU bottlenecks. When the CPU is sustaining above 80% and the processor queue is above its thresholds, then that combination should force you to investigate the CPU further to ensure SQL Server is not causing a CPU bottleneck. Before making recommendations for purchasing additional CPU, use some of the tips in Chapter 15 to identify queries that consume a lot of CPU and attempt to improve the performance of those queries.
DMVs for Monitoring CPU
SQL Server provides a number of Dynamic Management Views (DMVs) for monitoring CPU. Understanding the relationship between threads, workers, schedulers, and tasks is crucial to understanding the relationship between the CPU DMVs. Here's what you need to know:
- SQL Server starts, spawns a number of threads, and associates workers to them.
- A query or batch is broken into one or multiple tasks.
- The task is assigned to a worker for the duration of the query or batch.
- Workers are assigned to a scheduler and each scheduler maps to a processor to run.
Let's take a closer look at these DMVs to get a better understanding of the output that they provide. The following list describes some of the data returned by these views:
sys.dm_os_threads: Lists information about the threads created when SQL Server started. These are operating system threads that currently run under the instance of the SQL Server executable. This view is useful for monitoring CPU because it can provide information about runaway threads within the executable along with linking information for the other CPU DMVs.sys.dm_os_workers: Provides information about the workers assigned to threads within SQL Server. When a worker is ready to run, the worker moves to the front of the runnable queue and tries to run up to 1000 times. After the 1000 tries, the worker moves to the back of the queue. This DMV also returns information about the worker (such as the number of tasks the worker executed), the state of the worker, IO used by the worker, the number of ms_ticks that the worker spent in a suspended and runnable state along with many more columns. Besides important information about the workers, this DMV returns important information for linking to threads, schedulers, and tasks. Spend some time understanding this DMV; it should prove useful when monitoring your CPU.The query in Listing 14-1 is one that we frequently use and is found in SQL Server Books Online. This listing shows you how long worker threads have been active compared to suspended. The results of Listing 14-1 are shown in Figure 14-6.
Listing 14-1. SQL Code That Identifies the Amount of Time a Worker Has Been Running Compared to Being Suspended
SELECT t1.session_id,t1.status,t1.command AS command,

t2.state AS worker_state,

w_suspended = CASE t2.wait_started_ms_ticks

 WHEN 0 THEN 0 ELSE t3.ms_ticks - t2.wait_started_ms_ticks

END,

w_runnable = CASE t2.wait_resumed_ms_ticks

WHEN 0 THEN 0 ELSE t3.ms_ticks - t2.wait_resumed_ms_ticks

END

FROM sys.dm_exec_requests AS t1 INNER JOIN sys.dm_os_workers AS t2

 ON t2.task_address = t1.task_address

CROSS JOIN sys.dm_os_sys_info AS t3

WHERE t1.scheduler_id IS NOT NULL and session_id> 50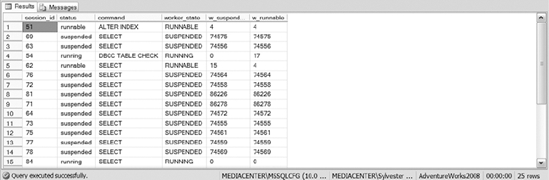
Figure 14-6. The results of Listing 14-1
sys.dm_os_schedulers: Lists information about the schedulers and the workers assigned to them. This DMV has several interesting columns, including columns that let you know how many workers are associated with each scheduler, how many workers with tasks associated to them are waiting on the scheduler, and the number of active workers each scheduler currently has. Monitoring this view is important because you need to know when the schedulers start to deviate from your baseline. The more workers waiting on scheduler time increases the likelihood of CPU bottlenecks. Make sure you proactively monitor this view in your environment and identify causes for change in this view.Listing 14-2 contains a query that we frequently run to identify the workload of our schedulers. We pay close attention to the amount of workers that are queuing, specifically the count in the work_queue_count column. Figure 14-7 contains the results of Listing 14-2.
Listing 14-2. SQL Script That Gathers Statistics on Your Schedulers
SELECT scheduler_id,parent_node_id,current_tasks_count,

runnable_tasks_count, current_workers_count, active_workers_count,

work_queue_count, load_factor

FROM sys.dm_os_schedulers

WHERE scheduler_id < 255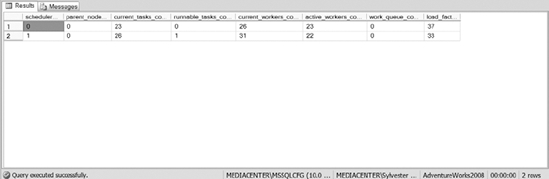
Figure 14-7. The results of Listing 14-2
sys.dm_os_tasks: Gives you information about each active task within your SQL Server instance. This DMV has columns that provide you with the physical IO performed by the task, the state of the task, and the scheduler the task is running on, along with several other columns. This DMV also contains columns about the request that caused the creation of the task. That's really important when you want to figure out the query or batch that the task is executing. Listing 14-3 contains a sample script that shows you how to identify the query that caused the creation of the task. The results are shown in Figure 14-8.
Listing 14-3. SQL Script That Shows the Number of Tasks in a Particular task_state
SELECT r.session_id,task_state,pending_io_count,

r.scheduler_id,command,cpu_time,

total_elapsed_time,sql_handle

FROM sys.dm_os_tasks t

 join sys.dm_exec_requests r on t.request_id =

r.request_id and t.session_id = r.session_id

WHERE r.session_id > 50
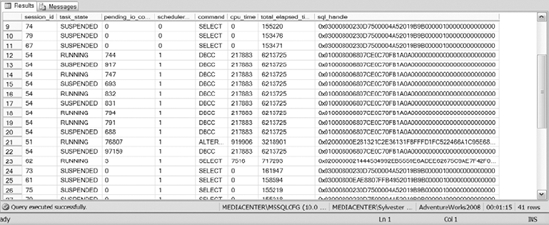
Figure 14-8. The results of Listing 14-3
When monitoring your CPU, we also discussed the impact of the number of compiles on your system. SQL Server provides you with the sys.dm_exec_query_optimizer_info DMV, which captures information about the SQL Server optimizer. This view contains information about the total number of optimizations, the average elapsed time for the number of optimizations, the cost of the optimizations, and several other columns. With this information, you can determine the cost of the compiles against your system. That may help you convince your developers to use stored procedures over the ad hoc queries that they run in your environment.
Monitoring Your Memory
Memory plays an important role in the performance of SQL Server. When SQL Server does not have enough memory, other resources, such as CPU and disk IO, are often impacted. Understanding the role of memory in SQL Server is important when monitoring your system. In our opinion, that understanding helps you make more sense of the monitors that you use. This section will provide a couple examples of memory usage in SQL Server, and will show methods for determining whether you have memory bottlenecks on your system.
Memory Usage in SQL Server
SQL Server uses memory to process every query. If the data pages requested do not reside in memory or the buffer pool, then SQL Server retrieves the pages from physical disk and loads them. SQL Server tries to keep pages frequently accessed in memory to minimize physical disk IO. SQL Server uses a least-recently-used algorithm to determine the memory pages that should be removed from memory. If you do not have enough memory to process the requests against your system, then SQL Server will remove the frequently accessed pages to make room to process the queries. Because of the constant trips to physical disk, a shortage of memory will cause increased disk IO and an increased duration for queries.
SQL Server also uses memory for its internal structures, such as connections, execution plans, and various SQL Server internal processes. When SQL Server is experiencing memory problems, then there is an impact to its internal structures, which ultimately impacts resources and SQL Server performance. Remember that under the previous section, “SQL Server Counters That Impact CPU,” we discussed the number of compiles in your system. Memory problems can cause an increase in the number of compiles in SQL Server. When there is a shortage of memory, SQL Server may decide to remove execution plans from memory. Later, when queries that usually have compiled plans execute, they have be recompiled, which is a CPU-intensive process.
Counters to Watch
Hopefully, the brief preceding examples helped you understand how memory can impact CPU and disk IO. This is another example of why it is important to use multiple counters to determine what is affecting your server. If you only look at CPU or disk IO counters, you can easily conclude that you need more CPU or disk space when the real problem might be that you are low on memory. Table 14-2 lists some of the counters that you should watch in order to keep tabs on memory utilization.
MONITORING MEMORY WITH TASK MANAGER
Remember that you can use the Task Manager to monitor memory. You can quickly determine how much memory is available by reviewing the Physical Memory section on the Performance tab (see Figure 14-9). If your available memory is less than 100 MB, then you probably should start evaluating what is consuming your memory. In order to see what applications are doing this, click on the Processes tab and sort the data by the Memory Usage column. That method is useful for identifying memory-intensive applications on your server.
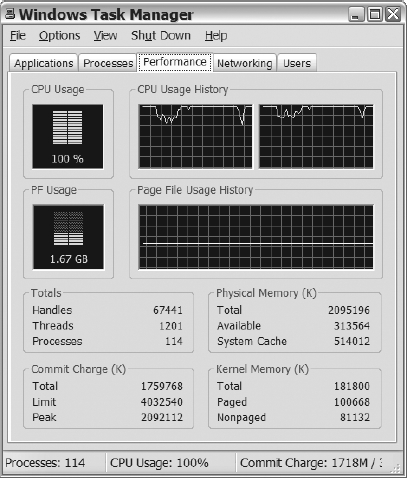
Figure 14-9. The Performance tab of Windows Task Manager
Just as with CPU counters, we like to add the counters in Table 14-2 to PerfMon. After adding the memory counters, we like to remove the counters that are in line with our baseline to get rid of some of the congestion to help us focus in on the problem areas. Figure 14-10 shows PerfMon with all the counters listed in Table 14-2.
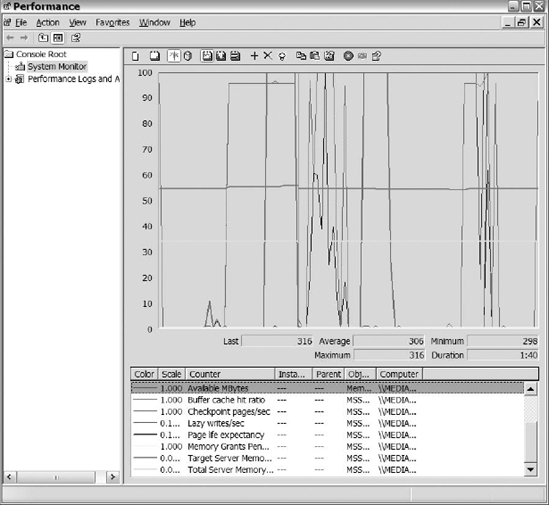
Figure 14-10. Sample PerfMon graph for counters listed in Table 14-2
Memory with Windows Counters
The following list explains the Memory object Windows counters listed in Table 14-2. Monitoring memory counters can sometimes be a little tricky, but familiarizing yourself with the counters you will use should help you understand the data presented by the counters. Remember, you have your baseline also to help you determine when performance changes within your system.
- Available MBytes: Represents the available memory in megabytes remaining on your server. This counter sums the amount of space on the zeroed, free, and standby memory lists. The zeroed memory is the memory that is filled with zeros to prevent other processes from viewing it. Free memory is the memory ready for use by a process. Standby memory is the memory that was removed from the processes and is waiting to go to disk. This counter represents the last observed value, not an average value, so monitor this value over time to ensure that you don't have minimal memory remaining. If the server that runs SQL Server has multiple applications running on it, you may want to consider moving those applications if your memory is consistently less than the threshold you would like it to be. Monitor this threshold closely because SQL Server does not perform well when it does not have enough memory.
- Page Faults/Sec: Represents the rate of page faults per second that are occurring on your system. This counter tracks both hard and soft page faults. Hard page faults are faults that have to go to disk in order to retrieve the requested data, while soft page faults retrieve the requested data in physical memory. Because this value changes from system to system, use your baseline to determine when the page faults rate deviates from the norm. Do not be alarmed if you have a large number of page faults. Your system can probably handle them without issue; however, pay close attention to the number of hard page faults. Monitor your hard page faults along with the physical IO counters to ensure that the hard page faults are not causing disk IO problems.
- Pages Input/Sec: Tracks the rate of pages read from disk to resolve hard page faults. Ideally, you do not want more than 10 pages per second read into memory to resolve hard page faults. This counter is extremely useful when determining the number of page faults/sec that represent hard page faults. You can apply the following formula:
Pages input per second / page faults per second = percentage hard page faultsWhen the hard page faults percentage exceeds 40% for an extended period of time, the chances are your system has memory issues.
- Pages/Sec: Identifies the rate of pages read from and written to disk for resolving memory requests for pages that are not in memory. In other words, Pages/Sec represents pages input/sec and pages output/sec. (Pages output represents the pages removed from memory heading to disk.) A high number in the Pages/Sec counter does not necessarily mean that you have a memory problem. Use other counters and your baseline to help you determine when the Pages/Sec counter is indicating a problem.
- Page Reads/Sec: Represents the rate of reads against physical disks that occurred to resolve hard page faults. This counter captures the number of reads per second, not the number of pages read into memory per second. Thus you can use this counter in conjunction with the Pages Input/Sec counter to determine the number of times the disk was read along with the number of pages that were inserted into memory to resolve the hard page faults. You don't want more than five pages read per second into memory. Consider values greater than five as indicative of excessive paging.
Memory with SQL Server Counters
SQL Server provides a number of performance monitor counters to help you monitor memory utilization within SQL Server. These counters are as follows:
- SQL Server Buffer Manager: Buffer Cache Hit Ratio: Represents the number of pages found in the buffer pool without having to read from disk. Generally, this percentage should be above 90% and closer to 99%.
- SQL Server Buffer Manager: Checkpoint Pages/Sec: The number of pages flushed to disks by checkpoints or other methods that require the flushing of all dirty pages. Dirty pages are data pages entered into the buffer cache, modified, and waiting for changes to write to disk. An increasing number of checkpoints from your baseline indicate increased activity in the buffer pool.
- SQL Server Buffer Manager: Page Life Expectancy: Identifies the amount of time in seconds that pages are remaining in memory without reference. The longer pages stay in memory, the greater the benefit for SQL Server. If pages can stay in memory for a long time without reference, then SQL Server will have to go to the physical disk less often to retrieve that data. The industry-recognized time for this counter is 300 seconds, or 5 minutes. Consistently having pages that stay in memory for less than that amount of time may indicate the need for more memory.
- SQL Server Buffer Manager: Lazy Writes/Sec: The number of pages written to the buffer manager's lazy writer. Frequent or an increased number of lazy writes can indicate that you don't have enough memory.
- SQL Server Memory Manager: Memory Grants Pending: Represents the current number of processes waiting for a workspace memory grant. The workspace memory grant is the total amount of memory dedicated to executing processes. This counter keeps track of the number of processes that are waiting for memory before they can execute. This counter should be as close to zero as possible.
- SQL Server Memory Manager: Target Server Memory: Identifies the total amount of dynamic memory the server is willing to consume. This number should be steady. Increasing values indicate the need for more memory.
- SQL Server Memory Manager: Total Server Memory: Represents the amount of dynamic memory that SQL Server is currently consuming. This number should be relatively close to the maximum memory setting for the instance.
Remember, monitoring memory using the Windows and SQL counters may be a little tricky at times. Some counters may exceed the recommended thresholds, while others fit well within the ranges. Use your better judgment and your baseline to determine when things are going wrong on your system.
Memory with DMVs and DBCC Commands
SQL Server also provides a number of Dynamic Management Views and Database Consistency Checks (DBCC) commands that you can use to monitor memory. The memory DMVs can be a little overwhelming because there is a lot of data regarding memory and how it's allocated within SQL Server. We are not going to talk about all of the memory DMVs, but we will discuss some of our favorite ones. The following list describes our most frequently used DMVs to monitor memory:
sys.dm_os_sys_memory: Returns information regarding operating system memory. Some of the columns include the system's total memory, the available memory, and the total amount of page files being used.One interesting column is system_memory_state_desc, which describes the current state of the memory. Values returned in that column are Available Physical Memory Is High, Available Physical Memory Is Low, Physical Memory Is Steady, and Physical Memory Is Transitioning. You can use the
sys.dm_os_sys_memoryview when you are switching from one server to another, or from one instance to another, to quickly see the available memory and SQL Server's “opinion” on the amount of memory that you have available in your system.The following query retrieves information from
sys.dm_os_sys_memory.SELECT total_physical_memory_kb,available_physical_memory_kb,
system_memory_state_desc
FROM sys.dm_os_sys_memoryThe results of the preceding query are shown in Figure 14-11.

Figure 14-11. Sample results of sys.dm_os_sys_memory DMV
sys.dm_os_process_memory: Lists information about the memory used within your SQL Server instance. Some of the columns are physical memory in use, available commit limit, total virtual address size, and some others. This view also has two indicators, Process Physical Memory Low and Process Virtual Memory Low, which let you know if the virtual or physical memory is considered low by SQL Server. Once again, this view allows you to quickly see how memory is being used within your SQL Server instance.sys.dm_exec_query_memory_grants: Captures information regarding the queries that are waiting or have been given a memory grant. This DMV includes columns that tell you the amount of requested, granted, required, maxed used, and the ideal memory for each query running on your system. As if that information isn't helpful enough, the DMV also returns information about the SQL handles and plan handles so that you can see queries and their execution plans. This view is extremely useful for identifying the memory hog queries running on your system, analyzing their execution plans to see why they are consuming so much memory, and fixing or providing recommendations for fixing the queries.The following query is one we frequently run to identify memory usage for the queries running on our systems. The results of the query are shown in Figure 14-12.
SELECT session_id, request_id,requested_memory_kb,required_memory_kb,

used_memory_kb,ideal_memory_kb,sql_handle, plan_handle

FROM sys.dm_exec_query_memory_grants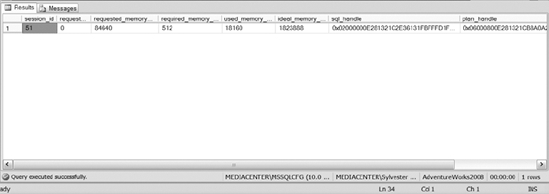
Figure 14-12. Sample results of the sys.dm_exec_query_memory_grants DMV
You also have the ability to monitor the memory of your system by executing the DBCC memorystatus command. This DBCC command lists memory usage for the buffer manager, memory clerks, and a number of other processes that can consume memory within SQL Server. Some of the information provided by the DBCC command can be found in multiple DMVs, but the DBCC command gives you a one-stop shop for the information you are looking for. DBCC memorystatus is also backward compatible with SQL Server 2000.
Monitoring Disk IO
Unless your entire database fits in memory, then the performance of your SQL Server is heavily dependent upon your disk IO. Disk bottlenecks will impact the speed at which pages are moved in and out of memory. Delays in moving pages in and out of memory ultimately affect the performance of the application.
Monitoring disk IO can also be a little tricky. Depending on the counters that you use, you have to evaluate the results based on the number of disk spindles available on the monitored physical disk. Table 14-3 lists some of the counters and thresholds used when monitoring disk IO; it also lists if the number of spindles needs to be considered when using the counter.
Figure 14-13 shows PerfMon with the counters listed in Table 14-3.
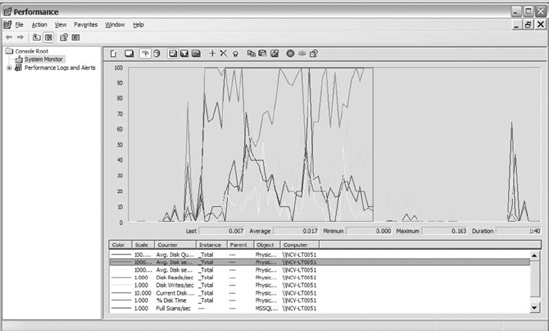
Figure 14-13. Disk IO counters listed in Table 14-3
Disk IO with Windows Counters
The following list explains the Physical Disk object Windows counters listed in Table 14-3. As you use those counters, remember that the results from some counters must be interpreted in light of the number of spindles within the disk array. For example, if disk D consists of 6 spindles and you are monitoring the Avg Disk Queue length, the counter would have to be greater than 12 before you have reason for concern.
- Avg Disk Queue Length: Represents the number of physical reads and writes queued on the selected disk. When your disk IO subsystem is overwhelmed, physical disk reads or writes have to wait before performing their actions. Keep in mind, sustained values greater than two for each spindle requires attention.
- Avg Disk Reads/Sec or Writes/Sec: Captures the average amount of time it takes to read/ write data to disk. One benefit of this counter is that it measures disk latency. The measurement of disk latency does not care about the number of spindles within the array. The measurement of Avg Disk Reads/Sec or Writes/Sec counter represents the amount of time in milliseconds it takes for the actions to happen. When the counter exceeds 20 ms for a given disk, research the cause of the increased read/write from/to the disk.
- Reads/Sec or Writes/Sec: Measures the number of reads or writes per second from/to disk. These numbers need to be less than 85% of the disk capacity. The specifications of your disk drives should identify the number of reads and writes per second the drives support. Make sure the Reads/Sec and Writes/Sec counters do not exceed 85% because the access time increases exponentially beyond 85% capacity.
- % Disk Time: Represents the busyness of your disk drives. Drives that sustain more than 55% over time indicate that your disks are overworked and that you likely have a disk IO problem. Figuring out why your disks are so busy will go a long way toward reducing IO problems.
- Current Disk Queue: Measures the current processes waiting for IO. Using this counter along with % Disk Time may help you understand what is going on with your disks. If your current disk queue is high and % Disk Time is above your baseline, then that probably is an indicator that application processes are delayed and your disks are bottlenecked.
Disk IO with SQL Server Counters
SQL Server also provides some counters to monitor factors that negatively affect the disk IO on your server. Table 14-3 mentioned the two SQL Server counters that we use the most to determine how factors of SQL Server are impacting disk IO. These counters are located in the SQL Server Access Methods object and are further described in the following list:
- Full Scans/Sec: Identifies the number of table and index scans occurring on your system per second. Scans are IO-intensive and should run within your databases minimally. If your scan counters are high, then identify the tables that have a large number of scans against them. Use the tips in Chapter 16 to help you identify IO-intensive queries and the tables that account for the scans within your database.
- Page Splits/Sec: Represents the number of page splits per second that occur on your system. Page splits occur when there is not enough space on a page to add the data on an existing page. When the page splits, that causes fragmentation and results in IO-intensive processes. Try to keep page splits under 20 per 100 batches/sec. If the number of page splits is greater than that, then review the fill factor you have set up on your indexes and minimize it where appropriate.
Monitoring disk IO is slightly more complex because you have to remember to keep the number of spindles in mind when interpreting the results. Once you get familiar with counters, then monitoring disk IO will be easier. Always use multiple counters to identify disk IO problems, not just the results of one counter. Using that method is more likely to save you time and effort from venturing down the wrong path.
Monitoring Miscellaneous Counters and DMVs
Two general counters may prove useful when monitoring SQL Server: Logins/Sec and User Connections. Both of these counters should be part of your baseline so you have something to compare against over time. They may be helpful when trying to figure out gradual changes in the hardware resources within your environment. These counters may also be useful when you are trying to determine the reason database server resources are being taxed. For example, if you have information showing that the number of users within your environment just doubled, then that may save you a lot of troubleshooting time.
Capturing SQL Server PerfMon Counters Using DMVs
Throughout this chapter, we have discussed a number of SQL Server counters and how to monitor your system using those counters in PerfMon. In SQL Server 2008, the DMV sys.dm_os_performance_counters contains the same performance counters stored within SQL Server. So instead of connecting the server and running the performance monitor, you can query the sys.dm_os_performance_counters DMV and track the results of the monitor in the database.
Leveraging the SQL Server Profiler
SQL Server Profiler is a graphical tool used to trace the events occurring within SQL Server. SQL Server Profiler uses a large number of events and filters to capture the data and information that interest you. From a monitoring perspective, SQL Server Profiler is an awesome tool to help you quickly identify what's running against your system or to monitor what's running on your system for a period of time. Using SQL Server Profiler, you can identify long-running queries, CPU-intensive queries, queries that utilize a large number of IO, and many more events. Now let's take a look at SQL Server Profiler and how to monitor events.
There are multiple ways to launch SQL Server Profiler. Within SQL Server Management Studio, click on Tools and the select SQL Server Profiler. You can also go to Start, All Programs ![]() Microsoft SQL Server 2008
Microsoft SQL Server 2008 ![]() Performance Tools, and finally select SQL Server Profiler. For this example, let's assume you connected to SQL Server Profiler from SQL Server Management Studio. Once SQL Server Profiler launches, connect to the server and instance that you want to capture events on. After you connect to the SQL Server instance, you will be directed to the Trace Properties dialog box, shown in Figure 14-14.
Performance Tools, and finally select SQL Server Profiler. For this example, let's assume you connected to SQL Server Profiler from SQL Server Management Studio. Once SQL Server Profiler launches, connect to the server and instance that you want to capture events on. After you connect to the SQL Server instance, you will be directed to the Trace Properties dialog box, shown in Figure 14-14.
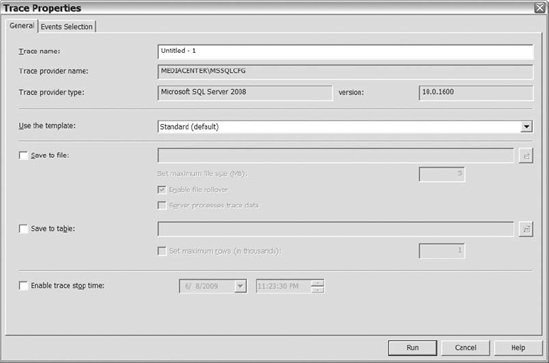
Figure 14-14. The General tab in the Trace Properties dialog box
Reviewing Figure 14-14, you will notice there are three decisions to make: which template you want to use, where you want to save the file, and if you want to enable a time for the trace to stop. You can decide if you want to store the data within a table or a file. If you are tracing events on a busy server, then you definitely don't want to write to table. You don't want to increase writes to the databases on your server.
The Enable Trace Stop Time option allows you to pick the date and time when you want the trace to stop. So if you want the trace to stop after a given time, then you can utilize this option so you don't have remember to manually stop the trace.
Microsoft has eight templates to help you trace events on your server. If none of the templates meets your needs, then don't hesitate to use the Standard template. Once you select the template that you want to use, click on the Events Selection tab. Figure 14-15 shows the default events in the Standard template on the Events Selection tab.
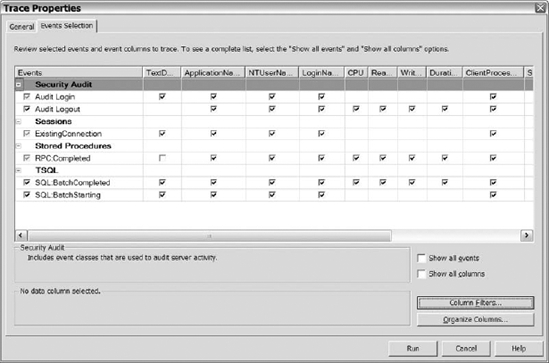
Figure 14-15. The Events Selection tab in the Trace Properties dialog
After you click this tab, you can select the Show All Events and Show All Columns check boxes. Show All Events displays all of the available events that you can monitor. Show All Columns displays all of the available columns for each event. You will quickly notice that there are a large number of events and columns to monitor to help you identify problems on SQL Server.
If you want to monitor events for a specific application, user, or any other available column on a monitored event, then you want to modify your trace to filter for that column. To add a filter to your trace, click on the Column Filters button, and the Edit Filter dialog box will load (see Figure 14-16).
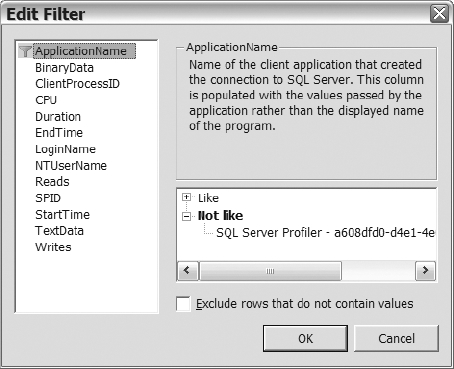
Figure 14-16. The Edit Filter dialog within SQL Server Profiler
Once you are on the Edit Filter dialog, select the column that you want to apply the filter to, and then add the text to the appropriate option on the right side of the dialog. Once you add all the filters that you want to apply and land back on the Events Selection tab, then go ahead and click on the Run button to start the trace.
One thing to keep in mind: Running SQL Serve Profiler on the server itself can cause an increase in CPU when you are capturing a large number of events. To prevent the increase in resource utilization caused by SQL Server Profiler you can run server side traces, which provide a minimal impact to your server.
Using Server-Side Tracing
Server-side tracing is a method used to trace events occurring within your system without the GUI interface. You specify events to trace, and filters to narrow your results, using the following stored procedures:
sp_trace_create: Creates the trace definitionsp_trace_event: Adds events and event columns to the trace definitionsp_trace_setFilter: Defines event filters to a trace
Use SQL Server Books Online to identify which parameters to supply to the sp_trace_event stored procedure in order to add specific events and columns to a trace. Once you create the trace, you can manage the trace (turn it on and off) by running the sp_trace_setstatus stored procedure. You can also view a list all the traces, including SQL Server Profiler traces, as well as the filters, events, and columns for those traces, by invoking the following set of trace functions:
fn_trace_getinfo(trace id): Retrieves the trace definition for a particular trace ID or all traces if you supply NULL as the parameter.fn_trace_geteventinfo(trace id): Identifies the events and columns specified for a trace.fn_trace_getfilterinfo(trace id): Displays the filters in place for the trace.
Now that you understand the stored procedures available to create a trace and the functions that allow you to review your trace definition, let's create a trace. Using SQL Server Profiler is the easiest way to do this. Within SQL Server Profiler, you can define the trace using the GUI, checking all of the appropriate boxes, and then script out the T-SQL to create the trace.
![]() Note We use the GUI of SQL Server Profiler to script out our trace files because it is easier than creating these scripts without assistance.
Note We use the GUI of SQL Server Profiler to script out our trace files because it is easier than creating these scripts without assistance.
To generate the T-SQL script from SQL Server Profiler, select the events, filters, and columns that you want in your trace, then start your trace and stop it immediately. After the trace stops, navigate to the File option, select Export ![]() Script Trace Definition
Script Trace Definition ![]() For SQL Server 2005-2008. Specify a file name and then click on OK. You will get a file with a trace definition, such as the one in Listing 14-4. Once you have the trace scripted, you can execute that script to create the trace. You can also add new events, columns, and filters as you see fit.
For SQL Server 2005-2008. Specify a file name and then click on OK. You will get a file with a trace definition, such as the one in Listing 14-4. Once you have the trace scripted, you can execute that script to create the trace. You can also add new events, columns, and filters as you see fit.
Listing 14-4. T-SQL Script for Creating a Server-Side Trace
/****************************************************/

/* Created by: SQL Server 2008 Profiler */

/* Date: 03/25/2009 11:43:51 PM */

/****************************************************/


-- Create a queue

DECLARE @rc int

DECLARE @TraceID int

DECLARE @maxfilesize bigint

SET @maxfilesize = 5


-- Please replace the text InsertFileNameHere, with an appropriate

-- file name prefixed by a path, e.g., c:MyFolderMyTrace. The .trc extension

-- will be appended to the file name automatically. If you are writing from

-- remote server to local drive, please use UNC path and make sure server has

-- write access to your network share.


EXEC @rc = sp_trace_create @TraceID output, 0,

N'InsertFileNameHere', @maxfilesize, NULL

if (@rc != 0) goto error

-- Client-side file and table cannot be scripted


-- Set the events

DECLARE @on bit

SET @on = 1

EXEC sp_trace_setevent @TraceID, 10, 15, @on

exec sp_trace_setevent @TraceID, 10, 16, @on

EXEC sp_trace_setevent @TraceID, 10, 9, @on

EXEC sp_trace_setevent @TraceID, 10, 17, @on

EXEC sp_trace_setevent @TraceID, 10, 2, @on

EXEC sp_trace_setevent @TraceID, 10, 10, @on

EXEC sp_trace_setevent @TraceID, 10, 18, @on

EXEC sp_trace_setevent @TraceID, 10, 11, @on

EXEC sp_trace_setevent @TraceID, 10, 12, @on

EXEC sp_trace_setevent @TraceID, 10, 13, @on

EXEC sp_trace_setevent @TraceID, 10, 6, @on

EXEC sp_trace_setevent @TraceID, 10, 14, @on

EXEC sp_trace_setevent @TraceID, 12, 15, @on
EXEC sp_trace_setevent @TraceID, 12, 16, @on

EXEC sp_trace_setevent @TraceID, 12, 1, @on

EXEC sp_trace_setevent @TraceID, 12, 9, @on

EXEC sp_trace_setevent @TraceID, 12, 17, @on

EXEC sp_trace_setevent @TraceID, 12, 6, @on

EXEC sp_trace_setevent @TraceID, 12, 10, @on

EXEC sp_trace_setevent @TraceID, 12, 14, @on

EXEC sp_trace_setevent @TraceID, 12, 18, @on

EXEC sp_trace_setevent @TraceID, 12, 11, @on

EXEC sp_trace_setevent @TraceID, 12, 12, @on

EXEC sp_trace_setevent @TraceID, 12, 13, @on


-- Set the filters

DECLARE @intfilter int

DECLARE @bigintfilter bigint


EXEC sp_trace_setfilter @TraceID, 10, 0, 7,

N'SQL Server Profiler - c97955a1-dbf3-4cc8-acc0-4606f7800ab7'

-- Set the trace status to start

EXEC sp_trace_setstatus @TraceID, 1


-- display trace ID for future references

SELECT TraceID=@TraceID

GOTO finish


error:

SELECT ErrorCode=@rc


finish:

GO
Automating Your Monitoring
Sometimes starting SQL Server Profiler, reviewing DMVs, or adding counters to the performance monitor after a reported issue is too late to identify what caused the issue. Often times, when you are periodically having problems or want to baseline your server, it is a good idea to automate the monitoring of your server. By automating, we mean automatically taking a snapshot of your DMVs on a routine basis so you can accurately identify the changes over time, start a trace on your server without you or someone on your team having to do it, and capturing predetermined counters without having to start the performance monitor. The idea is that your system will capture the different things you want monitored so you can review them when issues arrive. The following list provides you with some methods for automating the monitoring of DMVs, the performance monitor, and tracing.
- DMVs: Store the results of the DMVs into a permanent table by creating a job that retrieves the data from the views. That way, you do not lose the information stored within those DMVs when SQL Server shuts down.
- Tracing: Set up a job or other automated process to execute a trace script created using the methods discussed in the “Using Server-Side Tracing” section whenever SQL Server starts. Setting up a process that automatically creates a trace does not cause issues unless you forget to set the option that minimizes the size of your files before a rollover occurs. You should also clean up your trace files before you fill up your drives and make sure the file name you specify during the creation of a new trace does not refer to an already existing file that you want to keep. We generally append a date and time to the file name to get by that last issue.
- Performance monitor: Determine the counters that you want to monitor and add them to the Trace section of the performance monitor. Make sure you set a file rollover size to prevent the file from taking up all the space on your server. Create a shortcut to reside in a location that starts and stops performance monitor traces. Implement a process that says when the server starts, then run a batch file or a similar process that executes the shortcut to start the trace. That way, when the server starts, your performance monitor data will start capturing as well.
Now you can automatically capture information about the performance of your system, and you should have the information needed to compare against your baseline. Once you have identified a change in performance from your baseline—whether in CPU, memory, or disk IO—then you want to identify the queries that are causing the change. (Chapter 16 discusses methods for determining what queries are the troublemakers.)
Summary
As we conclude this chapter, we hope that you have learned useful information to assist you while monitoring your server(s). As a database administrator, it is important to proactively monitor your environments to make sure you know what's going on prior to being notified by customers. Being aware of your resource utilization is crucial to ensuring that the application continues to perform as expected. Once you know that you have a resource problem (with CPU, memory, or disk IO), you should attempt to improve the queries impacting those resources before purchasing additional hardware. (Chapter 15 discusses methods for monitoring your server from a security perspective.)