
![]()
Logging, Error Handling, and Debugging
D-1. Logging
Logging is an integral part of any application. It helps developers and support personnel monitor the execution path under different scenarios and diagnose the problems. A well implemented logging mechanism in the application reduces the time to identify the root cause of the problem. Developers should be careful about the amount of logging they implement in the application. On the one hand logging is very helpful but on the other hand, too much logging impacts performance and requires a huge amount of disk storage.
Because a security mechanism is built into most browsers which prevents JavaScript from writing to a file on the client’s machine/device, it is not possible to log messages in a file on the client side. JavaScript code can write log messages by using the following mechanism:
- Write messages to the browser’s console
- Write messages to the current web page
- Write messages to pop-up web page
- Send messages to the server using asynchronous AJAX calls
Basic Logging
The newer versions of all major browsers provide access to their web console. In JavaScript, you can use Console APIs to log messages in the browser’s web console. Refer to the Recipe B-2 in Appendix B for the details about how to use the web console in various browsers. The following are the console APIs that can be used in JavaScript:
- console.log(message) logs a message to the web console where the parameter message can be a text string, variable, or expression.
- console.warn(message) logs a message to the web console with the warning icon.
- console.error(message) logs a message to the web console with the error icon.
- console.dir(object) logs an object’s structure, its properties, and the property’s values.
Listing D-1 shows the use of console APIs.
Listing D-1. Console APIs
<!DOCTYPE html>
<html lang="en">
<head>
    <meta charset="utf-8">

    <script>
              console.log("Test Message");
              console.warn("Test Warning Message");
              console.error("Test Error Message");

              // Create object
       var obj = new Object();
       obj.id = 1;
       obj.name = "John Smith";

       var departments = new Object();
       departments.department1 = "Infrastructure";
       departments.department2 = "Development";

       obj.departments = departments;

       console.dir(obj);
    </script>
</head>

<body></body>
</html>
To open the console window in the Firefox browser, click Open Menu in the top-right corner of the browser, click Developer, and then click Web Console. Figure D-1 displays the log messages in the Firefox browser console. Make sure that the Logging tab is active (that it’s clicked to display logging messages). Message display styles are slightly different in other browsers.
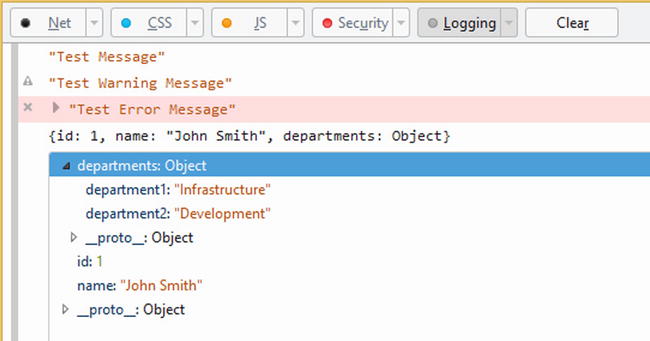
Figure D-1. Output of console APIs in the Firefox browser
To open the console window in the Chrome browser, click the Customize and Control button in the top-right corner of the browser, click Tools, and then click Developer Tools. Figure D-2 displays the log messages in the Chrome browser console. Make sure that the Console tab is active (it is clicked to display logging messages).
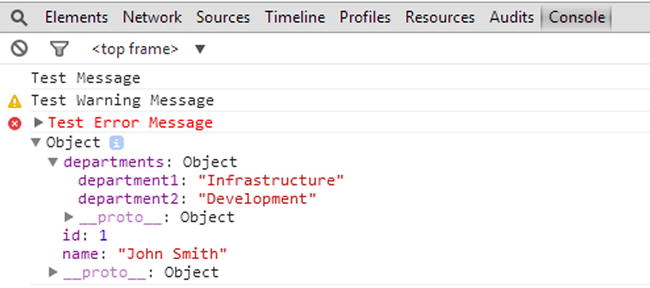
Figure D-2. Output of the console APIs in the Chrome browser
To open the console window in Internet Explorer browser, click the Tools button in the top-right corner of the browser and then click F12 Developer Tools. Figure D-3 displays the log messages in the Internet Explorer browser console. If you have opened the console after loading the HTML page and the messages are not displayed in the console, refresh the page to see the messages in the console.
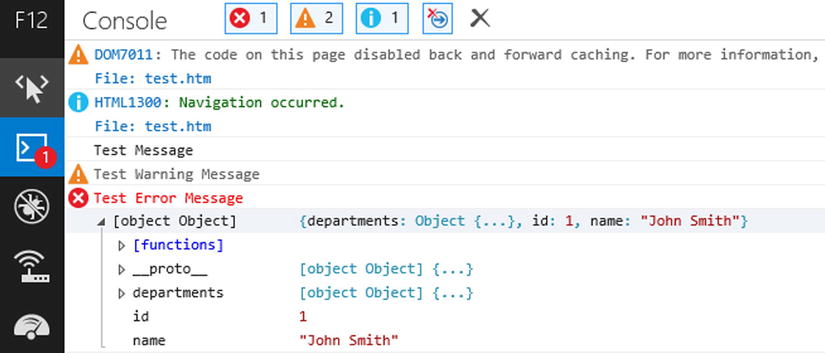
Figure D-3. Output of console APIs in the Internet Explorer browser
To open the console window in the Safari browser, click Display a Menu for the Current Page button in the top-right corner of the browser, click Develop, and then click Show Error Console. If the Develop menu item is not available, make sure that the Show Develop Menu in Menu Bar checkbox is checked under Safari Settings ![]() Preferences
Preferences ![]() Advanced tab. Figure D-4 displays the log messages in the Safari browser console.
Advanced tab. Figure D-4 displays the log messages in the Safari browser console.
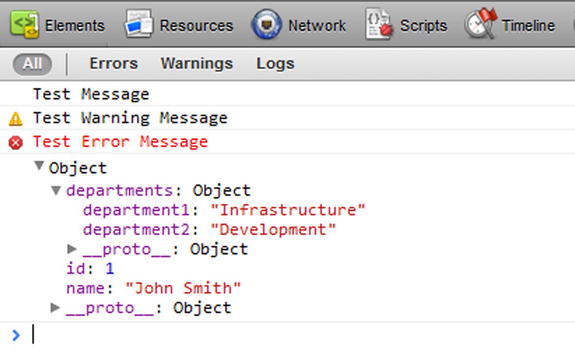
Figure D-4. Output of console APIs in the Safari browser
Logging Framework
There are many open source JavaScript logging frameworks available. I like the Log4JavaScript framework as it is based on the industry standard and widely used Log4J logging framework. I’ll cover the basics of the log4javascript library in this appendix. One of the main advantages of using this framework is that you can easily change the logging severity level without making code changes in many places. For example, you can set the logging severity as ALL during the development and when the code is deployed in production, just change the logging severity to ERROR without making any other changes in the code. If you want to investigate an issue in production, you can change the severity to DEBUG. Without such logging frameworks, developers have to comment and uncomment logging messages all the time during various stages of the development lifecycle, which is time-consuming and prone to errors.
To download the log4javascript library, go to http://log4javascript.org and click the Download button. At the time of this writing, the latest version is 1.4.9. After you have downloaded the file log4javascript-1.4.9.zip, extract all the files from it. Copy log4javascript-1.4.9jslog4script.js to the scripts/ directory under your development root directory.
Log4JavaScript has the following five main concepts, all of which are used to log messages:
- Loggers
- Appenders
- Severity level (optional)
- Pattern layout (optional)
- Log messages
Loggers
The logger is the named reference pointer to which appenders are added, severity levels are set, and methods are executed to log the messages. A web page can have multiple named loggers. Multiple loggers are useful if you want to send different messages to different logging targets (different appenders).
Appenders
The appender specifies where the log messages will be sent/logged. Multiple appenders can be added to the same logger. The following is a list of appenders:
- AlertAppender—Displays messages as JavaScript alerts. The syntax to create an AlertAppender is:
var appender = new log4javascript.AlertAppender(); - AjaxAppender—Asynchronously sends messages to the server. You need to write the server-side program to accept the message from the JavaScript code and log it to a file, to a database table, or to the event log. The syntax to create an AjaxAppender is:
var appender = new log4javascript.AjaxAppender(url);
where url is the server-side program URL (for example, the web service URL).
- PopUpAppender—Displays messages in a console window (pop-up window). You need to set the browser to allow pop-ups. The syntax to create a PopUpAppender is:
var appender = new log4javascript.PopUpAppender(); - InPageAppender—Displays messages to a console window in the page. The syntax to create an InPageAppender is:
var appender = new log4javascript.InPageAppender(); - BrowserConsoleAppender—Displays messages to the browser’s built-in console. The syntax to create a BrowserConsoleAppender is:
var appender = new log4javascript.BrowserConsoleAppender();
Severity Level
The severity level of the logger specifies the severity level of the messages that will be logged. There are six types of message severities—TRACE, DEBUG, INFO, WARN, ERROR, and FATAL. The following is the ascending order of the severity levels. You can set the level on the logger. When the logger is used to log the message, only those messages that have the same or a higher level will be logged. For example, if the logger’s level is set to ERROR, messages with a severity of ERROR or FATAL will be logged. This level is preferable in the production environment. If the logger’s level is set to ALL, messages with the severity TRACE, DEBUG, INFO, WARN, ERROR, and FATAL will be logged. This level is preferable in the development environment. If the level is not explicitly set on the logger, the default value of DEBUG is used, which means the messages with the severity DEBUG, INFO, WARN, ERROR, and FATAL will be logged.
- ALL
- TRACE
- DEBUG
- INFO
- WARN
- ERROR
- FATAL
- OFF
Pattern Layout
The pattern layout specifies the pattern of the logged messages. It is set at the appender level. For example, "%c %d - %m%n" specifies the following:
- %c —The name of the logger
- %d—The date and time of the message logging
- %m—The message
- %n—The new line separator
For the complete list of patterns and formatting, refer to this site: http://log4javascript.org/docs/manual.html#layouts.
Log Messages
You can log messages with various severity settings by using following statements:
log.trace("message");
log.debug("message");
log.info("message");
log.warn("message");
log.error("message");
log.fatal("message");
where log is the logger that has at least one appender added to it and message is the message to be logged.
You should set up the loggers with the appenders, level, and pattern layout at the global level so that changes in the severity level can be set or an appender can be changed in one place only. Once a logger is set at the global level, it can be used anywhere in the page within the JavaScript code.
Listing D-2 demonstrates a basic example of using the log4javascript library.
Listing D-2. Basic logging
<!DOCTYPE html>
<html lang="en">
<head>
    <meta charset="utf-8">
    <script src="scripts/log4javascript.js"></script>

    <script>
              // Set Logger
              var log = log4javascript.getLogger("myLogger");

              // Get Appender
              var appender = new log4javascript.InPageAppender();

              // Set message pattern
              var layout = new log4javascript.PatternLayout("%c %d - %m");
              appender.setLayout(layout);

              // Set Appender
              log.addAppender(appender);


              // Set Level
              log.setLevel(log4javascript.Level.ALL);

              // Log Message
              log.info("This is the test message.");
    </script>
</head>
<body></body>
</html>
Figure D-5 displays the log message at the bottom of the web page when the page is viewed in a browser.
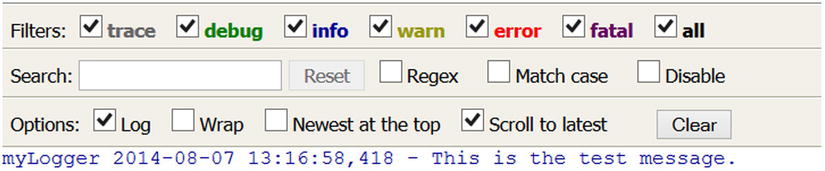
Figure D-5. Output due to the InPageAppender
You can filter and search all the logged messages. You can also set options to log, wrap, bring the newest message to the top, and scroll to the latest message.
The following code segments show different logger types and appenders:
- To use the default logger (i.e., the logger with the PopUpAppender):
var log = new log4javascript.getDefaultLogger();
log.info("This is informational message"); - To use the named logger with PopUpAppender:
var log = log4javascript.getLogger("myLogger");
var appender = new log4javascript.PopUpAppender();
log.addAppender(appender);
log.info("This is informational message"); - To use the multiple loggers:
var log = log4javascript.getLogger("client");
var appender = new log4javascript.InPageAppender();
log.addAppender(appender);
log.error("This is the client error message");

var devLog = log4javascript.getLogger("development");
var devAppender = new log4javascript.PopUpAppender();
devLog.addAppender(devAppender);
devLog.debug("This is the debug message");
Messages logged by the log logger will go to the inline window and messages from the devLog logger will go to the pop-up window. In real-world applications, all error and fatal-level logs should go to the log with the appender AjaxAppender so that all error and fatal messages can be logged to a central location on the server side and can be used by developers and production support personnel to diagnose the problem.
- To use the same logger and multiple appenders:
var log = log4javascript.getLogger("main");

var appender1 = new log4javascript.InPageAppender();
log.addAppender(appender1);

var appender2 = new log4javascript.PopUpAppender();
log.addAppender(appender2);


log.error("This is the client error message");
The messages will be logged in two places—inline, that is, on the same web page, and in the pop-up window.
D-2. Error Handling
If an error occurs during runtime and it’s not handled in the JavaScript code, no error message will be displayed to the user. If you open the browser’s web console you can see those messages as unhandled exceptions. For example, if you view a page with the following code in a browser, no error message will be displayed and the JavaScript code execution will terminate at the point of error.
displayMessage("My Message");
Due to the missing function—displayMessage()—an exception will be thrown by the code. If you open the browser console window, you will see the following error message:
"ReferenceError: displayMessage is not defined"
These four statements handle JavaScript exceptions:
- try—Wraps the code that you want to test for an error.
- catch—Code segment that’s executed if an error occurs in the code within a try() block.
- finally—Code segment that’s executed regardless of an error or no error.
- throw—Statement to throw the custom exception back to the caller. It is used for displaying a user friendly error and for forcing an exception for the cases like validation error.
Try and Catch
Listing D-3 demonstrates an example where an error is caught and handled.
Listing D-3. Using try and catch for exception handling
<!DOCTYPE html>
<html lang="en">
<head>
    <meta charset="utf-8">

    <script>
              try {
           // some code
           displayMessage("My Message");
              }
              catch (errorMsg) {
           alert("Error: " + errorMsg);
              }
    </script>
</head>

<body></body>
</html>
When this page is viewed in a browser and the JavaScript code is executed, an exception (error) is thrown at the line displayMessage("My Message"); and the JavaScript code is not executed further within the try block. Execution control will go to the catch block. The parameter errorMsg in the catch statement contains the text of the error message. In the catch block, you can handle this error condition any way you want. Some of the possible actions you can take are to:
- Display the exact error message.
- Display a user friendly error message.
- Try to re-execute the same block of the code that threw the exception. This action is relevant for the error conditions like a timeout error.
- Use the log4javascript framework to send the message to the server.
Figure D-6 displays the error message as a pop-up message.
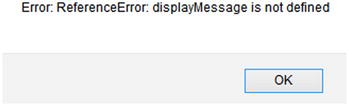
Figure D-6. Displaying an error message
Finally
Listing D-4 shows the use of the finally statement. The code segment within the finally block is executed at the end of the try and catch blocks, regardless of whether code execution is completed in the try block or in the catch block. Generally, clean-up tasks like closing the connection or re-initializing variables are coded in the finally block.
Listing D-4. Using a finally statement
<!DOCTYPE html>
<html lang="en">
<head>
    <meta charset="utf-8">

    <script>

              var status = "";

       try {
                  testFunc();
                  status = "Successful";
              } catch (err) {
           status = "Failed";
              } finally {
                  alert("DOM ready function is completed with the status: " + status);
                  // Cleanup or reinitialization code
              }
    </script>
</head>

<body></body>
</html>
Figure D-7 displays the pop-up message with the status as Failed because testFunc() doesn’t exist. An exception has occurred and the status is set to Failed in the catch block.
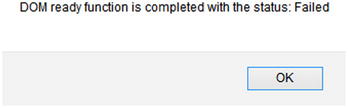
Figure D-7. Display error message from the finally block
If the testFunc() function exists in the JavaScript code, the following message will be displayed:
“DOM ready function is completed with the status: Successful”
Throw
Listing D-5 shows the use of the throw statement. By using the throw statement, you can throw an exception with the custom message. The throw statement can be used anywhere in the JavaScript code (not necessarily in the catch block only).
Listing D-5. Using a throw statement
<!DOCTYPE html>
<html lang="en">
<head>
    <meta charset="utf-8">

    <script>
              function testFunc() {
           try {
              // some code
              displayMessage("My Message");
           }
           catch (errorMsg) {
             throw "Programming error occurred.";
           }
              }

              try {
                  testFunc();
       } catch (err) {
           alert(err);
       }
    </script>
</head>

<body></body>
</html>
Figure D-8 displays the Programming Error Occurred pop-up message. Because displayMessage() doesn’t exist, the code in the catch block is executed, and it has thrown the custom error message—"Programming error occurred"—to the caller function.
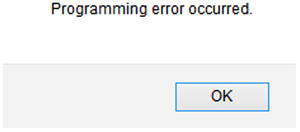
Figure D-8. Displaying a custom error message
If the same variable is referenced in try and also in catch or finally, it should be declared outside the try, catch, and finally blocks because the scope of the variable declared within the try, catch, and finally block is limited to that block only.
D-3. Debugging
Debugging is the process whereby developers can execute a single line of code at a time and then view the value of the variables (primitive and objects) at any step in the code-execution process (provided the variable is still in the scope). Debugging is helpful in finding bugs and fixing them quickly. This section covers how to debug a simple program using the Firefox browser. Listing D-6 contains a simple program in which an employee object is set and then used to display all the departments for the employee.
Listing D-6. Setting and getting the employee’s object (the filename is debug.htm)
<!DOCTYPE html>
<html lang="en">
<head>
    <meta charset="utf-8">

    <script>
              function displayDepartments(employeeObject) {
                  for (var i=0; i<employeeObject.departments.length; i++) {
                            // Display department names of the employee
                            alert(employeeObject.departments[i]);
                  }
              }

       // Create employee object
       var empObj = new Object();

       // Set employee object
       empObj.id = 1;
       empObj.name = "John Smith";

       // Set department names in an array
       var departments = new Array();
       departments.push("Infrastructure");
       departments.push("Development");

       // Set departments for the employee
       empObj.departments = departments;

       // Call displayDepartments() function
       displayDepartments(empObj);
    </script>

</head>

<body></body>
</html>
The following is the list of steps that need to be performed to debug the code:
- Open debug.htm in the Firefox browser. Click OK for the pop-up messages.
- Open the Firefox browser’s debug window by clicking the Open Menu button on the top-left corner (the button with three horizontal lines) and then clicking the Developer button. Figure D-9 displays how to start the debugger window.
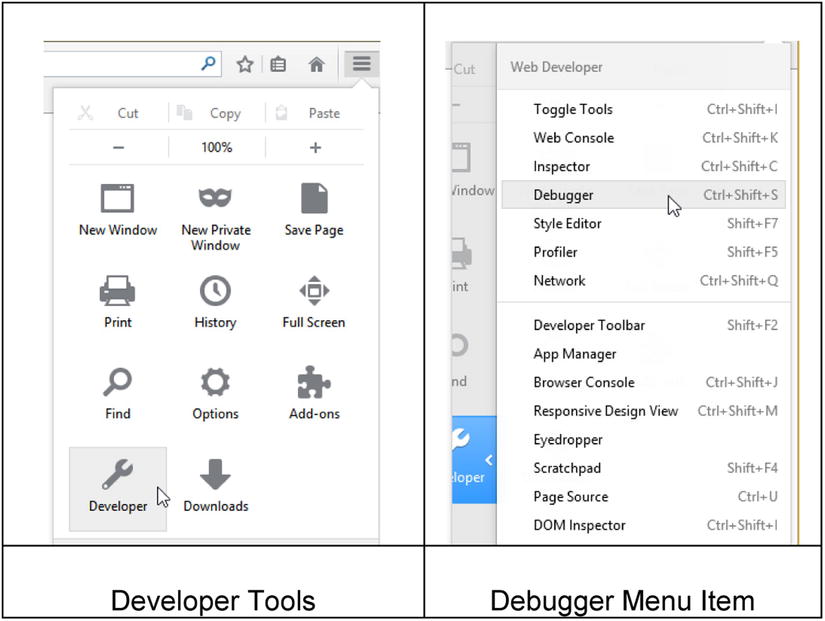
Figure D-9. Opening the Firefox debugger window
- Click Debugger or press Ctrl-Shift-S. Figure D-10 displays the debugger window.
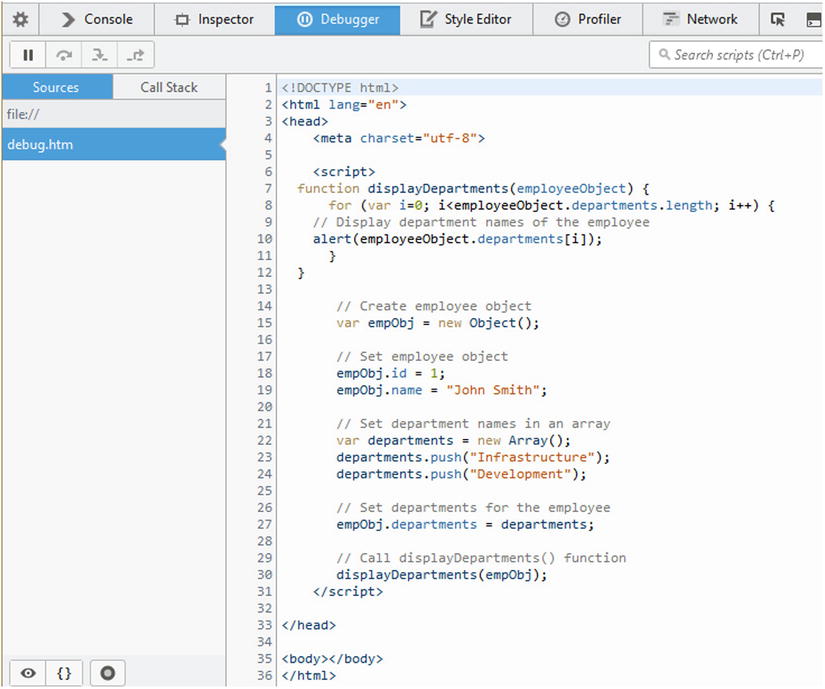
Figure D-10. The debugger window with the source code
In the source code window, you can set or remove the breakpoints by clicking the gray area left to the line numbers. The breakpoint is the place in the code where code execution will stop so that the developers can step over it or through it. Let’s set up the breakpoints at the line numbers 10 and 27. When you refresh the page, you will see Figure D-11 with the line where the code execution has stopped highlighted.
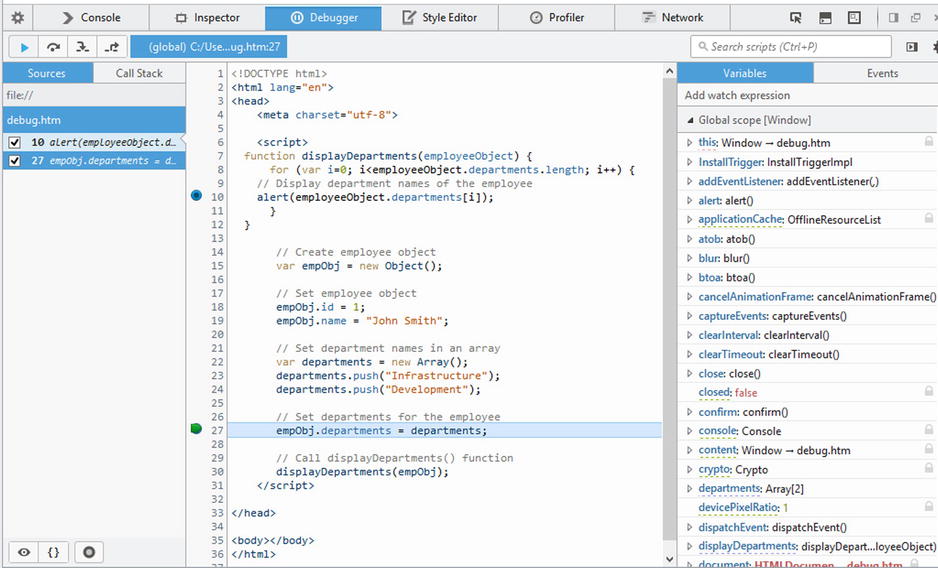
Figure D-11. Debugger window with the breakpoints in the source code
Code execution buttons are located at the top left-corner of the debugger window. In Figure D-12, code execution buttons are displayed. The first button (Resume) continues the code execution up to the next breakpoint or up to the end of the code. The second button (Step Over) executes the current statement. The third button (Step In) steps inside the function (if the breakpoint line contains a function). The fourth button (Step Out) steps out of the current function.
![]()
Figure D-12. Code execution buttons
Click the Step Over button. At this point all properties of the employee objects are set. If you want to see the elements of the empObj, click empObj and then click Watch. Figure D-13 displays empObj in the Watch expression window.
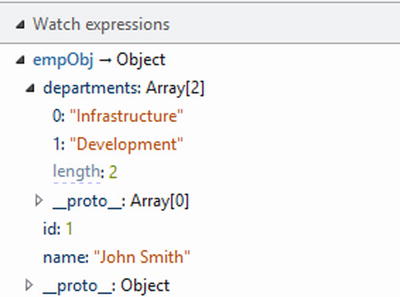
Figure D-13. Watch expression for empObj
From this watch expression, you can change the value of the variable or properties of the object at runtime. This is helpful if you find a bug. Instead of having to terminate the debugger session, make the code changes, and then restart the debugger, you can change the value(s) at the debugging time and continue the code execution. If you get the expected result, you can make the code changes after the debugging is completed. For example, in this example I changed the value of second department from “Development” to “Support” by clicking the value Development, entering a new value called Support, and then pressing Enter. Figure D-14 displays the updated value of the second department name.
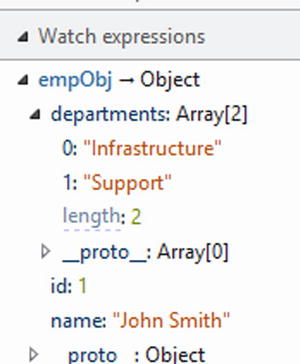
Figure D-14. Watch expression for empObj with updated department
Now press the Resume button to jump to the next breakpoint. By clicking the Resume or Step Over buttons, you can see the Infrastructure pop-up message. Click OK from this pop-up message and then click Resume or Step Over again. This time you will see the Support pop-up message. Click OK and then the Resume button to execute until the end of the code.
The newer versions of other browsers have similar debugging capabilities.