THE IMPACT OF COLLEGE SPORTS SUCCESS ON THE QUANTITY AND QUALITY OF STUDENT APPLICATIONS
Devin G. Pope and Jaren C. Pope
1. INTRODUCTION
Since the beginning of intercollegiate sports, the role of athletics within higher education has been a topic of heated debate.1 Whether to invest funds into building a new football stadium or to improve a school’s library can cause major disagreements. Lately the debate has become especially contentious as a result of widely publicized scandals involving student athletes and coaches and because of the increasing amount of resources schools must invest to remain competitive in today’s intercollegiate athletic environment. Congress has recently begun to question the National Collegiate Athletic Association’s (NCAA) role in higher education and its tax-exempt status. Representative Bill Thomas asked the president of the NCAA, Dr. Myles Brand, in 2006: “How does playing major college football or men’s basketball in a highly commercialized, profit-seeking, entertainment environment further the educational purpose of your member institutions?”2
Some analysts would answer Representative Thomas’s question by suggesting that sports does not further the academic objectives of higher education. They would argue that intercollegiate athletics is akin to an “arms race” because of the rank-dependent nature of sports, and that the money spent on athletic programs should be used to directly influence the academic mission of the school instead. However, others suggest that because schools receive a variety of indirect benefits generated by athletic programs, such as student body unity, increased student body diversity, increased alumni donations, and increased applications, athletics may act more as a complement to a school’s academic mission than a substitute for it. Until recently, evidence for the indirect benefits of the exposure provided by successful athletic programs was based more on anecdote than empirical research.3 Early work by Coughlin and Erekson (1984) looked at athletics and contributions but also raised interesting questions about the role of athletics in higher education. Another seminal paper (McCormick and Tinsley 1987) hypothesized that schools with athletic success may receive more applications, thereby allowing the schools to be more selective in the quality of students they admit. They used data on average SAT scores and in-conference football winning percentages for 44 schools in “major” athletic conferences for the years 1981–1984 and found some evidence that football success can increase average incoming student quality.4 Subsequent research has further tested the increased applications (quantity effect) and increased selectivity (quality effect) hypotheses of McCormick and Tinsley but has produced mixed results.5 The inconsistent results in the literature are likely the product of (1) different indicators of athletic success, (2) a limited number of observations across time and across schools, which has typically necessitated a cross-sectional analysis, and (3) different econometric specifications.
This study extends the literature on the indirect benefits of sports success by addressing some of the data limitations and methodological difficulties of previous work. To do this we constructed a comprehensive data set of school applications, SAT scores, control variables, and athletic success indicators. Our data set is a panel of all (approximately 330) NCAA Division I schools from 1983 to 2002. Our analysis uses plausible indicators for both football and basketball success, which are estimated jointly in a fixed effects framework. This allows a more comprehensive examination of the impact of sports success on the quantity and quality of incoming students. Using this identification strategy and data, we find evidence that both football and basketball success can have sizeable impacts on the number of applications received by a school (in the range of 2–15%, depending on the sport, level of success, and type of school), and modest impacts on average student quality, as measured by SAT scores.
Because of concerns with the reliability of the self-reported SAT scores in our primary data set, we also acquired a unique administrative data set that reports the SAT scores of high school students preparing for college to further understand the average “quality” of the student that sports success attracts. These individual-level data are aggregated to the school level and allow us to analyze the impact of sports success on the number of SAT-takers (by SAT score) who sent their SAT scores to Division I schools. Again, the panel nature of the data allows us to estimate a fixed effects model to control for unobserved school-level variables. The results of this analysis show that sports success has an impact on where students send their SAT scores. This analysis confirms and expands the results from the application data set. Furthermore, this data makes it clear that students with both low and high SAT scores are influenced by athletic events.6
Besides increasing the quality of enrolled students, schools have other ways to exploit an increased number of applications due to sports success: through increased enrollments or increased tuition. Some schools that offer automatic admission to students who reach certain quality thresholds may be forced to enroll more students when the demand for education at their school goes up. Using the same athletic success indicators and fixed effects framework, we find that schools with basketball success tend to exploit an increase in applications by being more selective in the students they enroll. Schools with football success, on the other hand, tend to increase enrollments.
Throughout our analysis, we illustrate how the average effects that we find differ between public and private schools. We find that this differentiation is often of significance. Specifically, we show that private schools see increases in application rates after sports successes that are two to four times higher than seen by public schools. Furthermore, we show that the increases in enrollment that take place after football success are mainly driven by public schools. We also find some evidence that private schools exploit an increase in applications due to basketball success by increasing tuition rates.
We think that our results significantly extend the existing literature and provide important insights about the impact of sports success on college choice. As Siegfried and Getz (2006) recently pointed out, students often choose a college or university based on limited information about reputation. Athletics is one instrument that institutions of higher education have at their disposal that can be used to directly affect reputation and the prominence of their schools.7 Our results suggest that sports success can affect the number of incoming applications and, through a school’s selectivity, the quality of the incoming class. Whether or not the expenditures required to receive these indirect benefits promote efficiency in education is certainly not determined in the present analysis. Nonetheless, with the large and detailed data sets we acquired, combined with the fixed effect specification that included both college basketball and football success variables, while controlling for unobserved school-specific effects, it is our view that the range of estimates showing the sensitivity of applications to college sports performance can aid university administrators and faculty in better understanding how athletic programs relate to recruitment for their respective institutions.
Section 2 of this article provides a brief literature review of previous work that has investigated the relationship between a school’s sports success and the quantity and quality of students that apply to that school. Section 3 describes the data used in the analysis. Section 4 presents the empirical strategy for identifying school-level effects due to athletic success. Section 5 describes the results from the empirical analysis. Section 6 concludes the study.
2. LITERATURE REVIEW
Athletics is a prominent part of higher education. Yet the empirical work on the impact of sports success on the quantity and quality of incoming students is surprisingly limited. Since the seminal work by McCormick and Tinsley (1987), there have been a small number of studies that have attempted to provide empirical evidence on this topic. In this section we review these studies to motivate the present analysis.
Table 13 provides a summary of the previous literature.8 The table is divided into two panels. Panel A describes the studies that have directly or indirectly looked at the relationship between sports success and the quantity of incoming applications. These studies have found some evidence that basketball and football success can increase applications or out-of-state enrollments. Panel B describes the studies that have looked at the relationship between sports success and the quality of incoming applications. These studies all reanalyze the work of McCormick and Tinsley (1987) using different data and control variables. The results of these studies are mixed. Some of these analyses find evidence for football and basketball success affecting incoming average SAT scores; whereas, others do not.
Differences in how the studies measured sports success make it difficult to compare the primary results of these studies. For example, Mixon and Hsing (1994) and McCormick and Tinsley (1987) use the broad measures of being in either various NCAA and National Association of Intercollegiate Athletics (NAIA) athletic divisions or “big-time” athletic conferences to proxy prominent and exciting athletic events at a university. Basketball success was modeled by Bremmer and Kesselring (1993) as being the number of NCAA basketball tournament appearances prior to the year the analysis was conducted. Mixon (1995) and Mixon and Ressler (1995), on the other hand, use the number of rounds a basketball team played in the NCAA basketball tournament. Football success was measured by Murphy and Trandel (1994) and McCormick and Tinsley as within-conference winning percentage. Bremmer and Kesselring used the number of football bowl games in the preceding 10 years. Finally, Tucker and Amato (1993) used the Associated Press’s end-of-year rankings of football teams. While capturing some measures of historical athletic success, many of these variables may fail to capture the shorter-term episodic success that is an important feature of college sports.
Perhaps more important to the reliability of the results of these studies than the differences in how sports success was measured are the data limitations they faced and the resulting identification strategies employed. All of the analyses except for that of Murphy and Trandel (1994) use a single year of school information for a limited set of schools.9 For example, Mixon and Ressler (1995) collected data from Peterson’s Guide for one year and 156 schools that participate in Division I-A collegiate basketball. The lack of temporal variation in these data necessitates a cross-sectional identification strategy. A major concern with cross-sectional analyses of this type is the possibility that there is unobserved school-specific information, correlated with sports success, that may bias estimates. In fact, much of the debate surrounding differences in estimates in these cross-sectional analyses hinges on arguments about the “proper” school quality controls to include in the regressions. Another concern is the college guide data typically used. It is widely known that the self-reported data (especially data on SAT scores) from sources such as U.S. News & World Report and Peterson’s can have inaccuracies or problems with institutions not reporting data.10
….
Table 13 Summary of Previous Literature
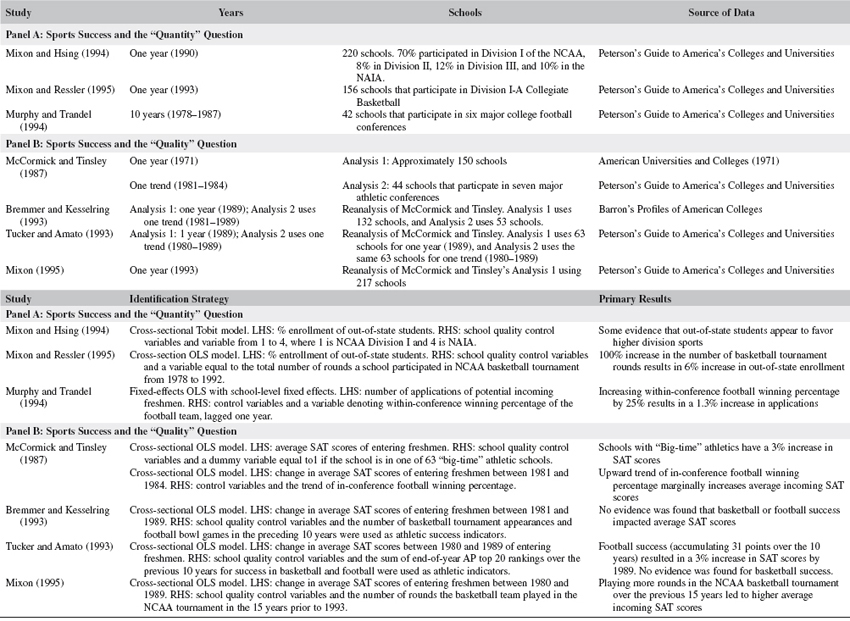
LHS = left-hand side; RHS = right-hand side.
Source: Southern Economic Journal. Used with permission.
3. PRIMARY DATA SOURCES
… Athletic success likely has two primary components that affect college choice decisions: historic athletic strength and episodic athletic strength. The data sets we use allow us to control for historic athletic strength and analyze episodic athletic strength.
We use three primary data sets to conduct our empirical analysis. Each of these data sets is compiled so that the unit of observation is an institution of higher education that participates in Division I basketball or Division I-A football. The first data set is a compilation of sports rankings, which are used to measure athletic success. The second data set provides school characteristics, including the number of applications, average SAT scores, and the enrollment size for each year’s incoming class of students. The third data set provides the number of SAT scores sent to each institution of higher education. The main features of these three data sets are discussed in more detail below.
Football and Basketball Success Indicators
Our indicator of football success is the Associated Press’s college football poll….
It is widely agreed that the greatest media exposure and indicator of success for a men’s college basketball team (particularly on a national level) comes from the NCAA college basketball tournament. “March Madness,” as it is often called, takes place at the end of the college basketball season during March and the beginning of April. It is a single elimination tournament that determines who wins the college basketball championship. Before 1985, 48–53 teams were invited to the tournament each year. Since 1985, 64 teams have been invited to play each year.13 We collected information on all college basketball teams that were invited to the tournament between 1980 and 2003. From these data we created dummy variables that indicate the furthest round in which a team played. In our analysis, we use the rounds of 64, 16, 4, and champion. A team’s progress in the NCAA tournament provides a good proxy of a basketball team’s success in any given year during the time frame of the data.
….
College Data
As discussed in Section 2, a weakness of earlier studies on the impacts of athletic success was the limited number of observations across time and across schools. In an attempt to rectify this shortcoming, we purchased access to a licensed data set from the Thomson Corporation that contains detailed college-level data. Thomson Corporation is the company that publishes the well-known “Peterson’s Guide to Four Year Colleges.” … We restrict the data set to the 332 schools that participated in NCAA Division I basketball or Division I-A football between 1983 and 2002.
….
SAT Test-Takers Database
The third data set that we use is derived from the College Board’s Test-Takers Database (referred to as SAT database in the remainder of the paper).15 ….
After completing the test and questionnaire, students may indicate up to four colleges where their test scores will be sent for free. Students may also send their scores to additional schools at a cost of $6.50 per school. The data set identifies up to 20 schools to which a student has requested his scores be sent.18 ….
The SAT data set will allow us to further explore how college applicants with different SAT exam scores are affected by football and basketball success. Unlike the self-reported data from sources such as Peterson’s Guide, all the data in the SAT database are reported, and inaccuracies are almost nonexistent. These data also allow us to better analyze the impact of sports success on the SAT score sending of students with high, middle, and low SAT scores. By aggregating these high-quality individual-level data to the school level, the impact of sports success on the quality of incoming SAT scores that a school receives can be analyzed. These results will complement the analysis conducted with the applications database.20
4. EMPIRICAL STRATEGY
Many school characteristics cannot be observed by the econometrician, yet these unobservables are likely correlated with both indicators of sports success and the number of applications received by a school. The unobservable component is likely to include information about scholastic and athletic tradition, geographic advantages, and other information on the true quality of the school. Without adequately controlling for these unobservables, they would likely confound the ability to detect the impact of athletic success on the quantity and quality of incoming students. The nature of the data we have compiled allows us to plausibly control for the unobservables associated with each school.
Even after including school fixed effects and linear trends for each school, it is always worrisome that schools that perform well in sports in a given year are schools that have recently improved academically as well. If this is the case, the effects of sports success on application rates and student quality may be spurious. To try and deal with this issue, we include one-year lead sports dummy variables in our regression to estimate the effect that having sports success next year has on this year’s applications. If the results suggest that future sports success does not predict current admission figures, this would lend credibility to our empirical strategy.
….
Timing of the Impact of Athletic Success
….
The NCAA Division I-A football season finishes at the beginning of January. The NCAA basketball tournament finishes at the end of March or beginning of April. Therefore, if these sports influence the number of applicants a school receives, we would expect an effect on the current year variables. This means that a successful football team that finishes in January or a successful basketball team that finishes in March will affect application decisions for students enrolling that fall. However, given the timing of when applications were likely prepared and submitted, and the football and basketball seasons, one would possibly expect an equally large impact of football and basketball to be on the first lag of an athletic success variable (especially for basketball, which ends three months after football). The second and third lags will give an indication of the persistence of the athletic success which occurred two to four years earlier.
5. RESULTS
Results Using Peterson’s Data
… For basketball, the results suggest that being one of the 64 teams in the NCAA tournament yields approximately a 1% increase in applications the following year, making it to the “Sweet 16” yields a 3% increase, the “Final Four” a 4–5% increase, and winning the tournament a 7–8% increase. The impact of the athletic lags is as we expected. Although there is an effect of winning on the current year’s applications, the largest effect comes in the first lag. By the third lag, the effect has usually diminished substantially…. For football, the results suggest that ending the season ranked in the top 20 in football yields approximately a 2.5% increase in applications the following year, ending in the top 10 yields a 3% increase, and winning the football championship a 7–8% increase. The largest effect is on the current football sports variable, along with a small effect on the first lag…. The results from these regressions suggest that for basketball private schools receive two to four times as many additional applications than public schools as they advance through the NCAA tournament, while the results for football are less conclusive. Furthermore, the application impact for private schools appears to be more persistent. For example, when a private school advances to the Sweet 16, it enjoys an 8–14% increase in applications for the next four years; whereas, a public school sees only a 4% increase for the next three years.
Besides being more selective, schools might react to increased applications by increasing their enrollment or tuition levels…. The results indicate that teams that have basketball success do not enroll more students the following year. However, schools that perform well on the football field in a given year do increase enrollment that year. Teams that finish in the top 20, top 10, and champion in football on average enroll 3.4%, 4.4%, and 10.1% more students, respectively. These results are all significant … this is largely driven by public schools. This increased enrollment could come from the fact that many public schools give guaranteed admission for certain students. For example, a school that guarantees admission for in-state students with a certain class rank or test score may be required to enroll many more students if demand suddenly spikes. Another possible reason for the increased enrollment is that more of the students that a university admitted decide to actually attend that year (higher matriculation rate), which would increase enrollment.
…. The results suggest that private schools increase tuition following trips to the Final Four (results are also suggestive for tuition increases by private schools after winning the basketball championship) but not for football success. There is no consistent evidence that public schools adjust tuition because of sports success. However, this is likely because many public schools have political constraints on increasing tuition.
…. [S]chools that do well in basketball are able to recruit an incoming class with 1–4% more students scoring above 500 on the math and verbal portions of the SAT. Similarly, these schools could also expect 1–4% more of their incoming students to score above 600 on the math and verbal portions of the SAT…. [H]owever, to examine the effect of sports success on SAT score categories in the Peterson’s data set, approximately 1600 observations of the 5335 are dropped due to missing SAT data. Therefore it is important to further examine the “quality” effect using the SAT data set.
Results Using SAT Database
…. The results indicate that sports success increases SAT-sending rates for all three SAT subgroups. However, the lower SAT scoring students (less than 900) respond to sports success about twice as much as the higher SAT scoring students. For example, schools that win the NCAA basketball tournament see an 18% increase a year later in sent SAT scores less than 900, a 12% increase in scores between 900 and 1100, and an 8% increase in scores over 1100. Also, private schools tend to see a larger increase in sent SAT scores after sports success than for public schools (although this does not appear to be true for the basketball championship and high SAT scores). For example, it can be seen that when a private school reaches the Sweet 16 in the NCAA basketball tournament, they have two to three times as many SAT scores sent to them as the public schools in the first and second periods after the basketball success. Furthermore, the effect tends to persist longer for the private schools than the public schools, as can be seen on lags 2 and 3…. A similar difference between public and private schools can be seen for football. The championship round cannot be compared, as there were no private schools that won the football championship during this time period.
Overall, these results suggest that schools that have athletic success are not receiving extra SAT scores solely from low performing students. The results also greatly strengthen the SAT results derived from the Peterson’s data. It appears that athletic success does indeed present an opportunity to schools to be either more selective in their admission standards or enroll more students while keeping a fixed level of student quality.
….
6. CONCLUSION AND FUTURE RESEARCH
“How does playing major college football or men’s basketball in a highly commercialized, profit-seeking, entertainment environment further the educational purpose of your member institutions?” Fully answering Representative Thomas’s question that he posed to the president of the NCAA is beyond the scope of this study. However, the analysis presented above does provide a set of estimates about the impact of sports success on the quantity and quality of student applications at schools participating in the premier divisions of NCAA basketball and football. These estimates reflect several indirect benefits from these high-profile college sports.
Using two unique and comprehensive data sets in conjunction with an econometric design that controls for the unobservable features of schools, we find that football and basketball success increases the quantity of applications to a school after that school achieves sports success, with estimates ranging from 2% to 8% for the top 20 football schools and the top 16 basketball schools each year.24 We also provide evidence that the extra applications are composed of students with both low and high SAT scores. Additional evidence suggests that schools use these extra applications to increase both student quality and enrollment size. There is some evidence that private schools adjust tuition levels in response to receiving extra applications from basketball success.
A related paper (Pope and Pope 2007) shows that sports success has a heterogeneous impact on various subgroups of the incoming student population. For example, we found that males, blacks, and students that played sports in high school are more likely to be influenced by sports success than their peers. This finding, combined with the results of this paper, provides a much broader picture of the impact of sports success on the composition of the incoming student body. These results significantly extend the existing literature and provide important insights about the impact of sports success on college choice. Using identification strategies that exploit the temporal variation in our data sets and that control for unobserved school heterogeneity, it is increasingly clear that sports success does have an impact on the incoming freshman classes. It is also clear that this impact is often short lived, and that it differs by student type. This may reflect differences in the ability of various student subgroups to acquire quality information that would affect school choice, or it may simply reflect preferences for high-quality athletics.
Whether or not the expenditures required to receive these short-run indirect benefits promote efficiency in higher education was not determined in the present analysis. Indeed, the raw summary data … would suggest that athletically successful schools actually saw slightly slower long-run growth in applications and enrollments. Future work directed at understanding the arms-race nature of athletics within higher education and its relation to economic efficiency would certainly be valuable. Nonetheless, the results presented in this paper should be important to college administrators. Athletics is one instrument that institutions of higher education have at their disposal that can be used to directly affect reputation and the prominence of their schools. It is hoped that these results provide information that can aid administrators in making decisions about athletic programs and help them to further understand the role of athletics within higher education.
….
References
Avery, C., and C. Hoxby. 2004. Do and should financial aid decisions affect students’ college choices? In College choices: The new economics of choosing, attending, and completing college, edited by Caroline Hoxby. Chicago: University of Chicago Press, pp. 239–299.
Bremmer, D., and R. Kesselring. 1993. The advertising effect of university athletic success—A reappraisal of the evidence. Quarterly Review of Economics and Finance 33:40–21.
Card, D., and A. Krueger. 2004. Would the elimination of affirmative action affect highly qualified minority applicants? Evidence from California and Texas. NBER Working Paper No. 10366.
Chapman, D. 1981. A model of student college choice. Journal of Higher Education 52:490–503.
Coughlin, C., and O. Erekson. 1984. An examination of contributions to support intercollegiate athletics. Southern Economic Journal 51:180–95.
Curs, B., and L. D. Singell. 2002. An analysis of the application and enrollment process for in-state and out-of-state students at a large public university. Economics of Education Review 21:111–24.
Fuller, W., C. Manski, and D. Wise. 1982. New evidence on the economic determinants of post secondary schooling choices. Journal of Human Resources 17:477–95.
Goidel, R., and J. Hamilton. 2006. Strengthening higher education through gridiron success? Public perceptions of the impact of national football championships on academic quality. Social Science Quarterly 87:851–62.
McCormick, R., and M. Tinsley. 1987. Athletics versus academics? Evidence from SAT scores. Journal of Political Economy 95:1103–16.
McEvoy, C. 2006. The impact of elite individual athletic performance on university applicants for admission in NCAA Division I-A football. The Sport Journal 9(1).
Mixon, F. 1995. Athletics versus academics? Rejoining the evidence from SAT scores. Education Economics 3:277–83.
Mixon, F., and Y. Hsing. 1994. The determinants of out-of-state enrollments in higher education: A Tobit analysis. Economics of Education Review 13:329–35.
Mixon, F., and R. Ressler. 1995. An empirical note on the impact of college athletics on tuition revenues. Applied Economics Letters 2:383–7.
Mixon, F., and L. Trevino. 2005. From kickoff to commencement: The positive role of intercollegiate athletics in higher education. Economics of Education Review 24:97–102.
Mixon, F., L. Trevino, and T. Minto. 2004. Touchdowns and test scores: Exploring the relationship between athletics and academics. Applied Economics Letters 11:421–4.
Murphy, R., and G. Trandel. 1994. The relation between a university’s football record and the size of its applicant pool. Economics of Education Review 13:265–70.
Pope, D., and J. Pope. 2007. Consideration set formation in the college choice process. Unpublished paper, The Wharton School and Virginia Tech.
Savoca, E. 1990. Another look at the demand for higher education: Measuring the price sensitivity of the decision to apply to college. Economics of Education Review 9:123–34.
Siegfried, J., and M. Getz. 2006. Where do the children of professors attend college? Economics of Education Review 25:201–10.
Tucker, I. 2004. A reexamination of the effect of big-time football and basketball success on graduation rates and alumni giving rates. Economics of Education Review 23:655–61.
Tucker, I. 2005. Big-time pigskin success. Journal of Sports Economics 6:222–9.
Tucker, I., and L. Amato. 1993. Does big-time success in football or basketball affect SAT scores? Economics of Education Review 12: 177–81.
Tucker, I., and L. Amato. 2006. A reinvestigation of the relationship between big-time basketball success and average SAT scores. Journal of Sports Economics 7:428–40.
Zimbalist, A. 1999. Unpaid professionals: Commercialism and conflict in big-time college sports. Princeton, NJ: Princeton University Press.
Notes
1. For example, a history of the NCAA provided on the NCAA’s official web site states, “The 1905 college football season produced 18 deaths and 149 serious injuries, leading those in higher education to question the game’s place on their campuses” (http://www.ncaa.org/wps/portal). The 1905 season led to the establishment of the Intercollegiate Athletic Association of the United States (IAAUS), which eventually became the NCAA in 1910.
2. Bill Thomas is a Republican congressman from California and previous chairman of the tax-writing House Ways and Means Committee. The full letter was printed in an article entitled “Congress’ Letter to the NCAA” on October 5, 2006, in USA Today.
3. A leading example of the anecdotal evidence has been dubbed “the Flutie effect,” named after the Boston College quarterback Doug Flutie, whose exciting football play and subsequent winning of the Heisman Trophy in 1984 allegedly increased applications at Boston College by 30% the following year. Furthermore, Zimbalist (1999) notes that Northwestern University’s applications jumped by 30% after they played in the 1995 Rose Bowl, and George Washington University’s applications rose by 23% after its basketball team advanced to the Sweet 16 in the 1993 NCAA basketball tournament.
4. The ACC, SEC, SWC, Big Ten, Big Eight, and PAC Ten conferences were typically considered the “major” conferences in college basketball and football at that time. Today the ACC, SEC, Big Ten, Big Twelve, Big East, PAC Ten, and independent Notre Dame are considered the major conferences/teams.
5. More detail about this literature is provided in the next section.
6. In Pope and Pope (2007), we use these data to also show that sports success has a differentiated impact on various demographic subgroups of students and to illustrate the limited awareness that high school students may have with regards to the utility of attending different colleges.
7. Reputation can be thought of as either academic reputation or as social/recreational reputation.
8. Other papers in this literature (as pointed out by a referee) include Mixon, Trevino, and Minto (2004), Tucker (2004, 2005), Mixon and Trevino (2005), Goidel and Hamilton (2006), McEvoy (2006), and Tucker and Amato (2006). These papers adopt similar identification strategies for estimating the quantity and quality effects as those described in Table 13.
9. Temporal variation typically enters the regression via a variable that reflects the aggregate sports success over the 10–15 years prior to the year of the school data.
10. See, for example, Steve Stecklow’s April 5, 1995, article in the Wall Street Journal entitled “Cheat Sheets: Colleges Inflate SATs and Graduation Rates in Popular Guidebooks.”
….
13. Forty-eight teams were invited in 1980, 1981, and 1982. In 1983, 52 teams were invited. In 1984, 53 teams were invited. Currently 65 teams are invited, but one of two teams is required to win an additional game before entering the round of 64.
….
15. We thank David Card, Alan Krueger, the Andrew Mellon Foundation, and the College Board for help in gaining access to this data set.
….
18. Less than 1% of students sent their scores to more than 14 schools.
….
20. Sending an SAT score to a school is not the same as applying to that school. However, it may be a good proxy. Card and Krueger (using the same SAT test-takers data set) tested the validity of using sent SAT scores as a proxy for applications. They compared the number of SAT scores that students of different ethnicities sent with admissions records from California and Texas and administrative data on the number of applications received by ethnicity. They conclude that “trends in the number of applicants to a particular campus are closely mirrored by trends in the number of students who send their SAT scores to that campus, and that use of the probability of sending SAT scores to a particular institution as a measure of the probability of applying to that institution would lead to relatively little attenuation bias” (2004, p. 18).
….
24. To put this quantity effect into perspective, the application elasticity of changes in the price of attending college found in the literature typically range from –.25 on the low end to –1.0 on the high end (see, e.g., Savoca 1990; Curs and Singell 2002). These elasticities suggest that tuition/financial aid would have to be adjusted somewhere in the range of 2–24% to obtain a similar increase in applications.
SCOREBOARDS VS. MORTARBOARDS: MAJOR DONOR BEHAVIOR AND INTERCOLLEGIATE ATHLETICS
Jeffrey L. Stinson and Dennis R. Howard
INTRODUCTION
A recent NCAA report indicated that charitable contributions to athletic departments at Division IA schools have more than doubled over the past decade … Despite the substantial growth, a number of fundamental questions regarding charitable contributions to athletic programs remain relatively unexplored:
1. Who gives to educational institutions in support of academic and/or athletic programs? Is it primarily non-alumni who contribute to intercollegiate athletics programs? Is it primarily alumni who contribute to academic programs?
2. Does the improved performance of intercollegiate athletic teams, specifically high profile sports including football and/or men’s and women’s basketball, affect both types of giving to the educational institution?
3. Does increased giving to athletics by alumni and non-alumni have a negative impact on charitable giving to educational programs at the same institution?
This study is based on an in-depth analysis of donor behavior at a major public university whose athletic teams compete at the Division IA level. The institution under study offers a unique window of opportunity for examining the extent to which improved team performance may impact both athletic and academic fund raising. Over the past decade, the university’s athletic teams, in particular football and men’s and women’s basketball, have achieved unparalleled success, moving from perennial middle of the pack status to regularly contending for conference and, occasionally, national championships.
A review of the literature suggests that formal hypothesis development regarding the basic questions addressed in this study is premature. Many of the assertions concerning donor behavior found in the literature lack credible empirical support, and others offer contradictory findings. The current study seeks to offer an empirical foundation for future hypothesis development and testing.
Research Question 1: Do Alumni Donors Give Primarily to Academics and Non-Alumni Donors Give Primarily to Athletics?
At Big-time U’s, a small percentage, usually in single digits, of alumni contribute to the school’s intercollegiate athletics program (a similarly low percentage donates to its educational programs). However, often the main contributors to athletic departments are boosters—rabid sports fans who, unlike alumni, never attended the institution and whose interest in it focuses almost exclusively on its college sports teams (Sperber 2000, p. 258).
In two books discussing the impact of “big-time intercollegiate athletics” on colleges and universities, Sperber (1990, 2000) commented extensively on donor behavior toward both academics and athletics. Sperber (1990) asserted that fewer than 2% of alumni contribute to their alma mater’s athletics program; the majority instead focused their giving on their school’s academic programs. Non-alumni, on the other hand, donated almost exclusively to the intercollegiate athletic program.
This distinction in giving behavior assumes alumni are less susceptible to fluctuations in giving with changes in athletic success, as “alumni giving is independent of college sports success or failure” (Sperber 2000, p. 256). Instead, alumni giving is driven by their academic relationship to the institution. Graduates are assumed to be proud of their degrees, and wish to repay the institution through their donations. Sperber argued that schools located at or near the top of U.S. News & World Report’s annual ranking of alumni giving at American colleges and Universities (as a percentage of alumni making a gift in the previous year) rankings tend to be known for their educational reputation as opposed to their athletic reputation. In contrast, schools with top college sports teams (Wisconsin, Michigan, and UCLA are cited), all have far lower rankings on the alumni-giving list.
The Identity Salience Model of Nonprofit Relationship Marketing Success offers one plausible explanation for this giving discrepancy (Arnett, German, & Hunt, 2003). Identity salience, a measure of the importance of an identity to self, is proposed to mediate the relationship between relationship-inducing factors and donating behavior. In the case of alumni donors, to the extent that such relationship-inducing factors as participation and organizational prestige are centered around the academic mission of the institution, as Sperber argues is the case with the U.S. News and World Report top schools, one would expect a more salient donor identity with academics and more charitable giving directed at academic programs.
A recent study offered empirical support for the notion that alumni giving is more heavily influenced by academic-related factors than athletic success. Rhoads and Gerking’s (2000) 10-year study of 87 NCAA Division IA institutions found that academic tradition and status had a far greater impact on alumni giving than the performance of athletic teams. Carnegie level I institutions, which represent the highest level of research institution in the Carnegie Foundation’s classification system, were found to receive 41% more support per student than other institutions. Additionally, a 100-point increase in incoming student average SAT scores correlated with 51% more alumni support per student.
Brown (1991) in a study of Ball State University alumni found that the academic reputation of the institution was a primary determinant of donor behavior. A substantial majority (61%) of the alumni donors equated the university’s reputation with the quality of its faculty and educational programs. Intercollegiate athletics were insignificant in determining the donor behavior of this group.
Although some evidence supports Sperber’s view that alumni donations are driven by academics rather than athletics, available literature (Rhoads & Gerking 2000, Brown 1991) does not substantiate his assertion that non-alumni (sometimes referred to as boosters) give exclusively to athletics. No empirical evidence was found to support this claim. In addition, research on institutional giving to date has not recognized that alumni and non-alumni can direct a portion of their institutional gifts to both academics and athletics. It is conceivable that the pattern of institutional giving may be more complex than the simple either/or differentiation suggested in previous studies. Therefore, this research will examine the donor behavior of both alumni and non-alumni, and the extent to which each of these donor groups split their annual donations across athletics and academics.
Research Question 2: Does Winning Have a Significant Impact on Alumni Giving?
Of the three research questions examined in this study, the relationship between winning and alumni giving has received the most attention. Despite this, there is still no clear answer to how athletic success impacts alumni academic giving. The many studies conducted on this topic often contradict each other and taken together produce equivocal results as to whether successful intercollegiate athletic teams influence alumni to donate more to their alma maters.
The aforementioned Rhoads and Gerking (2000) study also examined the impact of year-to-year changes in athletic success on total giving by alumni. Significant increases in alumni donations were associated with increased athletic success. Contributions were measured as dollars per student currently enrolled to control for institution size. A football bowl game win was found to raise alumni contributions per student by 7.3%, while alumni contributions fell 13.6% when a basketball team was placed on probation.
Grimes and Chressanthis (1994) also offered support for the positive impact of athletic success. The authors studied the giving patterns of Mississippi State University alumni from 1962-1991, and found that total contributions were positively related to the overall winning percentage of major (basketball, football, and baseball) intercollegiate athletic teams. The researchers found that each one percent increase in overall winning percentage of the three teams was correlated with a substantial, significant increase in total giving to the institution.
In contrast, several studies have concluded that no significant relationship exists between athletic success and giving to the institution. As part of a comprehensive study of higher education, Shulman and Bowen (2001) examined giving data from eight private, academically selective colleges and universities that compete athletically at the NCAA Division IA level. Athletic success was found to be an insignificant factor in alumni giving. However, it is quite possible that the findings were a function of the elite academic nature of the schools included in Shulman and Bowen’s study. All eight schools were among the most prestigious higher education institutions in the U.S., including several Ivy League schools, Stanford, and Northwestern. Each of these schools has higher levels of academic than athletics prestige. Some of the schools offer only academic scholarships. Consistent with the Arnett et al.’s (2003) Identity Salience Model, we expect donor behavior to follow the institutional focus on academics at these institutions and donors to direct their dollars to maintain the academic prestige of the university.
Two earlier studies also support the general lack of relationship between athletic success and charitable behavior among alumni. In a study of the annual campaigns of 135 schools, Sigelman and Carter (1979) found no relationship between athletic success and increased alumni giving. Gaski and Etzel (1984) examined 99 NCAA Division I institutions for donor behavior by alumni status (alumni vs. non-alumni) and fund type (annual fund vs. other), concluding that there was no evidence of the impact of athletic success on overall giving. While the influence of winning on alumni donor behavior is not clear, Gaski and Etzel (1984) remains the only study to date that has examined athletic team performance on the donor behavior of non-alumni.
The current study provides an empirical basis for examining whether winning has a differential influence on alumni and non-alumni and how such differences manifest themselves in the giving behavior of the two groups. Are non-alums, with few or no academic ties to the university, more sensitive to the fortunes of the institution’s athletic teams? Does winning encourage greater overall financial support to just the institution’s athletic program or does athletic success also spur more giving to academic programs? The intent of this study is to examine these questions and provide a deeper understanding of the relationship between intercollegiate athletic success and donor behavior.
Research Question 3: Does Athletics Giving Undermine Giving to Academics?
Sperber (2000) asserted that athletic departments “actively undermine efforts to raise money from alumni for educational programs” (p. 259). Labeling this the “college-sports-equals-alumni-giving myth,” he noted an increasing focus by athletic departments on wealthy alumni to support larger programs and facilities. He contended that after securing a major gift for a new athletic facility from a particular alumnus it would be unlikely for that same individual to donate a major gift to an academic unit of the institution.
Additionally, Sperber (2000) suggested that the highly publicized athletic programs of most Division IA institutions could result in alumni cutting their gifts in times of negative publicity. He offered the case of Southern Methodist University where alumni giving to academics dropped following the football team receiving the death penalty—the severest of NCAA sanctions that completely shuts down a program for a period of time—in the 1980s. Furthermore, during the pre-scandal winning years, alumni giving to academics did not increase.
The opposite side of the spectrum is offered by Shulman and Bowen (2001), who write, “There is certainly no indication in the data we have collected that private giving to athletics today is so substantial (in either the number of donors or the size of the average gift) that it is likely to detract in any substantial way from fundraising for broader educational purposes” (Shulman & Bowen, 2001, p. 215).
As the quote indicates, Shulman and Bowen (2001) found no significant impact of giving to athletic programs on giving to academic programs at the eight Division IA schools included in their sample. The authors classified alumni gifts as either athletic or academic. There was no significant reduction in giving to academics associated with giving to athletics; thus, the authors concluded that no relationship between the two types of giving exists.
However, their findings might be a function of the very narrow range of schools in the sample. All eight schools included in their analysis are heavily endowed, academically elite, private institutions, leading the authors to note “the practices and leading issues in the Division IA schools are qualitatively different from those of the other institutions [in this study]” (p. xxiv). If the assumption that alumni donors give predominantly to academic programs is true, the schools in this sample may be less susceptible to any decline in academic giving as athletic contributions rise. It remains untested whether such a situation would hold at a public institution with much lower levels of alumni support. Yet these factors seem to contribute to the authors conclusion that “[i]t would be comforting to assume that the apparent lack of competition for gifts between athletics and other institutional purposes would continue into the future. Unfortunately, we do not think such confidence is warranted” (Shulman & Bowen, 2001, pg. 38).
Finally, one earlier study by McCormick and Tinsley (1990) found that giving to athletics had a positive impact on academic giving, estimating that a 10% increase in giving to athletics was associated with a 5% increase in academic giving. The authors examined alumni giving data at Clemson University, in South Carolina, for the time period 1979–1983.
As with the impact of athletic success on donor behavior, the limited empirical evidence considering the impact of donations to athletics on academic giving is less than clear. The current study seeks to directly examine the relationship between the two types of giving for both alumni and non-alumni.
AN EXAMINATION OF UNIVERSITY OF OREGON DONORS
The sample for this study includes all donors making gifts of $1000 or more between 1994 and 2002 to the Annual Giving Program at the University of Oregon. The university conducted a capital campaign ending in 1998. However, large, non-recurrent capital gifts (both athletic and academic) donated as part of the campaign were not classified as annual gifts and, therefore, not included as part of the database used in this study.
A minimum $1000 gift to the Annual Giving Program entitles the donor to membership in the President’s Club and represents the first category of major donation at the University of Oregon. The number of major donors has grown from 779 in 1994 to 2,309 in 2002. In addition, major donors were found not only to give more but to also give more consistently than those making smaller annual contributions. Major donors had a significantly greater propensity to make recurrent annual gifts than minor donors, making this subset of donors a more relevant sample for examining the research questions under consideration in this study. Furthermore, while major donors constitute only 4.3% of the total number making gifts to the University, these donors contribute 72% of the total charitable revenues.
The entire giving history of each donor making an annual gift of $1000 or more during the selected time frame was extracted from the University’s Benefactor database, compiled and managed by the University of Oregon Foundation, which is the academic fundraising body at the university. Each gift was subsequently coded as made by an alumnus or non-alumnus, and donations were divided into three giving areas.
• Athletic gifts represent gifts directed towards the athletic department, including all gifts made to the athletic fundraising entity, the Duck Athletic Fund.
• Academic gifts represent all gifts directed towards an academic program or unit, as well as all undirected gifts that may be used at the discretion of the university president.
• Other gifts are those donations directed at a non-academic, non-athletic unit of the University. Examples include the university theatre, the art museum and the Oregon Bach Festival.
Fiscal year 1994 was selected as the starting point for analysis as it represented the first year for which reliable giving data on all donors to the University of Oregon Foundation was available.
The University of Oregon is a mid-size public research institution that sponsors 15 National Collegiate Athletic Association (NCAA) Division I varsity athletic programs. Oregon offers a unique and interesting opportunity to examine the relationship between athletic success, athletic fundraising, and academic fundraising. The combination of unprecedented athletic success and major athletic fundraising efforts during the sampling period provides a rare window in which to examine the research questions of interest. No major changes in the university’s academic program (i.e., change in Carnegie classification) occurred during the time period considered in this study, creating an unintended natural experimental condition in which to examine the potential influence of athletic-related success on academic fundraising.
The 1994 season began an unprecedented run of success for the Oregon football program. The team played in the Rose Bowl for the first time in 40 years in 1995. Over the next seven seasons, the Oregon football team compiled a 69 and 27 record, winning two conference championships and playing in five bowl games. In 2001, the Oregon football team compiled an 11 and 1 record and ended the season ranked #2 in the nation. In 2002, the athletic department completed a $90-million expansion of Autzen Stadium. In the ten years prior to 1994, the Oregon football team had only four winning seasons, compiling a record of 58 wins and 57 losses. In 1995, the men’s basketball team advanced to the NCAA Championship tournament for the first time in 34 years. From 1995–96 through 2001–02, the Oregon basketball team played in four post-season tournaments, advancing to the National Invitational Tournament Final Four in 1999 and to the NCAA Elite Eight in 2002. A campaign to fund construction of a new basketball arena was announced in early 2003.
The fortunate circumstance of having detailed donor records available at the onset of the athletic teams’ run of success provided a unique opportunity for directly examining the relationship between team performance and donor behavior related to both academic and athletic giving. As noted by Grimes and Chressanthis (1994) and Brooker and Klastorin (1981), while the focus on a single institution may result in the loss of reliability in generalizing the results, universities that share many common characteristics are more likely to experience similar patterns in the receipt of charitable donations. Stake (1983) argued that when there is a need to generalize only to similar cases as opposed to a population of cases, a single-institution study is an acceptable form of inquiry. The University of Oregon shares many characteristics with other public research institutions supporting NCAA Division I athletic programs, and while future research should include additional institutions, only the data from one school were considered in this study. Therefore, while the specific results of this study may not be generalizable to other institutions, similar findings at similar institutions would not be surprising.
Research Question 1
… [T]he data indicate that both alumni and non-alumni give to both academics and athletics, though, clearly, there are significant differences in the giving behavior of the two groups. In all but two years (1994, 1996), alumni made significantly higher gifts to academics than non-alumni, and in every year since 1994, alumni allocated a significantly larger portion of their total gift to academics than non-alumni. On the other hand, non-alumni allocated a significantly higher percentage of their total gift to athletics every sample year. However, in terms of actual average gift amount, non-alums only made a significantly higher gift to athletics in the final year of the sample (2002). Thus, the assumption that alumni give primarily to academic programs while non-alumni give primarily to intercollegiate athletic programs partially holds. Alumni do give predominantly more to academics, but they also donate large amounts, both in terms of average gift amount and percent of total gift, to intercollegiate athletics.
Further analysis shows that in the most recent year, 38.7% of alumni allocated their entire gift to the athletics program and 69.5% of alumni allocated at least a portion of their gift to athletics, suggesting higher alumni participation in athletic fundraising at Oregon than the 2% asserted by Sperber (2000). Over 36% of non-alumni in 2002 allocated at least a portion of their gift to a non-athletic program. Together, these results clearly demonstrate that both alumni and non-alumni give to both academics and athletic programs, and that a simple alumni/non-alumni dichotomy is not an adequate explanation of donor behavior.
The data were then analyzed by allocation groups …: a group allocating their entire gift to academics, a group allocating their entire gift to athletics, and a group making a split gift (both athletic and academic). No statistical differences were found between alumni and non-alumni allocating their entire gift to athletics or academics. It appears that only in the case of split gifts is the alumni/non-alumni distinction significant in donor behavior.
Research Question 2
In this era of increasing athletic success at the University of Oregon, more alumni give more to athletics, suggesting that alumni giving may indeed be influenced by athletic success. In 1994, 58.5% of alumni donors in the sample allocated at least a portion of their gift to the intercollegiate athletics program. This percentage has risen steadily to the 69.5% of alumni donors in the sample making a gift to athletics in 2002. In terms of real donors, 297 alumni donors donated to athletics in 1994; 962 alumni made a gift to athletics in 2002. This was in a time period where growth in total alumni donors making annual gifts of $1000 or more increased by 877 donors, suggesting that virtually every new alumni donor at this level allocated at least a portion of their gift to athletics, in addition to some previous donors who began allocating some of their gift to athletics. Finally, the average donation to athletics by this group grew from $1010.11 in 1994 to $1773.55 in 2002. In almost every way, alumni giving to athletics has increased with an associated increase in success by the high profile intercollegiate athletic teams at the University of Oregon.
While more subtle, athletic success may also be influencing academic giving by alumni…. The percentage of alumni donors making an academic gift has fallen from 73.2% to 61.3% since 1994. The number of alumni donors making gifts of $1,000 or more to academics has increased during the time period from 372 to 863, an increase of 491. However, this lags far behind the increase of 666 alumni donors making a major gift to the athletic department during the same time period. Still, in terms of average academic gift amount, alumni have been relatively stable, with average gifts ranging from $1427.27 to $1710.00. These data suggest a possible neutral to negative influence of athletic success on academic giving by alumni. Either way, it is clear athletic success has not had a strong positive impact on alumni giving to academic programs.
Research Question 3
Thus, we turn to an examination of the relationship between giving to athletic programs and giving to academic programs. The data … provide strong support for the assumption that giving to athletics undermines giving to academics, particularly for non-alumni. Over the time period considered, the average academic gift by non-alumni has fallen significantly, while the average gift to athletics has significantly increased. Since 1994, the average academic gift by a non-alum has fallen $671.35, while the average non-alum gift to athletics has increased $962.88. While the effects of winning athletic seasons on alumni donations are not quite as dramatic, the trends suggest that amounts donated to athletics are negatively associated with alumni decisions related to academic giving. There has been no significant change in alumni giving to academics in terms of total dollars donated. However, alumni have significantly increased their giving to athletics, and now donate a significantly larger percentage of their gift to the athletic department. In 1994, 40.4% of the average alum gift was targeted to intercollegiate athletics. By 2002, alums donated 56.7% of their gift to athletics.
It is clear that proportional giving by alums increasingly favors athletics …. Fiscal year 2002 saw an increase in total dollars donated by alumni of over $840,000. Over 81% of this incremental revenue was directed toward the intercollegiate athletic department. This resembles the allocation of incremental revenue by non-alumni, who allocated 83.9% of their additional giving to athletics. For every $100 of new revenue raised from major donors by the University of Oregon, over 80% is being directed to the athletic department.
Even with the large increases in numbers of total donors since 1994, academic giving struggles to remain stable while donations to athletics experience huge growth. In three out of the past five years (1998, 2000, 2001), the total dollars donated to academics by non-alumni has fallen despite annual increases in the number of non-alumni donors. Total dollars donated to academics by alumni fell in only one year (2000), again despite an increase in the total number of donors. This suggests new donors are not making academic gifts, and current donors are shifting dollars from academic giving to donations directed to the athletic program. Additionally, as discussed above, proportional giving by alumni is predominantly directed to the athletic program. If these trends continue, total academic giving will fall for both alumni and non-alumni despite continued increases in the total numbers of both types of donors.
Further analysis examined the number of donors allocating their entire gift to either intercollegiate athletics or academics …. Since 1994, the percentage of alumni donors allocating their entire gift to athletics has increased from 26.8% to 38.7%. During that same time period, the percentage of alumni allocating their entire gift to academics has fallen from 41.5% to 30.5%. Together, these findings are most likely the result of one or both of the following effects: some alumni are reducing or eliminating gifts to academics while increasing gifts to athletics, and/or some previous academic donors have stopped contributing and new alumni donors are making more gifts to athletics than academics. The pattern is similar for non-alumni, where the percentage allocating their entire gift to athletics has risen from 42.1% to 63.5%, and the corresponding percentage of non-alumni donors allocating their entire gift to academics has fallen from 26.6% to 12.8%. Increased giving to athletics is negatively associated with the academic giving of both alumni and non-alumni at the University of Oregon.
Again, the data were further analyzed by reducing donors to a group donating their entire gift to athletics, a group donating their entire gift to academics and a group splitting their gift. As discussed above, for both alumni and non-alumni the percentage of donors allocating their entire gift to athletics has increased while the percentage allocating their entire gift to academics has decreased. The percentage of alumni split-gift donors has remained relatively stable. However, the percentage of non-alumni split-gift donors has fallen to less than 25%, suggesting that non-alumni donors making a first gift to athletics are not subsequently making gifts to academics.
Furthermore, alumni split-gift donors are favoring athletics in the allocation of their split gift …. The percentage of gift allocated by alumni split-gift donors to athletics has risen from 38.1% to 52.9% of the total gift, while the percentage allocated to academics has fallen from 55.4% to 31.7%. In terms of actual dollars, alumni split-gift donors made an average gift to athletics of $1183.33 in 1994. That amount rose to an average gift of $2237.66 in 2002. Academic gifts, on the other hand, fell from $1721.89 in 1994 to $1340.98 in 2002. Again, the data show an increase in giving to athletics associated with reduced academic giving—even by alumni.
The overwhelming conclusion that can be drawn from this data is, at least at the University of Oregon, the increasing success of athletics-related fundraising has been and is associated with reduced giving to the academic mission of the institution. Perhaps most troubling is the possible negative influence on alumni giving. While lagging behind the significant changes in non-alumni donor behavior, all of the trends suggest that alumni giving behavior is moving in a similar direction—toward athletics.
With respect to the three research questions, the following conclusions are offered:
• Both alumni and non-alumni make gifts to both athletic and academic programs. Nearly 70% of alumni donors examined made a gift to the intercollegiate athletic department, casting doubt on the assertion that only a small percentage of alumni make athletics related gifts.
• At least contextually, there is evidence that a winning program may significantly influence the giving behavior of alumni. Alumni appear to give significantly more to the athletics program as program success increases. Alumni academic giving may not be influenced as strongly, though there are some indications that athletic success may encourage a reallocation of donors’ institutional contributions with a discernable shift toward athletics.
• Both alumni and non-alumni show an increasing preference toward directing their gifts to the intercollegiate athletics department - at the expense of the donations to academic programs. Sperber’s (2000) assertion that giving to athletics undermines academic giving is strongly supported.
IMPLICATIONS
The current study yields several important implications for future research. Issues surrounding donor motivations and institutional cultivation strategies will be critical to both a conceptual and practical understanding of institutional fundraising.
Most studies investigating the motives of donors to athletic programs have found at least some component of tangible benefit to the donor as a main determinant of the donor’s behavior. Most recently, Mahony, Gladden, and Funk (2003) and Gladden, Mahony, and Apostolopoulou (2003) identify priority seating for football and basketball as the most important motive for an athletic department contribution, overwhelming any social motives. Earlier research on the Athletics Contributions Questionnaire Revised Edition II (Staurowsky, Parkhouse, & Sachs, 1996) and the Motivation of Athletics Donors (Verner, Hecht, & Fansler, 1998) both revealed a social motive for giving, defined by Staurowsky, Parkhouse, and Sachs as “the social interaction that occurs for people who follow teams and attend games” (pg. 270). However, both studies included one or more factors that could be considered tangible in nature. The availability of tangible benefit to the potential donor may in fact be pulling donors to make gifts to athletics instead of academics, where tangible benefit often requires more significant giving. A focus on tangible benefits offers one possible explanation for our findings. In exchange for a $1000 gift to the University of Oregon athletic department, a donor receives access to preferential seating at athletic events, preferred parking, and invitations to athletics-related social events. On the other hand, a $1000 gift to an academic unit, while entitling the donor to recognition as a member of the President’s Club is accompanied by little if any tangible benefit. Therefore, the exchange, from the donor’s perspective, may be seen as more valuable for a gift to athletics than to academics. Interestingly, athletic donors in the Gladden et al. (2003) study listed both a desire to help student-athletes in the form of scholarships and educational opportunity, and supporting the university as a whole in the top five reasons for making a donation. Future research should examine both whether donors are aware of any separation in athletic versus academic giving, and if donor behavior would change if such distinctions were more salient. It is quite plausible that donors view a donation to the athletic department as the best of both worlds: the donor is helping students and the university while at the same time receiving significant personal benefit. Such a view would help explain the shifts to athletic donations observed at the University of Oregon.
Furthermore, it is possible that our results begin to offer clarification to the model of individual donor behavior proposed by Brady et al. (2002). The authors propose a joint effects model of donor behavior to higher education institutions, whereby donors use both a services model focused on service value and satisfaction, and a philanthropic effects model centered on organizational identification, perceived need, and philanthropic predisposition in forming intent to give. However, no clarification of when their services model or philanthropic effects model would predominate over the other in explaining donor behavior was offered. It seems plausible, if not likely, that donations made in exchange for tangible donor benefit would be more subject to the services model than to the philanthropic effects model. Such reasoning would be consistent with our results of increased athletic giving associated with increased athletic winning, and with earlier studies indicating a positive relationship between winning and giving (Rhoads & Gerking, 2000; Grimes & Chressanthis, 1994). Academic giving, on the other hand, appears to be more dominated by the philanthropic effects model, suggesting these donations may be less susceptible to the fluctuations in athletic success. Again, this argument would be consistent with the alumni academic giving at the University of Oregon.
In an environment of heavy competition for donors and their gifts (Greenfield, 2002), the ability of athletic departments to offer a valuable tangible benefit in exchange for a gift may attract donors who would otherwise make an academic gift. This suggests that the organizational structure of the institution’s development department may be an important factor. Where athletic and academic development officers have differing reporting structures, competition may more easily ensue, allowing athletics to capitalize on the more valuable tangible benefits typically available to athletics donors than to academic donors. Where both athletics and academic fundraisers report through the same lines, more cooperation would be expected, perhaps minimizing the negative impact to academic giving, either by offering similar tangible benefit for academic gifts, or by controlling the extent to which tangible benefits are offered for athletics gifts.
Consistent with the above argument is a need to better understand the role of athletics fundraising in recruiting donors to the institution. Two commonly prevailing views of the benefit of athletic fundraising are that it brings new donors to the institution, and that it captures funds that would not have been donated to the institution through other mechanisms (i.e., academic giving). The evidence at the University of Oregon suggests that while athletics-based fundraising has been successful at recruiting new institutional donors, such recruitment is coming at a price to academic giving. Our data suggest the institution is not successfully transitioning new donors from athletics only into split donors (academics and athletics). Future research needs to more clearly examine if, when and how this transition takes place, both from a donor decision-making view, and from an institutional cultivation view. The literature on social identification and identity salience may be relevant, with a key question being: Is it possible to move from a state of identification with a specific team or department, to a broader relationship with the institution as a whole? To the extent that organizational identification and identity salience drive donor behavior (Arnett et al, 2003; Mael & Ashforth, 1992), the nature and direction of identification may be crucial determinants in cultivating athletic donors to also support the academic mission of the institution.
CONCLUSION
While the data considered in this study came from only one institution, and therefore lack generalizability, we would expect to identify similar trends at other, similar institutions across the U.S. The results of this single-institution study indicate the need for future research that includes a broader cross-section of NCAA IA institutions to clarify the impact of intercollegiate athletics and athletics-related giving on academic giving to the sponsoring institution.
Future work needs to focus on the differing decision processes and motives for giving by alumni and non-alumni, as well as differences between athletic, academic, and split-gift donors. The data considered in this study are entirely historical, and while valuable in identifying trends in giving behavior, they provide little insight into donor decision processes and motivations. Additionally, this work should be expanded and included in research on the impact of successful intercollegiate athletic teams on donor behavior. The role of athletic success in influencing giving behavior needs to be further clarified, considering the susceptibility of different groups to changing gift patterns based on athletic team success. Finally, this research only included donors making annual gifts of $1,000 more. Future research should investigate whether lower level donors exhibit similar or different giving behaviors.
References
Arnett, D. B., German, S. D., & Hunt, S. D. (2003). The identity salience model of relationship marketing success: The case of nonprofit marketing. Journal of Marketing, 67, 89–105.
Brady, M. K., Noble, C. H., Utter, D. J., & Smith, G. E. (2002). How to give and receive: An exploratory study of charitable hybrids. Psychology & Marketing, 19, 919–944.
Brooker, G., & Klastorin, T. D. (1981). To the victors belong the spoils? College athletics and alumni giving. Social Science Quarteriy, 62, 744–50.
Brown, I. D. (1991). Targeting university alumni segments that donate for non-athletic reasons. Journal of Professional Service Marketing, 7, 89–97.
Fulks, D. L. (2000). Revenues and expenses of Division I and II intercollegiate athletics programs: Financial trends and relationships—1999, Overland Park, KS: The National Collegiate Athletic Association.
Gaski, I. E., Etzel, M. J. (1984). Collegiate athletic success and alumni generosity: Dispelling the myth. Social Behavior and Personality, 12, 29–38.
Gladden, J. M., Mahony, D. F., & Apostolopoulou, A. (2003). Toward a better understanding of college athletic donors: What are the primary motives? Unpublished manuscript.
Greenfield, I. M. (2002). The nonprofit handbook: Fundraising, 3rd Edition, New York: Wiley.
Grimes, P. W., & Chressanthis, G.A. (1994). Alumni contributions to academics: The role of intercollegiate sports and NCAA sanctions. American Journal of Economics and Sociology, 53, 27–41.
Mael, F., & Ashforth, B. E. (1992). Alumni and their alma mater: A partial test of the reformulated model of organizational identification. Journal of Organizational Behavior, 13, 103–123.
Mahony, D. F., Gladden, J. M., & Funk, D. C. (2003). Examining athletic donors at NCAA Division I institutions. International Sports Journal, 7(1), 9–27.
McCormick, R. E., & Tinsley, M. (1990). Athletics and academics: A model of university contributions. In B.L. Goff & R.D. Tollison (Eds.), Sportometics (pp. 193–206). College Station, TX: Texas A&M University Press.
Rhoads, T. A., & Gerking, S. (2000). Educational contributions, academic quality and athletic success. Contemporary Economic Policy, 18, 248–59.
Shulman, J. L., & Bowen, W. G. (2001). The game of life. Princeton, NJ: Princeton University Press.
Shulman, J. L., & Bowen, W. G. (2001). The misfortunes of collegiate athletics. Case Currents, (27), 34–41.
Sigelman, L., & Carter, R. (1979). Win one for the giver? Alumni giving and big-time college sports. Social Science Quarterly, 60, 284–94.
Sperber, M. (1990). College sports inc. New York: Henry Holt.
Sperber, M. (2000). Beer and circus: The impact of big-time college sports on undergraduate education. New York: Henry Holt.
Stake, R.E. (1983). The case study method in social inquiry. In G.F. Madaus, M. Scriven, & D.L. Stuffelbeam (Eds.), Evaluation Models (pp. 279–286). Boston: Kluwer-Nijhoff Publishing.
Staurowsky, E. J., Parkhouse, B., & Sachs, M. (1996). Developing an instrument to measure athletic donor behavior and motivation. Journal of Sport Management, 10, 262–277.
Verner, M. E., Hecht, J. B., & Fransler, A. G. (1998). Validating an instrument to assess the motivation of athletic donors. Journal of Sport Management, 12, 123–137.
EMPHASIS ON INTERCOLLEGIATE ATHLETICS
THE IMPACT OF RECLASSIFICATION FROM DIVISION II TO I-AA AND FROM DIVISION I-AA TO I-A ON NCAA MEMBER INSTITUTIONS FROM 1993 TO 2003
INTRODUCTION
Purpose of Study
Recent years have seen a number of National Collegiate Athletic Association (NCAA) Division II institutions seeking reclassification to Division I-AA and Division I-AA institutions moving to Division I-A. Yet, other schools that seem like natural candidates to reclassify have resisted.1 The purpose of this study is to investigate the impact of the reclassification process on both the financial and non-financial well-being of the reclassifying institutions from 1993 to 2003. We discuss the differences between divisions, the reclassification process, and the perceived incentives for reclassification, and also address previous research validating and contradicting the perceived incentives for Division I membership in terms of financial wealth, enhanced stature, increased enrollment, higher academic standards for applicants, etc. Our analysis suggests that while revenues tend to increase after reclassification, they are subsumed by cost increases such that net profits decline for reclassifying institutions. Though we provide evidence of some increase in enrollment diversity, it is far from overwhelming. We conclude that the primary benefit of reclassifying is an unquantifiable perceived increase in prestige.
NCAA Division Differences
“A basic purpose of this Association is to maintain intercollegiate athletics as an integral part of the educational program and the athlete as an integral part of the student body and, by so doing, retain a clear line of demarcation between intercollegiate athletics and professional sports.” (Bylaw 1.3.1)
The purpose of the NCAA is consistent across the 1,000 member institutions, but the application of this purpose varies philosophically, operationally and legislatively by the three membership divisions—Division I, II and III. An over-generalization would describe Division I as the wealthiest division providing athletics scholarships and as the most heavily legislated. Division II also provides athletics scholarships with fewer financial resources and less legislation. Division III is the least legislated and does not offer athletics scholarships.2 The three divisions of the NCAA federated in 1996 to increase individual division autonomy. The separation included reconstruction of the governance structure and the legislative process. Each division has become more independent and unique as the following descriptions will demonstrate. (See Figure 1 for NCAA Membership Requirements.)
Division II Membership
The Division II philosophy states that intercollegiate athletics should be based on educational principles and practices consistent with the mission of the university to serve the welfare of the student-athlete. The philosophy statement lists 10 principles with overriding commitments to the following:
• academic success and personal development of the student-athlete
• equitable athletics opportunities for all students
• competition against other Division II institutions
• proper balance between athletics and campus life
• the awarding of athletics financial aid
• institutional control of intercollegiate athletics
• embracing the Division II philosophy (Bylaw 20.10)
The Division II philosophy is paired with two operational membership requirements concerning 1) sport sponsorship and 2) financial aid allocation. Division II institutions must offer a total of 10 teams, which must consist of (a) four varsity sports consisting of two team sports of all-male or mixed teams of males and females; and (b) six varsity sports consisting of two team sports of all-female or mixed teams of males and females. Division II institutions can also choose to balance their sport sponsorship by offering five primarily male teams and five primarily female teams (Bylaw 20.10.3). To meet sport sponsorship requirements, the sport must provide the appropriate number of participant opportunities and meet the scheduled contests limits. In terms of athletically related financial aid, Division II institutions must award 50 percent of the maximum allowable equivalencies (or scholarships) in four separate sports, two of which must be for women’s sports. The total expenditures for the athletically related financial aid must be worth a minimum of $250,000, including $125,000 in women’s sports (Bylaw 20.10.1.2). Relative to Division I, Division II is less regulated, likely a result of fewer concerns with competitive equity and more institutional control to govern athletically related activities.
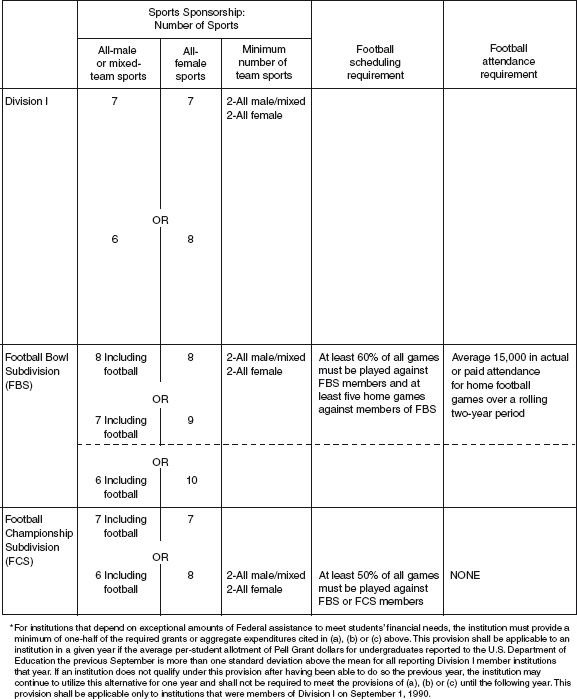
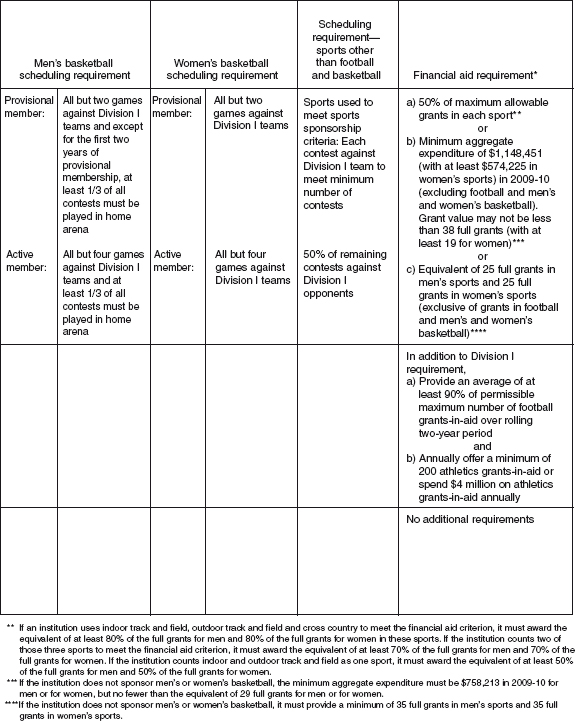
Source: 2009–2010 NCAA Division I Manual, Figure 20-1, p. 317. © National Collegiate Athletic Association. 2008–2010. All rights reserved.
Division I Membership
The Division I philosophy calls for a balance of competitive equity and student-athlete well-being. The philosophy statement lists eight principles committed to the following:
• academic quality
• athletics excellence
• service to the public
• extensive athletics opportunities
• spectator/revenue producing sport objectives
• competition against other Division I opponents
• self-sufficient operations
• respect for all divisions while sustaining Division I principles for current membership and for institutions aspiring to be Division I members
The delicate balance between revenue production through the entertainment market and protection of the educational intent of intercollegiate athletics has led to increased legislation in personnel, amateurism, recruiting, eligibility, financial aid, awards and benefits, playing and practice seasons, and postseason competition. (See Division I Manual for further explanation).
Division I is further classified in terms of football sponsorship by Division I-A, Division I-AA and Division IAAA. Division I-A offers the highest level of sponsorship in terms of number of participants and financial resources. Division I-AA offers fewer football scholarships than Division I-A and does not have the stadium attendance restriction. Division I-AAA institutions do not offer football, but can offer all other Division I athletics opportunities. The Division I membership requirements include sport sponsorship of 14 teams, competition scheduling against Division I institutions and financial aid requirements. Division I-A has additional football sponsorship requirements.
Division I-AA
Division I-AA institutions can choose to balance their 14-sport sponsorship by offering at least seven primarily male teams and seven primarily female teams (Bylaw 20.9.7). Division I-AA institutions must award 50 percent of the maximum allowable equivalencies (or scholarships) in 14 separate sports. The aggregated expenditures for the athletically related financial aid is a minimum of $877,000, ($438,000 for women’s sports), excluding men’s football and basketball, or in terms of full grants, 25 grants for men’s sports, other than football and men’s basketball, and 25 grants for women’s sports (Bylaw 20.10.1.2).
Division I-A
A Division I-A institution must offer a total of 16 teams, which must consist of at least six varsity sports, containing two team sports of all-male or mixed teams of males and females and eight varsity sports, containing two team sports of all-female or mixed teams of males and females (20.9.6).
To meet sport sponsorship requirements, the sport must provide the appropriate number of participant opportunities and meet the scheduled contests limits. Athletics financial aid for sports other than football is the same as Division I-AA. Division I-A football, however, must allocate 90 percent of the 200 athletics grants over a two-year period, and these grants must total $4 million. Division I-A football requirements also include an average actual attendance of 15,000 for all home football games, and the institution must perform an annual certification audit to validate the attendance record.
Reclassification Process
The reclassification process is a five-year educational program with the purpose of assisting institutions with the transition to the philosophy of the new division and its rules compliance and operations. Institutions applying for Division I membership are reviewed by the Division I Management Council to ensure the “readiness” of becoming a Division I institution. The reclassification process is based on three principles: 1) to involve the institution’s president, athletics director, faculty athletics representative, senior woman administrator and compliance personnel; 2) to establish a timeline for the transition; and 3) to provide guidance in terms of the Division I philosophy, Division I membership regulations, development of institutional compliance policies and promotion of campus-wide involvement.
Reclassification Requirements
The reclassification process contains seven educational activities that must be completed to meet active membership status in addition to meeting Division I legislative compliance. First, the institutional officials must attend annual orientation sessions for education on the Division I philosophy, membership requirements and issues concerning Division I athletics. Second, the institution must submit an annual strategic plan of implementing the Division I philosophy and operating principles. Third, annual attendance to the NCAA Convention by all of the institution’s officials is required. Fourth, the institution must receive instruction in and demonstrate knowledge of NCAA Division I rules. Fifth, the institution must devise a compliance education system and self-assessment plan to ensure Division I compliance in the future. Sixth, at the end of the reclassification process, the institution must complete an NCAA certification visit, during which the Division I certification team will visit the campus to evaluate the capacity of the reclassifying institution to operate at the Division I level. Seventh, the institution must verify it has met Division I membership requirements and formulated the key elements to operate athletics programs at the Division I level….
Perceived Divisional Benefits
The literature suggests several reasons institutions may consider reclassifying. Given the cost of the reclassification process and the continuing increased level of expenses, the initial benefit to consider is increased revenue. Increases in revenues may come from increased ticket sales, conference distributions, postseason earnings and alumni/booster contributions. (It should be noted that research concerning the correlation of athletics success and alumni/booster contributions is inconclusive.) Although increased spending that accompanies reclassification is inevitable, it is hoped that the increases in revenues outpace the increases in expenditures.
Another potential benefit is increased exposure after reclassification, which may result in an increase in applications, an increased academic pool, greater diversity and immeasurable intrinsic benefits.
Finally, reclassification may yield an increase in reputation and prestige, as the perceived quality of an institution’s academic program is often tied to the success of its athletics program. Related benefits, of course, are immeasurable and intrinsic. It should also be noted here that a recent study by Orszag and Orszag (2005) found that there is a significant increase in revenue after reclassification, but this is subsumed by an increase in spending. The Orszag study does not address nonfinancial ramifications of reclassifying, which is a primary contribution of this study.3
DATA COLLECTION
Eleven institutions were identified that reclassified from Division I-AA to Division I-A during the period from 1993 to 2003. Eighteen institutions were identified as having moved from Division II to I-AA. Of the latter, insufficient data were found for 10 of the schools, leaving eight for observation (see Appendix II).
The financial data collected for each institution included total revenues (after removal of direct institutional support) and total expenses. The resulting net operating profit or loss was then calculated. Direct institutional support represents transfers of funds from the institution’s general fund, or other units, to athletics. It should also be noted that the operating expenses do not include debt service or capital expenditures.
The nonfinancial data collected included ethnicity and gender of the institution’s student body, ethnicity and gender of the student-athletes, graduation rate of the student body, graduation rate of the student-athletes, and the number of varsity sports sponsored by the institution.
The data were collected from NCAA archives of the biennial Revenues and Expenses of Intercollegiate Athletics Programs report, the annual Graduation Rate Report, and the annual Equity in Athletics Disclosure Act (EADA) data.
RESULTS
Financial Observations
Based on the data collected and utilized for the 19 reclassifying schools, the following distinct trends were noted.
Division I-AA to Division I-A
In every instance, total revenues increased steadily during the years after reclassification. Moreover, in only one instance for each of three schools did total revenues decline from one year to the next, and each of those declines was minimal. Thus, the common belief that a change in division will enhance revenues is confirmed. We add, however, that statistically, there was no change in average adjusted revenues from the years before the reclassification to the years after. For comparison, we also examined how revenues changed for schools from the same division that did not reclassify. Average revenues for these schools increased by a greater amount over the same period. This finding is noteworthy, though it may be partially explained by the fact that the operating budgets of reclassifying schools were generally much larger than those of the control group and the fact that schools that reclassify likely build their monetary base in the years before the reclassification and therefore do not experience such a large change in revenues in the year after the reclassification.
Concomitantly, total operating expenses show similar but more dramatic steady increases after reclassification. Again, there appears only one year for each of three schools in which total expenses declined. Only one of these was substantial. On average, over all schools in our sample, expenses increased by a statistically significant $2.572 million from the years before the reclassification to the years after, which is well over the amount by which revenues increased. However, similar institutions that did not reclassify experienced a significant and quantitatively similar increase in expenses over the same period. The impact on net income or loss, of course, is determined by the extent to which revenues increase relative to operating expenses. It should be noted that all 11 of the reclassifying institutions were experiencing net operating losses before reclassifying. Although results are mixed, the majority of the schools (seven) experienced substantially greater net losses after reclassifying. Two of the schools show a reduction in their operating loss, one remained stable, and another showed losses that fluctuated greatly from year to year. Statistically, after the reclassification, there was a significant decrease in average net profits, on the order of $1.732 million. In general, the financial picture of reclassifying schools does not improve. Rather, the scope of both total revenues and total expenses, and in most cases net losses, simply gets larger. [Ed. Note: See Table 14.]
Division II to Division I-AA
Although the financial level at which Divisions II and I-AA operate is significantly lower than that of Division I-A, the percentage change in revenues, expenses and net losses is much more dramatic for these reclassifying schools than for those above.
The percentage increases in revenues for the eight schools after reclassification are generally vast. One school experienced a 1,200 percent increase; another 600 percent; a third tripled its revenues; and another saw an increase of 214 percent. Only one of the eight saw its revenues remain stable. On average, revenues for schools reclassifying from Division II to Division I-AA increased by a statistically significant $1.741 million after the reclassification. Economically, the average revenue for reclassifying programs after the reclassification is also significantly greater than the average revenue for a random sample of Division II schools that did not reclassify.
Unfortunately, operating expenses grew at an even greater rate, as all eight schools saw total expenses almost double (or more) those before reclassifying. Many schools experienced even greater increases, as evidenced by the resulting net losses. As was the case for schools reclassifying from Division I-AA to Division I-A, average expenses increased by approximately $2.445 million after the reclassification, which is not only statistically significant, but economically significantly more than the $1.417 million average increase in expenses that nonreclassifying Division II institutions experienced over the same period. Net profits also decreased after the reclassification by nearly twice as much as they did for nonreclassifying schools. [Ed. Note: See Table 15.]
Table 14 Financial Results of Schools Reclassifying from Division I-AA to I-A
| Prior Loss | Subsequent Loss | |
School A | $6,200,000 | $5,800,000 |
School B | 100,000 | 1,400,000 |
School C | 3,700,000 | 5,500,000 |
School D | 4,100,000 | 0 |
School E | 600,000 | 1,700,000 |
School F | 100,000 | 1,600,000 |
School G | 0 | 5,700,000 |
School H | 2,300,000 | 4,600,000 |
School I | 2,800,000 | 3,400,000 |
School J | 0 | 400,000 |
School K | 4,000,000 | 3,000,000 |
Source: National Collegiate Athletic Association. © National Collegiate Athletic Association. 2008–2010. All rights reserved.
Table 15 Financial Results of Schools Reclassifying from Division II to I-AA
| Prior Loss | Subsequent Loss | |
School A | $3,600,000 | $6,900,000 |
School B | 2,100,000 | 4,900,000 |
School C | 2,800,000 | 6,300,000 |
School D | 3,700,000 | 5,500,000 |
School E | 2,700,000 | 6,200,000 |
School F | 2,500,000 | 3,700,000 |
School G | 1,400,000 | 4,400,000 |
School H | 1,600,000 | 3,600,000 |
Source: National Collegiate Athletic Association. © National Collegiate Athletic Association. 2008–2010. All rights reserved.
Ethnic Diversity
Given the absence of financial benefits of reclassifying, institutions must rely on either intrinsic benefits or measurable nonfinancial benefits to justify their move. One often cited benefit is the potential to gain better diversity among the student population.
Data available for purposes of measuring ethnic diversity in an institution’s student population include enrollment numbers in the following groups:
Black, non-Hispanic men
Black, non-Hispanic women
Asian or Pacific Islander men
Asian or Pacific Islander women
Hispanic men
Hispanic women
White, non-Hispanic men
White, non-Hispanic women
Total men
Total women
Total enrollment
Division I-AA to Division I-A
Before Versus After Reclassification. Total enrollments for both the reclassifying schools and the control group have been steadily increasing during the entire 10-year period reviewed. This also holds true when the total enrollment before reclassification is measured against the enrollment after reclassification. Both groups show substantial total enrollment increases and substantial increases for both groups in white men and white women. A significant difference between the two groups is found, however, in the increases in the number of Black, non-Hispanic men and women. The reclassifying schools show a significantly greater increase in these areas than the control group. This holds true only in terms of total student count, however. When viewed as a percentage of total enrollment, the increases (before and after) are not significantly different for the two groups. The only significant “before and after” difference is found in the Asian or Pacific Island ethnic population. The decrease in this segment is significantly greater for the reclassifying schools than for the control group.
Only After Reclassification. More substantial differences between the two groups of schools are found in enrollment data during only the period after reclassification.
• Reclassifying schools experienced a greater increase in the number of Black, non-Hispanic men than the control group during the period after reclassification.
• Reclassifying schools experienced a greater increase in the number of Black, non-Hispanic women.
• The control group experienced a marginally greater increase in the number of Asian or Pacific Islander women.
• The control group experienced a greater increase in the number of Hispanic women.
• Reclassifying schools experienced a greater increase in the number of White, non-Hispanic men.
• Reclassifying schools experienced a greater increase in the number of White, non-Hispanic women.
• Reclassifying schools experienced a greater increase in Black, non-Hispanic men as a percentage of total enrollment.
• Reclassifying schools experienced a greater increase in Black, non-Hispanic women as a percentage of total enrollment.
• The control group experienced a greater increase in Asian or Pacific Islander men as a percentage of total enrollment.
• The control group experienced a greater increase in Asian or Pacific Islander women as a percentage of total enrollment.
• The control group experienced a greater increase in Hispanic men as a percentage of total enrollment.
• The control group experienced a greater increase in Hispanic women as a percentage of total enrollment.
• Reclassifying schools experienced a marginally greater increase in white men as a percentage of total enrollment.
• Reclassifying schools experienced a greater increase in total men as a percentage of total enrollment.
Tested Statistical Significance. Schools moving from Division I-AA to Division I-A generally saw a statistically significant increase in the average number of both male and female students (respective averages increased from 8225 males to 10,717 and 9270 females to 12,608).
Tested Statistical Significance. Schools moving from Division II to Division I-AA also saw a statistically significant increase in the average number of men and women. Specifically, the respective averages for men and women increased from 417 males to 543 and from 465 females to 611 after the reclassification. Nonreclassifying schools witnessed a similar increase in the average number of men and women. Interestingly, in schools that did not reclassify, the percentage of white men as a portion of total men increased significantly, though this was not the case for schools that reclassified. In terms of percentages, none of the ethnic groups experienced a statistically significant change after the reclassification. While the control group experienced increases in the raw number of Hispanic men and women and white men and women, the control group only experienced a significant increase in the percentage of white men. Indirectly, this may suggest that reclassification may help sustain a certain element of diversity.
Somewhat noteworthy, looking only at the years after the reclassification for schools that reclassified as compared to schools that did not reclassify, the average percentage of black men (women) as a portion of the total number of men (women) is statistically significantly lower for reclassifying institutions. Nonetheless, the relative proportion of white women is greater after the reclassification.
Graduation Rates. It is also worth mentioning that, on average, for those schools reclassifying to Division I-AA, graduation rates for both the student body and student-athletes are significantly greater in the years after the reclassification for reclassifying schools than they are for the schools that did not reclassify. This could point to reclassifying institutions being able to attract better students (athletes and non-athletes) as a result of increased visibility or prestige. The fact that graduation rates among athletes are higher is also consistent with the idea that Division I schools have fewer transfer students, perhaps because they offer more scholarship money, resources and facilities, and have more stringent transfer rules.
Because of the NCAA use of a six-year consortium for graduation rate purposes, combined with the timing of the reclassifications to Division I-A, sufficient data are not yet available for investigating the impact of reclassification on these schools.
Sports Sponsorship
In response to questions concerning the impact of an institution’s reclassification on the number of varsity sports sponsored by that institution, related data were collected for both the reclassifying and control groups for this study. Results are discussed below.
Division I-AA to I-A. For the 1993 fiscal year, the average number of varsity sports sponsored by Division I-A institutions was 10 men’s teams and nine women’s teams—a total of 19. For fiscal 2003, the average had fallen to eight men’s teams and nine women’s. For the reclassifying schools in this study, however, the average for the group moved from eight men’s teams and eight women’s teams (total of 16) in 1993 to eight men’s teams and 10 women’s teams (total of 18) in 2003. No school in the group saw a decline in total sports sponsored, although two remain the same. Rather, all 11 increased the number of women’s teams sponsored, and four reduced the number of men’s teams. The NCAA now requires that all Division I schools offer a total of 14 varsity sports—either seven men’s and seven women’s, or six men’s and eight women’s.
Division II to I-AA. For the 1993 fiscal year, the average number of varsity sports sponsored by all Division I-AA institutions was 10 men’s sports and eight women’s. For fiscal 2003, the averages were seven men’s sports and eight women’s. For the reclassifying group, the averages in 1993 were eight men’s and seven women’s, and in 2003 the averages were nine men’s sports and 10 women’s. Two schools show a drop in total sports sponsored, while all show an increase in women’s offerings. Five show a reduction in men’s offerings.
CONCLUSION
This study evaluates financial and nonfinancial benefits to reclassification. We find that for both Division II schools that reclassify to Division I, and for Division I-AA schools that reclassify to Division I-A, increased revenues from reclassification are more than offset by increased expenses, such that, on average, net losses after reclassification increase. This financial drain is greater for Division II schools. We also uncover some changes in the diversity of the student body.
More specifically, graduation rates increased significantly for institutions that reclassified to Division I-AA. Especially noteworthy in this context is that the increase was reflected among student-athletes and the student body. We attribute this to more stringent transfer requirements and to an ability to attract better students from a wider geographical base as a result of increased visibility. We also find that reclassified institutions sponsor more sports than the average institution in their new divisions, which may simply reflect that Title IX requires an increase in female athletes to match the increase in scholarships granted to football players. Regardless, these changes are not consistently significantly different from similar schools that did not reclassify during the same period.
Overall, our study suggests that there are neither obvious financial nor considerable nonfinancial measurable benefits from reclassification and that the primary motivation to reclassify is intangible (e.g., perceived increased prestige). Additionally, the findings in this study underscore the issue faced by school administrators who are considering reclassification. One significant and consistent finding is that reclassification is a financial drain to the athletics department. The fact that schools choose to reclassify despite this suggests that nonmonetary perquisites, perceived increases in status, and a “keeping up with the Joneses” effect may serve as motivation for reclassification. Of course, it is possible that there exist financial benefits to the schools that are not reflected in our data that pertains solely to athletics departments. This may be an avenue for future research.
….
Table 16 Men’s Basketball Record and Home Attendance in the First Year in Division I, 1998–2008
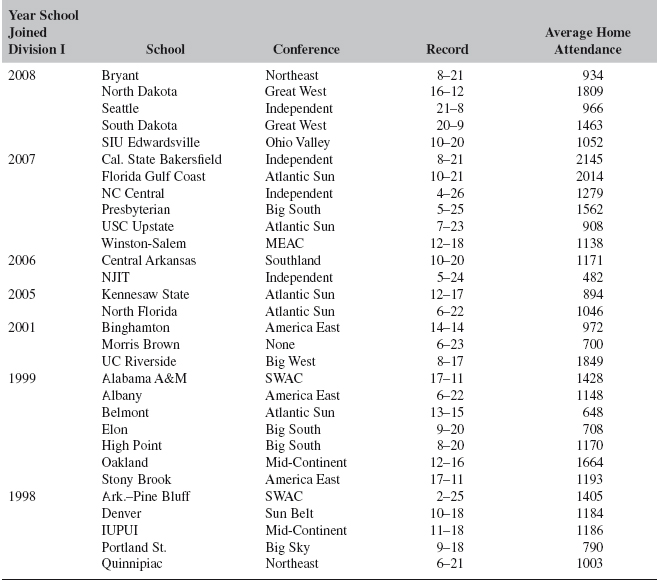
Reclassification from Division I-AA to I-A (Date)
University of Alabama at Birmingham (9/1/96)
Boise State University (9/1/96)
University at Buffalo, the State University of New York (9/1/99)
University of Connecticut (9/1/02)
University of Idaho (9/1/98)
Marshall University (9/1/97)
Middle Tennessee State University (9/1/99)
North Texas State University (9/1/95)
Portland State University (9/1/02)
University of South Florida (9/1/01)
Troy University (9/1/02)
Reclassification from Division II to I-AA (Date)
University at Albany (9/1/99)
Fairfield University (9/1/96)
Jacksonville University (9/1/98)
La Salle University (9/1/97)
Monmouth University (9/1/94)
Sacred Heart University (9/1/99)
Southeast Missouri State University (9/1/91)
Stony Brook University (9/1/99)
1. As anecdotal evidence, George Mason University discussed but dismissed the idea of reclassification with the Board of Visitors several years ago, but has since faced increasing pressure to reclassify. The school’s administration is currently preparing a presentation on the expected costs and benefits of reclassification, perhaps due in part to recent successes in men’s basketball.
2. Division III membership is markedly different from those of Divisions I and II and will not be explored in this paper.
3. See Orszag, J. M. and Orszag, P. R., 2005, “Empirical Effects of Division II Intercollegiate Athletics”, Competition Policy Associates, Inc.
OPERATIONAL ISSUES
CIRCUMSTANTIAL FACTORS AND INSTITUTIONS’ OUTSOURCING DECISIONS ON MARKETING OPERATIONS
Willie J. Burden and Ming Li
INTRODUCTION
Historically, outsourcing was a strategic initiative used by the general business community as a solution to a particular problem (Gay & Essinger, 2000). However, during the past decade, the outsourcing of marketing operations has become a common practice in American college athletics. According to Li and Burden (2002), more than one half of all NCAA Division I-A athletic programs have outsourced some or all of their marketing operations and rights to a growing number of nationally prominent outsourcing agencies. Among the operations commonly outsourced are the production of radio game broadcasts, production of radio call-in shows, coaches’ television shows, sales of media and venue advertising, sales of “official sponsorship” rights to corporations, and production and management of Internet websites, etc. (Li & Burden, 2002).
Outsourcing simply means acquiring services from an external organization instead of using internal resources (Butler, 2000). By using outsourced resources, organizations can gain a competitive advantage by using contingent staff to accomplish strategic goals without incurring the fixed overhead. By focusing on the leading edge and highly specialized skill sets, outsourcing providers can often offer services better, or at a lower price than the client organization. Typical reasons for outsourcing go beyond simple contingent staffing. Outsourcing providers are able to maintain economies of scale with regard to specialization (Butler, 2000).
The outsourcing movement has been energized by the increasing commercialization of intercollegiate athletics, largely a result of the enormous competition among the largest programs in the NCAA and their mandate to be successful, self-supporting, and economically profitable. Intercollegiate athletics has grown into a $3 billion-a-year annual industry (Padilla & Baumer, 1994; Sneath, Hoch, Kennett, & Erdmann, 2000) with more and more money being spent for new stadiums, celebrity coaches, and better training facilities, etc. Some schools have independent athletic departments that support themselves, but the majority is funded by the university. Approximately 100 athletic departments in Division I are “sucking money from the schools” (Rozin & Zegel, 2003). Those that cannot pay the bills are often forced into painful downsizing of their sports programs (Rozin & Zegel, 2003).
Since outsourcing in intercollegiate athletics is fairly new, the amount of information available regarding the advantages that athletic programs gain from outsourcing is limited. However, the information available concerning outsourcing and the broader business community is more abundant. With such characteristics as advantages and disadvantages, business strategies, business goals, quantity and types of functions outsourced, the availability of experienced service providers, and even the proportion of companies that have outsourced, outsourcing has affected intercollegiate athletics in similar as well as dissimilar ways as the general business community.
Many of the reasons that an intercollegiate athletics program might choose to outsource are the same as the general business community. In addition to the advantages previously stated, by outsourcing, organizations can alleviate time pressure, draw from a varied base of professional expertise including technology expertise, gain additional resources, remove internal political barriers, maintain cost effectiveness, and increase staff without all of the associated costs (Elmuti & Kathawala, 1998; Williams, 1998). Specifically, by outsourcing, an organization can free up valuable resources for other uses and can redirect its people and other resources to its core business activities that better serve the organization’s mission, purposes, and goals. By outsourcing, the organization can reduce operating costs through the elimination of the need for it to try to do everything itself, which often incurs high research, development, marketing, and deployment expenses (Davy, 1998).
The advantages in outsourcing can be operational, strategic, or both. Operational advantages usually provide for short-term trouble avoidance, while strategic advantages offer long-term contributions in maximizing opportunities. Outsourcing can cost more than doing something in-house, but offer benefits that justify it, like saving money or saving time (Chin, 2003). On the other hand, colleges and universities, when managed traditionally, are usually much more constrained. Because businesses are motivated to build their enterprises, they can be extremely creative. Unlike campus service departments, they are not allocated a budget or fund and asked to administer it. They work all the time for the market they serve in order to provide more and enhanced products and services that may earn them more money. That’s a very different kind of thinking than is typical of colleges and universities (Bartem & Manning, 2001).
The general business community has found it beneficial to outsource an ever-widening number of functions, including business processes, human resources services, personnel benefits, administrative services, and business services (Rombel, 2002). Historically, the focus of intercollegiate athletics programs has been on some aspect of marketing operations and rights that has included printed media, production of radio game broadcasts and call-in shows, coaches’ TV shows, licensing, and sale of media advertising. Also, the sport organization can utilize outside experts to handle difficult-to-manage functions. Most importantly, by outsourcing, the sport organization is able to access resources that are not available to it otherwise. This is vital considering today’s highly competitive athletic climate where many institutions, already understaffed, are experiencing hiring freezes or reduction in work force combined with the pressure to generate additional revenues to support expanding sports programs (e.g., NCAA Division I qualifications, gender equity requirements, and facility enhancements, etc.). The University of Virginia, for example, was able to take advantage of increased professional staffing while getting its needs met in the areas of corporate sponsorships, sales of radio and television rights, advertising sales such as signage and roadway billboards, and more promotions for Olympic sports. Additionally, by using an outsourcing agency, they were able to avoid the State of Virginia’s tough procurement regulations. Via additional business contacts, outsourcing has enabled the university to generate significantly more revenue than it would have on its own.
The general business community can select from numerous well-established service providers within each particular industry. However, since outsourcing is still relatively new in intercollegiate athletics, there are only a handful of reputable, major companies to select from….
There is a downside to outsourcing. One major international study concerning the biggest outsourcing deals of the 1990s concluded that more that 35 percent of the deals failed. The causes for the failures included degradation of services, biased business dealings in favor of the vendor, lack of input from management, loss of control, and problems related to selecting the right service provider to meet the organization’s needs (Gay & Essinger, 2000). Therefore, outsourcing might not be the right option for everyone. In addition, outsourcing does not always bring the anticipated benefits, and in some instances can be a risky proposition (Chin, 2003). Willcocks and Lacity (1998) stated that among its disadvantages are the potential loss of control over critical functions such as timeliness and quality of service, difficulty in monitoring vendor performance, difficulty in explaining the business needs to vendors, the potential for loss of company secrets as well as intellectual property, and the high cost of outsourcing contracts. Schools also risk developing a dependency on outside agencies, lowering employee morale, loss of development skills for employees, and having to face the prospect of managing relationships that go wrong (Kakabadse & Kakabadse, 2000; Hayes, 2001). By outsourcing, not only do schools lose some of the personal touch in servicing their employees but their clients as well (Rombel, 2002).
With respect to colleges, while outsourcing has become one of the measures taken by colleges to support their need to gain a competitive advantage, it has not always been the most ideal alternative for attaining marketing goals. The Air Force Academy is a good illustration of what could go wrong if a college makes a poor decision about outsourcing. By outsourcing, The Air Force Academy lost control over their radio network and team travel package, and from a competitive standpoint was disadvantaged by their partnership with the service provider. Their relationship with the business community soured and the outsourcing agency contracted sponsors that were a poor match for the Academy. Because the service provider benefited more from the arrangement than the athletic department it became necessary to dissolve their contract.
As mentioned previously, among the largest NCAA Division I programs, some schools have chosen the outsourcing option while others have not; outsourcing has advantaged some schools and not others; and, some schools have been successful while keeping everything in house and managing the job themselves. Under what circumstances should a school choose one option over the other? Burden and Li (2002) stated that circumstantial factors play a significant role in differentiating those athletics programs that have outsourced their marketing operations from those that have chosen to keep their operations in house.
OTHER CIRCUMSTANTIAL FACTORS AFFECTING OUTSOURCING DECISIONS
In addition to the perceived advantages outsourcing could bring to the institution, other situational issues play a signifi-cant role in the decision-making process. For example, the athletics director at Georgia Tech might outsource; however, if that same person subsequently takes the job at Washington, a school in a very different environment, he or she might easily decide against it. When the athletic administrators at a particular institution are contemplating whether or not they should outsource their marketing operations, they need to examine their institution’s mission, assess the attractiveness of their athletic product, establish who controls the property rights, determine the nature and status of the relationship it has with its local business community, and determine whether or not in-house resources are sufficient to get the job done.
First, the institution’s mission, philosophy, and goals, etc., should be consistent with an outsourcing strategy. Further, the mission defines the purpose and goals of the organization, what its products, services, markets, and customers will be. It describes what core competencies will be necessary to achieve the goals, how the organization will distribute the products and services, and how it will interact with customers (Greaver, 1999). A couple of questions administrators need to consider are “what is the organization in business to do?” and “what resources does the organization need in order to do what it is in business to do?” (Gay & Essinger, 2000, p. 30). If outsourcing plays a critical role in the organization’s overall strategy or service offerings, then outsourcing makes good sense for the organization and administrators can more effectively align its outsourcing objectives with the organization’s overall strategies (Issacs, 1999). Otherwise, in-house operations would be more appropriate.
Next, if the institution is to derive some benefits from outsourcing, it must be positioned to do so. Butler (2000) maintains that the decision to outsource or not really depends on various circumstances. In arriving at the correct solution, sport organizations contemplating the outsourcing option should examine their unique characteristics. For example, their athletic product needs to be attractive enough to attract a topnotch service provider as well as the interests of potential, new corporate partners. Outsourcing agencies are less likely to pursue a relationship with those programs that have few followers, are not widely recognized or do not command the interests of advertisers. To determine the attractiveness of their product, they need to evaluate such information as (1) the level of national or regional recognition and exposure of their athletic programs (e.g., number of games or events that have been televised by the national and regional media), (2) the level of success of all of their athletic programs, (3) the degree of alumni and fan support or following, (4) membership in one of the NCAA elite conferences, (5) national ranking of football and men’s basketball programs, (6) availability and/or use of state of the art facilities, and (7) accessibility of high profile coaches and blue chip athletes, etc. One rule of thumb in determining the attractiveness of an institution’s athletic program is to see whether or not the responses from outsourcing agencies to the institution’s request for proposal (RFP) for outsourcing collaboration are favorable. If the athletic administrators do believe their product is attractive enough, they should move on to the next step. Otherwise, they should not go for the outsourcing option (Li & Burden, 2004).
Who controls the property rights? This is a fundamental question that needs to be answered after the attractiveness of the product has been determined. In most cases, the athletic department has complete control over the rights of their athletic properties (e.g., sales of media advertising and venue signage, coaches’ TV shows, TV and radio game broadcasts, licensing and merchandising, “official” sponsorships and venue naming rights, luxury seating, and production and management of Internet web sites, etc.). Nevertheless, there are some colleges and universities whose administrations want to exercise close control over all property rights, including those in athletics. As such, the athletic department cannot make any unilateral decisions in terms of outsourcing. If the athletic department has the ultimate authority to determine the use of athletic properties then it can certainly exercise its right to do so. In this scenario, the relationship between the athletic department and the business community is the next issue that needs to be examined.
The depth of an institution’s relationship with the business community is another important consideration (Li & Burden, 2004). If it is strong, the collaboration with an outsourcing agency will not diminish the relationship but increase leverage and synergy. If the relationship is weak, the institution risks losing support from local businesses by introducing an unfamiliar intermediary.
If the athletic administrator is still uncertain, then he or she should determine whether or not in-house resources are sufficient to get the job done. Finally, if it is determined that in-house resources are not sufficient, and, after all of the issues have been thoroughly reviewed, then outsourcing logically becomes a viable alternative for achieving the organization’s goals. Figure 2 is a flowchart illustrating the decision-making process for outsourcing recommended for intercollegiate athletic administrators in NCAA Division I institutions.
….
SUMMARY
The fiercely competitive nature of intercollegiate athletics, escalating cost of doing business, and mandate that campus athletics programs be self sufficient has made outsourcing marketing functions fashionable in recent years. Outsourcing has been described as an important tool for attaining and maintaining a competitive edge in intercollegiate marketing programs. Additionally, outsourcing is growing in appeal to individual institutions because of a variety of reasons important to them. The advantages in outsourcing can be operational, strategic, or both, ranging from alleviating time pressure on understaffed departments to generating large sums of revenues that were not available to the institution before. The disadvantages include the potential loss of control over critical functions such as timeliness and quality of services to managing dysfunctional partnerships.
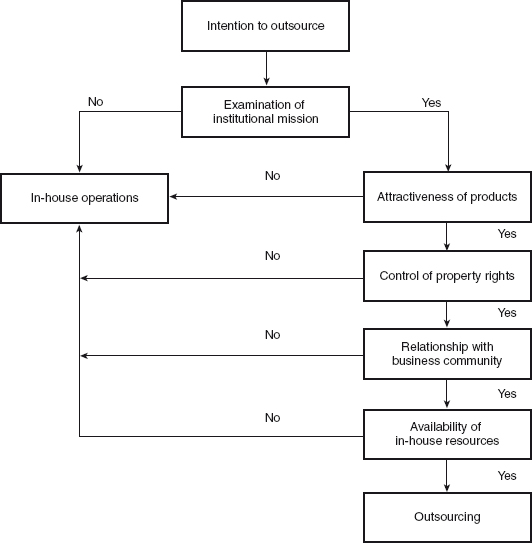
Figure 2 Flowchart of Decision-Making Process for Outsourcing
Source: Sport Marketing Quarterly. Used with permission from Fitness Information Technology.
This study discussed the process of making outsourcing decisions in intercollegiate athletics and proposes that the decision to outsource is circumstantial. Cases involving three NCAA Division I-A institutions were reviewed and used to support the central theme. Essentially, athletics administrators must complete a strategic analysis of their business environments to determine if outsourcing is a good fit for their institutions. However, according to Butler (2000) it must be emphasized that an organization’s philosophy, goals, and strategic directions strongly influence the decision whether to outsource and what work to contract out. Consideration of these factors helps the institution determine whether it is advantageous to outsource or keep everything in-house.
Additionally, it is evident that outsourcing in intercollegiate athletics is an evolving process. Some schools are positioned to gain a competitive advantage by outsourcing. Others have the necessary resources in-house to get the job done. However, some schools still need to better position themselves if they are to gain benefits from outsourcing.
Also, what about those schools that do not have a top 10 athletics program, how do they retain their competitiveness? In order to address these issues future study is needed.
References
Bartem, R., & Manning, S. (2001). Outsourcing in higher education. Change, 33(1), 42.
Butler, J. (2000). Winning the outsourcing game. Boca Raton, FL: Auerbach. Chin, T. (2003). The doctor is outsourcing. American Medical News, 46(30), 17.
Davy, J. (1998). Outsourcing human resources headaches. Managing Offices Technology, 43(7), 6.
Elmuti, D., & Kathawala, Y. (1998). Outsourcing to gain a competitive advantage. Industrial Management, 40(3), 20–25.
Gay, C., & Essinger, J. (2000). Inside outsourcing. Naperville, IL: Nicholas Brealey.
Greaver, M. (1999). Strategic outsourcing. New York: American Management Association.
Hayes, F. (2001). A light on ASPs computer world, 35(34), 62.
ISP Website. ISP sports celebrates 10th birthday (n.d.). Retrieved May 25, 2004, from http://www.ispsports.com/news.cfm?id=8.
Issacs, N. (1999). Two companies, two outsourcing decisions. InfoWorld, 2/(24), 82.
Kakabadse, N., & Kakabadse, A. (2000). Critical review—Outsourcing: A paradigm shift. Journal of Management Development, 19(8), 670–728.
Li, M., & Burden, W. (2002). Outsourcing sport marketing operations by NCAA Division I athletic programs: An exploratory study. Sport Marketing Quarterly,11(4), 226–232.
Li, M., & Burden, W. (2004). Institutional control, perceived product attractiveness, and other related variables in affecting athletic administrators’ outsourcing decisions. International Journal of Sport Management, 5(4), 1–11.
Padilla, A., & Baumer, D. (1994). Big-time college sports: Management and economic issues. Journal of Sport & Social Issues, 18(2), 123.
Rader, A. (2002, June). Working with an outside agency. Paper presented at the 11th Annual Conference of the National Association of Collegiate Marketing Administrators, Dallas, Texas.
Rombel, A. (2002). Handing it over. Global Finance, 16(6), 42.
Rozin, S., & Zegel S. (2003, October 20). A whole new ball game? The push to reform and scale back collegiate athletics is gaining yardage. Business Week, 3854, 100.
Sneath, J. Z., Hoch, R.M., Kennett, P.A., & Erdmann, J.W. (2000). College athletics and corporate sponsorship: The role of intermediaries in successful fundraising efforts. The Cyberjournal of Sport Marketing, 4(3), 42.
Willcocks, L., & Lacity, M. (1998). Strategic sourcing of information systems: Perspectives and practices. New York: Wiley & Sons.
Williams, O. (1998). Outsourcing: A CIO’s perspective. Boca Raton, LA: St. Lucie Press.
TAX ISSUES
TAX PREFERENCES FOR COLLEGIATE SPORTS, MAY 2009
The Congress of the United States, Congressional Budget Office
PREFACE
Colleges and universities generally qualify for preferential treatment under the federal income tax because their educational mission has important benefits for the public. But concerns have arisen that some activities undertaken by colleges and universities are only loosely connected to educating students and might be viewed as unrelated to the schools’ tax-favored purpose. Long viewed as an integral component of higher education, sports in many universities have become highly commercialized. The large sums generated through advertising and media rights by schools with highly competitive sports programs raise the questions of whether those sports programs have become side businesses for schools and, if they have, whether the same tax preferences should apply to them as to schools in general.
This Congressional Budget Office (CBO) paper, which was prepared at the request of the Ranking Member of the Senate Finance Committee, compares athletic departments’ share of revenue from commercial sources with that of the rest of the schools’ activities to assess the degree of their commercialization. It also discusses the benefits of intercollegiate sports programs and some of the issues that might arise if the Congress decided to alter the treatment of those programs in the tax code. In accordance with CBO’s mandate to provide objective, impartial analysis, the paper makes no recommendations….
CURRENT TAX TREATMENT OF THE ACTIVITIES OF COLLEGES AND UNIVERSITIES
As nonprofit institutions, colleges and universities are granted a variety of federal tax preferences that are designed to support their educational purpose, which has social as well as private benefits. Those preferences are not unlimited. The law has consistently attempted to balance the advantages of preferential federal tax treatment for nonprofit organizations against the possibility that those preferences could be used to engage in commercial activities that compete with taxable businesses.
Institutions of higher education, both public and private, benefit from several types of preferential tax treatment. Nonprofit private schools, like other nonprofits defined in section 501(c)(3) of the Internal Revenue Code, are exempt from the federal income tax, are eligible to receive charitable contributions that the donor may deduct, and may use tax-exempt debt to finance capital expenditures. Public colleges and universities receive broadly similar tax preferences; as state or local government entities, they are exempt from federal income taxation, are eligible for deductible contributions, and may have access to tax-exempt debt.
Like other nonprofit organizations, colleges and universities receive those preferences because they serve a public purpose. For institutions of higher learning, that public purpose is clearly education, which has traditionally included education through participation in athletics. Education is associated with a wide range of favorable outcomes. Investment in human capital through education confers a considerable private benefit on the individual, in the form of higher income and better health.1 Education also creates public benefits for the community as a whole, including a more skilled workforce, increased economic growth, and greater social mobility.2 An individual’s decision regarding how much education to invest in will depend on his or her private benefit alone; in the absence of government intervention, that decision will yield fewer public benefits than is socially desirable. The favorable tax treatment of educational institutions, including those providing postsecondary education, is one way in which policymakers may be able to offset some of the potential underinvestment in human capital and subsidize the social benefits of education.
Because providing such benefits is the primary justification for nonprofit institutions’ federal tax preferences, the government has a clear interest in ensuring that those preferences are used to facilitate activities that yield those benefits and not other activities. Thus, the federal income tax exemption for nonprofits is limited to income earned from the pursuit of the purpose that renders them eligible for the exemption, referred to as related income. Income earned from activities that are not substantially related to the performance of the exempt purpose is not tax-exempt and is subject to the corporate income tax on unrelated business income, commonly referred to as the unrelated business income tax (UBIT). That tax was enacted in 1950, at least partially in response to New York University’s acquisition of Mueller’s, the noodle and pasta company. The purchase of that previously taxable business contributed to the perception that nonprofit-owned businesses, facing lower costs because of their tax-exempt status and other federal subsidies, would be able to underprice taxable businesses, leading to unfair competition and the erosion of the corporate tax base.3
Policymakers at that time were also concerned that allowing charitable institutions to pursue commercial activities on a tax-exempt basis would encourage them to allocate an excessive amount of resources to those activities rather than to their charitable purpose. To that end, the law they enacted subjected income from commercial enterprises to the UBIT even if that income was used to finance the primary mission of an exempt organization. For colleges and universities, for example, the income they earn from tuition, research grants, passive investment income (which includes royalties, interest, and capital gains), contributions, and athletics is considered related to the exempt purpose and is therefore tax-exempt, but income earned from operating a restaurant that serves the general public is not, even if the profits are used to provide educational services for students.
Because public universities operate under the auspices of state governments, laws regarding state commercial enterprises may also be relevant to the commercialization of their activities. In general, the Internal Revenue Service (IRS) has never considered state commercial enterprises of any type taxable, even if they are separately incorporated, because their operation is invariably classified as an essential state function and the income accrues to the state government. The Internal Revenue Code, however, specifically makes state colleges and universities subject to the UBIT. That situation creates an anomaly: Any other state entity running a trade or business would not be subject to the UBIT and taxation, but a state college running the same unrelated business would be subject to the tax under current law.
Like the exemption from federal income taxation, the deductibility of charitable contributions to a nonprofit entity is subject to some limits when the contribution resembles a commercial transaction. In general, contributions given to a nonprofit in exchange for a good or service are nondeductible for the donor. Some donations to athletic departments are made to obtain the right to buy game tickets or preferential seating, and in 1986 the IRS ruled that such contributions were in return for a “substantial benefit” and were therefore nondeductible. In 1988, however, the Congress enacted legislation that explicitly permitted donors to deduct 80 percent of those contributions under section 170 of the Internal Revenue Code.
COMPARING COMMERCIALIZATION IN ATHLETIC DEPARTMENTS AND OTHER UNIVERSITY ACTIVITIES
This paper does not consider the possible commercial nature of a college or university as a whole.4 Rather, the analysis takes the primarily noncommercial nature of the entire institution as a given and focuses on the activities of athletic programs. Specifically, this analysis addresses the concern that athletic programs have become primarily commercial—that is, they regularly provide a good or service in exchange for a fee in a market that also includes businesses subject to taxation—rather than educational. To assess the commercial nature of sports programs, the Congressional Budget Office (CBO) first examined the sources of athletic departments’ revenue for a subset of colleges and universities and then compared them with the sources of revenue for the schools as a whole. The data indicate that athletic departments at some schools are significantly more commercial than the schools’ other activities.
Commercial Activity in Athletic Programs
The analysis focused on athletic departments at schools in Division I of the National Collegiate Athletic Association (NCAA)—a voluntary organization through which colleges and universities govern their sports programs. Division I comprises the schools that have the largest sports programs—they must meet NCAA minimum standards for the number of sports played and for the amount of financial aid awarded to athletes—and are therefore most likely to engage in commercial activities. The division is further divided into three subdivisions—Divisions IA, IAA, and IAAA—that are relevant only for football.5 To participate in Division IA, schools must meet certain minimum standards for football programs, including home game attendance and scheduled games against other members of the subdivision.
Information on athletic departments’ budgets is available for 164 of the 327 schools that were members of Division I in academic year 2004–2005. The data were collected by the Indianapolis Star newspaper in 2006. The Star requested, under the Freedom of Information Act (FOIA), the budget reports that the NCAA requires from the athletic departments in all schools in Division I. The 112 private schools in the division were exempt from the requests, as were public schools in Pennsylvania and Delaware, by state law.6
The Star data show that the largest source of athletic departments’ revenue is ticket sales, followed by contributions, distributions by athletic conferences of revenue from championship games (including the sale of television rights for those games), and student fees. Large differences exist within the group, however. Division IA schools receive a considerably higher share of revenue from ticket sales (25.4 percent), contributions (20.8 percent), and conference distributions (15.6 percent) than the two other subgroups. That result is not surprising, considering the much higher profile of the football teams in Division IA (see Table 17).
Table 17 Sources of Revenue for NCAA Division I Athletic Programs, Academic Fiscal Year 2004–2005
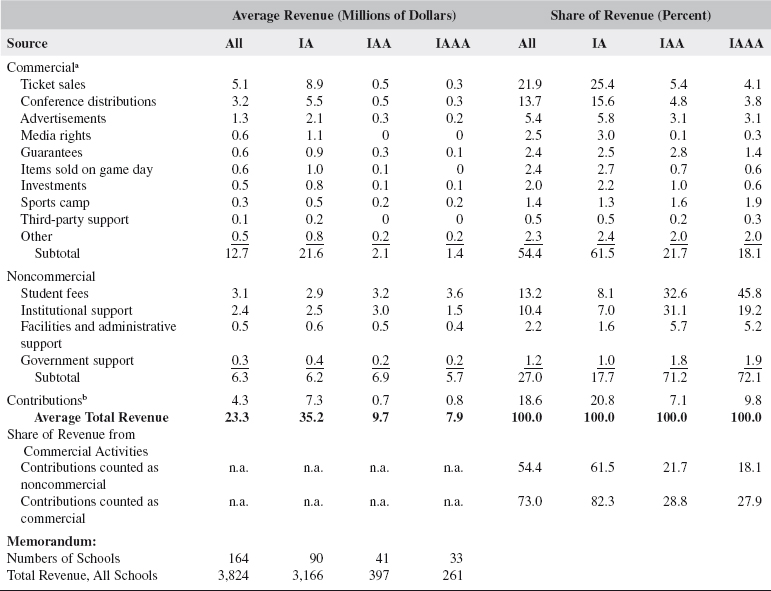
Source: Congressional Budget Office based on data included in the budget reports that all Division I schools submit to the National Collegiate Athletic Association for their athletic programs. The data presented here, which include 164 of the 327 schools in Division I in academic fiscal year 2004–2005, were made available in response to a request by the Indianapolis Star newspaper under the Freedom of Information Act. Courtesy of the Congressional Budget Office.
Notes: The academic fiscal year typically runs from July 1 to June 30.
NCAA = National Collegiate Athletic Association; n.a. = not applicable.
a. Defined as revenue received in exchange for goods or services in a market that also includes taxed businesses.
b. Contributions can be commercial or noncommercial.
For its analysis of commercialization, CBO divided athletic departments’ revenue into two main categories: commercial and noncommercial, described in more detail in Box 1. Revenue received in exchange for goods or services was classified as “commercial” revenue. Commercial sources include income from ticket sales, conference distributions (most of which derive from the sale of the rights to broadcast championship games), sales of team merchandise, and sales from advertisements. Support from the government and the school, the use of the school’s facilities, and student fees were classified as “noncommercial.”
Contributions to the athletic programs are more difficult to classify than the other sources. Although some contributions are given purely in support of the program, others guarantee the donor a tangible benefit in the form of a good or service. The data specifically count as contributions any amount paid in excess of the face value of a ticket; those excess values are typically paid in return for preferential seating at games. Payments may also be required before a fan can even become eligible to purchase premium tickets to games; such payments are legally considered partially deductible (80 percent) charitable contributions, despite the clear parallel to fee-for-service commercial transactions. The value of some donations of in-kind merchandise, such as apparel and soft drinks, are counted as contributions in the Star data, and those gifts represent an exchange in which the donor is paid with advertising and exposure when teams use their products. Contributions to the programs of the schools in Divisions IAA and IAAA, which have a lower profile, are unlikely to be related to premium ticketing or advertising, but over 90 percent of the total contributions to athletic departments go to Division IA schools, at which those factors are likely to be important. Most contributions thus seem to be related to the exchange of goods or services and therefore are primarily commercial. However, because the data do not specify which contributions are associated with a benefit to the donor and which are not, the tables in this report present the commercial share of revenue both with and without contributions.
When contributions are counted as commercial revenue, 73 percent of the revenue of athletic departments for Division I schools comes from commercial sources; when contributions are considered noncommercial, the share is about 54 percent. Within Division I, however, there are dramatic differences. Depending on whether contributions are considered commercial, athletic departments at Division IA schools receive about 60 percent to 80 percent of revenue from commercial sources, compared with 20 percent to 30 percent for schools in Divisions IAA and IAAA.
Commercial Activity in Other University Programs
The share of revenue from commercial activity in the rest of the university serves as a useful benchmark in determining whether athletic departments generate a disproportionately high share of revenue from commercial activity.
The Department of Education maintains the Integrated Postsecondary Education Data System (IPEDS), which contains data on revenue from most postsecondary institutions. CBO used those data to estimate the commercial share of total revenue for the entire school. IPEDS includes a category for revenue earned from auxiliary enterprises, defined as “revenues generated by or collected from the auxiliary enterprise operations of the institution that exist to furnish a service to students, faculty, or staff, and that charge a fee that is directly related to, although not necessarily equal to, the cost of the service.”7 Examples of auxiliary enterprises include residence halls, food services, and athletic departments; all revenue from those sources is classified as commercial.
Many university systems also have hospitals, which serve populations and missions that are somewhat different—though overlapping—from those served by the rest of the university. Although most hospital revenue is received in exchange for services, universities’ hospital services are not typically viewed as a commercial enterprise. Whether hospitals should be considered a fundamental part of the universities’ educational mission is unclear….
With associated university hospitals excluded, the universities as a whole derive almost 11 percent of their revenue from commercial activities when contributions to the university are considered a noncommercial source of revenue. That share rises to about 14 percent when contributions are classified as commercial.8
A final consideration is the treatment of athletic programs’ revenue within the overall university. For schools in Division IA, that revenue comes primarily from commercial sources, so including it boosts the share of revenue from commercial sources for the university as a whole. Because the IPEDS data do not have a separate category for the revenue of athletic programs, CBO used the Indianapolis Star data to estimate each category of revenue net of the effect of athletic programs.9
When athletic departments are removed from the calculation of commercial revenue for the university, the commercial share falls. Excluding hospitals, the share of university revenue from commercial sources is about 8 percent when contributions are considered noncommercial. That treatment of contributions may be more appropriate for the rest of the university than for the athletic department, although individuals or organizations making the largest donations to universities also tend to receive something, such as naming rights, in return. When contributions are considered commercial, the share of university revenue from those sources is about 11 percent.10 Clearly, athletic departments derive a considerably higher share of their revenue from commercial activities than do other parts of universities. Depending on how it is calculated, the share of revenue from commercial sources is seven to eight times higher for Division IA athletic programs than for all other functions at those universities. For Divisions IAA and IAAA, the share of commercial revenue for athletic programs is only two to three times as large as for the universities’ other activities (assuming that the extent of commercial activity in those schools, apart from the athletic department, is comparable with that in Division IA schools).
SOURCES OF REVENUE OF ATHLETIC DEPARTMENTS
The data the Congressional Budget Office (CBO) used to determine the sources of revenue of athletic departments in Division I of the National Collegiate Athletic Association (NCAA) are from the request made by the Indianapolis Star newspaper under the Freedom of Information Act in 2006. That request was for the budget reports that athletic departments are required to submit to the NCAA. The data include 164 of the 327 schools in Division I in academic year 2004–2005. CBO classified the sources as commercial or noncommercial, as described below; contributions, which can be commercial or noncommercial, were put in a separate category.
COMMERCIAL SOURCES OF REVENUE
Broadly defined, commercial activities provide a good or service in exchange for a fee in a market that also includes taxed businesses. For this paper, CBO classified the following activities as commercial:
Ticket sales. Ticket sales to the public, faculty, and students and money received for shipping and handling of tickets. Excludes ticket sales for conference and national tournaments.
Conference distributions. Revenue received from participation in bowl games, tournaments, and all NCAA distributions (for example, amounts received for direct participation or through a sharing arrangement with an athletic conference, including shares of conferences’ television agreements). Advertisements. Revenue from corporate sponsorships, sales of advertisements, trademarks, and royalties. Includes the value of in-kind products and services provided as part of a sponsorship (for example, equipment, apparel, soft drinks, water, and isotonic products).
Media rights. Institutional revenue received directly for radio and television broadcasts; Internet and e-commerce rights received through contracts negotiated by the institution.
Guarantees. Revenue received from home teams for participating in away games.
Items sold on game day. Revenue from the sale of programs, novelties, and food or other concessions and from parking fees.
Investments. Distributions from an endowment and other investment income in support of the athletic department.
Sports camp. Amounts received by the athletic department for sports camps and clinics.
Third-party support. All amounts provided by a third party and contractually guaranteed by the institution but not included on the institution’s W-2 (for example, a stipend for the use of a car; membership in a country club; allowances for entertainment, clothing, and housing; speaking fees; compensation from camps; and income from radio, television, shoes, and apparel).
Other. Accounts for less than 5 percent of total revenue.
NONCOMMERCIAL SOURCES OF REVENUE
All sources of revenue not meeting the definition of “commercial” were classified as noncommercial:
Student fees. Fees assessed for support of (or the portion of overall fees allocated to) intercollegiate athletics.
Institutional support. Includes the value of institutional resources for the current operations of intercollegiate athletics; all unrestricted funds allocated to the athletic department by the university. That support may include state funds, tuition, tuition waivers, and transfers.
Facilities and administrative support. Includes the value of facilities and services provided by the institution and not charged to the athletic department (for example, an allocation for institutional administrative costs, facilities and maintenance, grounds and field maintenance, security, risk management, utilities, and debt service).
Government support. Includes state, municipal, federal, and other government appropriations made in support of the operations of intercollegiate athletics (including funding specifically earmarked for the athletic department by government agencies for which the institution has no discretion to reallocate).
CONTRIBUTIONS
Contributions were defined as amounts received directly from individuals, corporations, associations, foundations, clubs, or other organizations that are designated, restricted, or unrestricted by the donor for the operation of the athletic program. Examples of contributions are amounts paid in excess of a ticket’s value (for example, to obtain premium seating), cash, marketable securities, and in-kind contributions. In-kind contributions may include automobiles provided by dealers (measured as the market value of the use of a car), apparel, and soft drinks for use by staff and teams.
Source: Courtesy of the Congressional Budget Office.
Looking at the net income of athletic programs highlights the differences in the commercial nature of programs between the three Division I subgroups. Nearly 99 percent of total net income accrues to Division IA programs, according to the data reported by universities to the NCAA.11 Average income for programs in Divisions IAA and IAAA is less than a tenth of that in the more commercial Division IA. Those differences in reported income are discussed later in the context of possible policy changes.
Even in that group of elite Division IA programs, however, more than a quarter of the athletic programs report a deficit each year. That result is more likely to reflect the conceptual difficulties in measuring income rather than a statement about the true underlying profitability of those programs. The correct allocation of revenue and expenses to athletic departments, and thus their net profit, is complicated. There are no rules or even standard practices delineating how schools divide revenue from parking, concessions, or licensing, for example, between the athletic department and the university.12 On the cost side, schools generally list the full standard tuition as the cost of an athletic scholarship, even though that measure overstates the true cost of awarding the scholarship.13 Because accounting practices vary, the reported profit or loss reported … may be a poor guide to the true financial status of athletic departments.
Competition with For-Profit Entities
Public and private colleges face relatively little competition from taxable competitors; for-profit postsecondary schools accounted for just 5 percent of total enrollment in degree-granting institutions in 2004.15 When athletic departments function primarily as a part of the educational experience for students, they participate in that nonprofit market. However, highly competitive college sports teams with large-capacity stadiums and prime-time television events with advertising are more reasonably considered participants in the market for entertainment. They compete for entertainment spending with many other recreational options, but their most direct competitors are professional sports leagues.
Even though competitive university sports programs enter the same market with tax advantages unavailable to the taxable professional leagues, those leagues have never advocated removing tax preferences for the college programs. One reason may be that college sports tend to reduce costs for professional sports.16 The two sports with the most active and commercial college programs—football and basketball—are each controlled by a single professional association that spends very little on training players. In many cases, all but the final polishing is done by the colleges while the players maintain amateur, nonpaid status.17 If players were not trained by colleges, the professional leagues would probably have to pay those players a salary and complete the training themselves. Particularly in football, the same lack of other leagues in the market—due at least in part to the partial antitrust exemptions granted to the National Football League (NFL)—has also facilitated explicit arrangements between the NCAA and the NFL that avoid direct competition so that they can jointly maximize revenue. For example, college and professional football teams play on different days of the week during the college season. Once the college football season is completed, professional teams play some games on Saturday, the day usually reserved for colleges.
THE BENEFITS OF COLLEGIATE ATHLETICS
Although this analysis focuses on the commercialization of university athletics, the favorable tax treatment of athletic departments within a university might also be evaluated in terms of the social benefit those programs provide to federal taxpayers, who finance the subsidies the universities receive. Research indicates that student athletes tend to underperform academically relative to their credentials, although there is no clear evidence about whether their participation in competitive athletics creates other types of human capital with social benefits.18 If student athletes reap less academic benefit from higher education than other, similarly qualified students, the admission preferences they currently have represent a misallocation of education resources.
Collegiate athletics, like other extracurricular activities, may also enhance the quality of student life in various non-academic ways that could also have social benefits. Supporters of university athletic programs cite the leadership skills, teamwork, and dedication that student athletes may learn through their participation.19 Participating in and watching sporting events can also contribute to an institution’s sense of community.
Athletics are unique among extracurricular activities, however, because of the expensive infrastructure support associated with providing such benefits to participants. Although some other activities also require facilities that are expensive to construct and maintain, salaries for coaches are higher than those for almost any other university employee, including college presidents, and no other extracurricular activities are provided with academic tutoring programs like those that focus on maintaining athletic eligibility.20
Athletic programs might also provide ancillary benefits (in addition to any direct profit from the programs themselves) to the schools, allowing them to further their mission of higher education. Athletic programs could benefit schools indirectly by improving their name recognition or reputation.21 Successful athletic programs could also encourage increased giving by alumni to a school or improve the quality of the entering class by increasing the number of students who apply for admission. Although various empirical studies on both of those points have come to conflicting conclusions, overall the evidence indicates that the effect of successful programs on either of those measures at a specific school is likely to be positive but small (see the appendix).
Applying those conclusions to all university athletic programs in the nation—the appropriate level at which to evaluate a federal subsidy—is difficult. Most studies look at the relationship between success, defined by win-loss records or championship wins, and alumni giving or the number of applications at a specific school. Because athletic success is in general a zero-sum endeavor (championship games always have a winner), the relationships that hold for a single or small group of athletic programs may not hold for all athletic programs in the nation. There is no evidence suggesting that athletic programs increase the overall amount of charitable contributions (as opposed to shifting them between different schools or other nonprofit organizations) or the average quality of students attending all colleges.22 Furthermore, the effect of athletic programs on either of those measures seems likely to be dwarfed by that of the many other federal subsidies for charitable giving and higher education. In fact, the current subsidy to athletic departments may simply encourage an “arms race” between schools, in which universities spend increasing resources on measures of athletic success that, at most, benefit their own institutions at the expense of others. Encouraging such competition within the higher education sector seems unlikely to benefit the federal taxpayers that ultimately pay for the subsidy.
POLICY OPTIONS
If the Congress decided that some or all of the activities undertaken by college athletic programs are primarily commercial, the rationale for providing preferential tax treatment to those activities would be eliminated or greatly reduced. Changes to the tax preferences could be achieved in one or more of the following ways:
• Limiting the deduction of charitable contributions,
• Limiting the use of tax-exempt bonds, or
• Limiting the exemption from income taxation, either for all or for certain types of income.
Several issues might arise if the Congress decided to eliminate or reduce those tax preferences. Most important, the position of athletic departments within larger nonprofit institutions affords many opportunities for shifting contributions, other revenue, or expenditures from one part of the university to another. The budgetary relationship between universities and their constituent parts would significantly reduce the effectiveness of most attempts to limit the general tax preferences for athletics while leaving those for the entire university intact. More targeted changes, such as limiting the types of income statutorily exempt from the unrelated business income tax, are more likely to have an impact but would still require assessing the commercialization of all of the university’s activities rather than just those of the athletic department.
Limiting the Deduction of Charitable Contributions
Under the Internal Revenue Code, donors to college sports programs may deduct their contributions from their federal adjusted gross income. Many of those contributions, however, are made in order to become eligible to purchase game tickets or to ensure access to premium seating. In effect, the transaction is an exchange of money for valuable rights, and the benefits of the contribution accrue to the donor. Under current law, the donor may nonetheless deduct 80 percent of the value of such contributions.
If the Congress decided that contributions to athletic departments are primarily commercial, it could specify that contributions to universities’ sports programs or to foundations that support them—either contributions given in exchange for certain benefits or all contributions—may not be deducted on the donor’s federal tax return. Money can easily be moved between departments within the university, however, and a university administration can allocate a greater share of its own budget to its sports program. If that fact is well understood by donors and administrators, donations to sports programs might be unaffected by such a policy change; lower explicit donations to the athletic programs could simply be offset by indirect donations through the university.
Although such a response might completely offset the effects of a change in the deductibility of contributions, it would probably not do so. Total donations would be likely to decline to some extent, and a school’s response would determine how the effects of that decline were shared between the athletic program and other parts of the budget.
Limiting the Use of Tax-Exempt Bonds
Although contributions can be given to or earmarked for sports programs directly, athletic departments generally do not have borrowing authority that is separate from that of the college or university as a whole. The borrowing is undertaken on behalf of the school and is earmarked for the sports program in the tax-exempt bond offering.
It would thus be more difficult for schools to move borrowing that is earmarked for another part of the university to the athletic department if the Congress prohibited the use of tax-exempt bonds to finance the capital facilities of sports programs. Even so, it might be possible for the university to borrow indirectly for the sports program. If the university could not use the proceeds from bonds directly for the sports program, it could still borrow for capital spending in other areas that would have been financed with operating revenue and use that operating revenue to finance the sports facilities. The major problem would be the large amount of revenue needed—the university might not have adequate capital facilities being financed with operating revenue to make the substitution. Thus, eliminating the direct use of tax-exempt bonds for sports facilities would be unlikely to eliminate their use but would probably have a bigger effect on the total amount of bonds a university issues than the elimination of charitable contributions would have on total charitable contributions.
Limiting the Exemption from Income Taxation
Attempts to end the exemption from income taxation for athletic departments would probably encourage universities to undertake significant efforts to avoid taxes. A sports program’s position within a much larger institution makes successful taxation of its true net income a difficult undertaking. Changing the treatment of income from specific sources, such as royalty income or income from corporate sponsorships, might be effective, especially if the changes applied to the entire university rather than just the athletic program.
Subject the Income of Athletic Programs to the UBIT
The Congress could, by statute, reclassify collegiate athletic programs as unrelated commercial entities operated by a nonprofit organization, thereby subjecting them to the unrelated business income tax.23 Because an athletic program in a nonprofit private or public postsecondary institution is part of a much larger economic entity that would remain classified as a nonprofit, the institution would have a substantial incentive to shift costs from the untaxed portion of the university to the taxable portion and to shift income in the other direction. Increased net income would have no tax consequences for the untaxed sector, and increased costs would reduce or eliminate taxable net income for the athletic program.24
Universities have other means of eliminating taxable income if cost shifting failed to do so completely. Unlike a for-profit enterprise, which has shareholders who expect managers to distribute a surplus as dividends or retain the surplus and distribute it in the future as capital gains, the nonprofit or public enterprise has no shareholders. If athletic programs still showed a profit even after income or cost shifting, that profit could be reduced or eliminated in two ways. First, the program could increase costs by paying higher wages to coaches or administrators or by spending more for other items, such as athletic facilities.25 Second, the program could reduce revenues—for example, by lowering the price of game tickets. Directors of athletic programs might prefer to use one of those alternatives rather than pay taxes; all of the alternatives would reduce the income subject to tax.
Restructure the Relationship between Athletic Departments and the University
The schools’ ability to shift income from one part of their budget to another is likely to prevent the net income of collegiate athletic programs from being taxed. To prevent such shifting, the Congress could require that the financial relationship between athletic programs judged to be commercial and their universities be severed completely. Like any commercial entity, the athletic programs could still lower their tax liability by reducing revenue or increasing costs, but they would be limited in doing so by their need to raise capital.
Such a major restructuring of the relationship between athletic departments and universities would present a variety of practical and political issues. Perhaps most important, it would be extremely difficult to implement effectively at the public universities that host most of the major sports teams. The Congress has made many changes to the exemption for nonprofit institutions, including imposing the unrelated business income tax. But the IRS has considered every commercial activity undertaken by a state or local government to be an essential public service and therefore not subject to taxation. Taxing a public entity would raise legal issues with regard to intergovernmental tax immunity. At the moment, the tax law treats nonprofit and public enterprises very differently. Therefore, a state institution of higher education operating a sports program classified as a commercial enterprise would be subject to the UBIT under that approach, but a state operating the identical sports program as a state entity not affiliated with its public university would not.
Reclassify Certain Types of Income
Instead of attempting to classify all net income from athletic programs as commercial and subject to the UBIT, the Congress could consider reclassifying certain types of income typically earned by those programs as unrelated income. For example, an athletic program earns royalty income when it receives a payment in exchange for allowing a for-profit enterprise to use its name. Current law excludes all royalty income from the UBIT because such income is considered passive. In general, passive income, which also includes income from investments, is not considered commercial because it is not derived from direct competition with commercial enterprises.
Some types of royalty income may reasonably be considered more commercial than others. The royalty income derived from the ownership of mineral and oil rights is usually a clear example of passive income; universities own the land to which such rights are attached but have little or no involvement in the ongoing commercial activity that occurs. In contrast, when colleges and universities license team names, mottoes, and other trademarks to for-profit businesses that supply apparel, accessories, and credit cards to the general public, they approve each product and use of their symbols and, in some cases, exchange information, such as donor lists, with the licensees to aid in their marketing. In 2005, the collegiate sector earned $203 million in that type of licensing revenue.26 The manufacture or sale of such items would clearly be commercial—and subject to the UBIT—if undertaken directly by the schools. Schools’ active involvement in generating licensing income could be the basis for considering such income as commercial and therefore subject to the UBIT. Even the income from mineral rights has been determined taxable if the university is substantially involved in the daily operation of such properties.
Bringing royalty income that accrues only to athletic departments under the UBIT would be problematic, however, for several reasons. First, schools could simply limit their licensing of the names and trademarks of their athletic teams and increase their licensing of the school’s name and trademarks to minimize the amount of taxable activity, although doing so would be likely to decrease sales. More important, if royalty income from licensing team names to for-profit businesses was truly considered commercial and subject to the UBIT, the same arguments would apply in full force to licensing all other university names and trademarks. A consistent policy would subject all such income to the UBIT because of its commercial nature. Such a change in policy could affect many other nonprofits in addition to colleges and universities, although the amount of all commercial activity in athletic departments relative to that undertaken by universities and other nonprofits does provide a rationale for different treatment.
Income from corporate sponsorship is also explicitly excluded from the UBIT. Generally, sponsorship income arises from corporate payments made in exchange for associating the corporate name with the nonprofit or public institution. In the context of college athletics, most major college championship games, stadiums, and arenas have a corporate sponsor whose name is included in the name of the event or facility. The IRS considered subjecting such income to the UBIT in 1991. In the Taxpayer Relief Act of 1997, however, the Congress responded by excluding “qualified sponsorship payments” from the UBIT, defining such payments as those in return for no other benefit than the acknowledgment of the sponsor. The law makes a distinction between payments in return for advertising (which includes descriptions of the sponsor’s products, locations, or other features) and payments in return for adding the sponsor’s name to an event or facility (which is not considered a substantial benefit). The NCAA estimated that corporate sponsorship payments to all athletic programs totaled $275 million in academic year 2004–2005.27
The fact that sponsors of athletic facilities and bowl games are willing to pay large sums in qualified sponsorship payments suggests that they derive some benefit from the prominent location and display of their corporate trademarks during athletic contests and national broadcasts. If the Congress decided that those benefits were essentially similar to those conferred by advertising as defined in the law, it could reclassify such payments as taxable income from an unrelated business. Such a determination would be supported not only by the commercial nature of those specific transactions but also by the commercial nature of athletic departments themselves, in contrast to other nonprofits that earn some revenue from similar sources while remaining financed primarily by noncommercial activities.
However, not all payments for naming rights at athletic facilities really are in return for a substantial benefit; the benefit to the sponsor varies considerably among schools and is of course largest for the few schools whose athletic arenas attract extremely large crowds and host widely televised events. The range of success among programs—and thus the benefit in being a sponsor—implies that a blanket determination of “substantial benefit” from all sponsorships could be unreasonable. The situation is clearer in the case of sponsors of championship games. Title sponsors of widely televised events such as bowl games clearly receive a substantial benefit from their sponsorship. If the Congress determined that such transactions are commercial, it could specifically classify sponsorship payments for those particular athletic contests as taxable income.
Even reclassifying certain types of income might fail to be effective if the policy was intended to apply only to athletic departments. Unless the treatment of such income was consistent across the entire university, strong incentives would remain to shift income taxable to the athletic department to the nontaxed portion of the university. However, reclassifying certain types of income as unrelated, and therefore taxable, would have the advantage of focusing directly on the types of revenue that are associated with the relatively few highly commercial athletic departments rather than on the majority of athletic departments that engage in little commercial activity.
Notes
1. Claudia Goldin and Lawrence F. Katz (Long Run Changes in the U.S. Wage Structure: Narrowing, Widening, Polarizing, Working Paper No. 13568 [Cambridge, Mass.: National Bureau of Economic Research, November 2007]) document a rise in the return to education in general over the past several decades and, in particular, a rise in the return to postsecondary education. David M. Cutler and Adriana Lleras-Muney (“Education and Health: Evaluating Theories and Evidence,” in Robert F. Schoeni and others, eds., Making Americans Healthier: Social and Economic Policy as Health Policy [New York: Russell Sage Foundation, 2008]) discuss the evidence for a positive relationship between education and health outcomes, with particular attention to the mechanisms through which education may be the cause of better health.
2. Eric Hanushek and Ludgar Woessmann (Do Better Schools Lead to More Growth? Cognitive Skills, Economic Outcomes, and Causation, Working Paper No. 14633 [Cambridge, Mass.: National Bureau of Economic Research, January 2009]) find empirical evidence of a causal relationship between educational attainment and economic growth rates across countries. For a discussion of the relationship between postsecondary education and social mobility, see Robert Haveman and Timothy Smeeding, “The Role of Higher Education in Social Mobility,” Future of Children, vol. 16, no. 2 (2006), pp. 125–150.
3. Because the corporate income tax limits the deduction that corporate donors can take for their charitable donations, a commercial entity whose income accrues directly to a nonprofit parent would, in the absence of the UBIT, pay lower taxes than a business that simply donated all of its profits to a nonprofit organization.
4. A previous Congressional Budget Office report, Taxing the Untaxed Business Sector, Background Paper (July 2005), discussed how those institutions are similar to for-profit businesses in important ways.
5. The NCAA has recently replaced the names IA, IAA, and IAAA with Football Bowl Subdivision, Football Championship Subdivision, and Division I Non-football, respectively. This paper uses the older terminology for brevity.
6. Very little information is available regarding the budgets of athletic departments at nonprofit private schools. Those schools and their athletic departments receive the same preferential tax treatment as public schools. The current lack of publicly available information about their programs makes a similar evaluation of their commercialization impossible and could be one justification for mandating additional disclosure of budget information from institutions registered as nonprofits.
7. Susan G. Broyles, IPEDS Glossary (Department of Education, National Center for Education Statistics, rev. August 1995), http://nces.ed.gov/pubs95/95822.pdf, p. 28.
8. When hospitals are included in the calculation, the commercial share of revenue is 9.5 percent with contributions considered noncommercial and 12.6 percent with contributions considered commercial.
9. In adjusting the universities’ revenue to exclude revenue from athletic departments, CBO assumed that the schools that did not respond to the FOIA request were similar to those that did. CBO made the adjustment using averages from the Indianapolis Star data. For example, the calculation for all university revenue excluding athletics was made by subtracting the average revenue of athletic departments in the Star data, multiplied by the number of schools (101), from the total university revenue given in IPEDS. CBO used a similar process to calculate university revenue excluding athletics for contributions and auxiliary enterprises, using the Star data averages for contributions to athletic departments and commercial revenue from athletic departments, respectively.
10. Including hospitals, universities derive about 7 percent of revenue from commercial sources when contributions are considered noncommercial and 10 percent of revenue from commercial sources when contributions are considered commercial.
11. The majority of income is, of course, reinvested directly into the athletic programs—for example, into compensation for coaches and administrators. Because the athletes retain amateur status, there are strict limits on their compensation, and they are barred from receiving benefits that are proportional to the income that they earn for the university. Robert W. Brown and R. Todd Jewell (“Measuring Marginal Revenue Product in College Athletics: Updated Estimates,” in John Fizel and Rodney Fort, eds., Economics of College Sports [Westport, Conn.: Praeger, 2004], pp. 153–162) estimate that universities earn $400,000 from each high-performing football player and over $1 million from each high-performing basketball player.
12. Robert Sandy and Peter Sloane, “Why Do U.S. Colleges Have Sports Programs?” in Fizel and Fort, eds., Economics of College Sports, pp. 87–110.
13. If class sizes are fixed, the cost of granting a scholarship to an athlete is the tuition that would have been paid by another student who cannot now be admitted, and the majority of students do not pay the listed tuition because they receive financial aid in the form of tuition discounting or grants. See Burton A. Weisbrod, Jeffrey P. Ballou, and Evelyn D. Asch, Mission and Money: Understanding the University (Cambridge, U.K.: Cambridge University Press, 2008), Chapter 5. If class sizes are not fixed, the cost of granting a scholarship to an athlete could be even less than the net tuition that would be paid by another student, because the athlete’s admission does not prevent any other applicant from being admitted.
….
15. U.S. Department of Education, Digest of Education Statistics, http://nces.ed.gov/programs/digest/d07/tables/dt07_185.asp.
16. College baseball is an exception in that it competes for players with the minor leagues; even so, the collegiate and professional baseball seasons do not overlap the majority of the time.
17. The lack of compensation for college athletes (despite the substantial revenue that they earn for the university) is one factor encouraging basketball players to forgo college and instead improve their skills in professional leagues in other countries before returning to play for a professional team in the United States. If more athletes decided to play for foreign professional leagues rather than for colleges, the result could be both a decline in the commercialization of college basketball and a decline in its value to the domestic professional league.
18. See, for example, William G. Bowen and Sarah A. Levin, Reclaiming the Game: College Sports and Educational Values (Princeton, N.J.: Princeton University Press, 2003), Chapter 6. The authors concluded that after accounting for the influence of race, field of study, individual scores on the Scholastic Aptitude Test (SAT), and the average SAT score at the institution, athletes who are recruited achieve lower class rank relative to their academic credentials than do walk-on athletes or the general student body. The effect is most pronounced among football players and rowers. Others have noted that graduation rates for football and basketball team members in Division I are considerably lower than those for nonathletes or for athletes in other sports. See Weisbrod, Ballou, and Asch, Mission and Money, p. 231.
19. Letter from Myles Brand, President of the National Collegiate Athletic Association, to the Honorable William Thomas (November 13, 2006), www.ncaa.org/wps/ncaa?ContentID=44636, p. 4.
20. For a comparison of coaches’ and university presidents’ salaries, see Weisbrod, Ballou, and Asch, Mission and Money, pp. 221 and 251–277. For a discussion of spending on tutoring programs for athletes, which the NCAA requires of all Division I schools, see Zimbalist, Unpaid Professionals, pp. 43–44.
21. Goff, “Effects of University Athletics on the University,” p. 91.
22. Total charitable donations to all sectors have remained roughly 2 percent of disposable income over time, suggesting that increased donations to higher education are offset by decreased giving to other nonprofits (Weisbrod, Ballou, and Asch, Mission and Money, p. 36).
23. For an in-depth discussion of the legal argument for applying the UBIT to college athletics under current law, see John D. Colombo, “The NCAA, Tax Exemption, and College Athletics” (University of Illinois Law Review, forthcoming; also available at http://papers.ssrn.com/abstract=1336727).
24. Joseph J. Cordes and Burton A. Weisbrod (“Differential Taxation of Nonprofits and the Commercialization of Nonprofit Revenues,” in Burton A. Weisbrod, ed., To Profit or Not To Profit [Cambridge, U.K.: Cambridge University Press, 1998]) conclude that nonprofits subject to the UBIT may shift expenses that are up to one-third of their gross profit to the taxable portion of the entity.
25. The large number of programs that currently post a loss … may suggest that those behaviors already occur; administrators and coaches may be able to extract higher salaries from those nonprofit programs because such programs have no incentive to show a profit.
26. Weisbrod, Ballou, and Asch, Mission and Money, p. 245.
27. Letter from Myles Brand to the Honorable William Thomas (November 13, 2006).
APPENDIX: RESEARCH ON CERTAIN BENEFITS OF INTERCOLLEGIATE SPORTS
Although the extent of commercialization in college sports provides one basis for evaluating athletic programs’ access to federal subsidies intended for nonprofit organizations, other factors may also play a role. For example, many supporters of university athletics argue that a successful athletic department creates benefits for colleges and universities that are then passed on to the students. Numerous studies have attempted to prove or disprove that notion.
Athletic success is generally thought to benefit schools in one of two ways: by increasing donations to the school or by increasing the pool of applicants for admission. Research on the relationship between athletics and donations has used a variety of measures of athletic success and has come to conflicting conclusions. One study, for example, found that winning percentages in the major sports did not have a significant effect on donations.1 A larger study reached a similar conclusion regarding winning records, but the authors documented a positive relationship between giving and appearances in championship games.2 Using a panel data set of 320 institutions, a third study concluded that postseason success in football and basketball leads to increased gifts restricted for the use of the athletic department for some schools but no increase in unrestricted giving to the university.3 Another study, using detailed data from a single large university, found little relationship between teams’ general success and donations but found a significant increase in donations for some alumni when a sport in which they had participated was successful.4 Overall, those studies seem to indicate that postseason success may increase restricted donations to the athletic department by particular alumni but that the effect on total giving to the university is likely to be small.
The results of research on the relationship between athletic success and the quality of entering classes are equally inconsistent. One study documented a positive relationship between advancing in the National Collegiate Athletic Association (NCAA) basketball tournament and Scholastic Aptitude Test (SAT) scores for the entering class.5 In contrast, another study found that championships increased the number of applications but had no effect on the SAT scores or grades of entering students.6 A comprehensive study of the effects of athletic success on the quality of incoming students concluded that the percentage of games won was positively correlated with the quality of the students but that the effect was generally small and statistically insignificant; the authors also reached similar conclusions about the relationship between winning and alumni donations.7 Another paper examined a separate mechanism through which athletic success could provide benefits to public schools—increased state funding. The author found that schools with a Division IA football program receive significantly more in state funding than those without one but that an increase in the success of the program does not raise the amount of appropriations it receives.8
Although the studies reach conflicting conclusions, even in the studies that find that successful athletic programs have a positive impact on the school overall, the measured impacts are generally quite small. In addition, studies that demonstrate a positive impact for a single school or a subset of schools do not address whether success in intercollegiate athletics increases donations or student quality at all schools—or simply shifts them between schools.
Notes
1. Paul W. Grimes and George A. Chressanthis, “Alumni Contributions to Academics: The Role of Intercollegiate Sports and NCAA Sanctions,” American Journal of Economics and Sociology, vol. 53, no. 1 (1994), pp. 27–40.
2. Robert Baade and Jeffery Sundberg, “Fourth Down and Gold to Go? Assessing the Link Between Athletics and Alumni Giving,” Social Science Quarterly, vol. 77, no. 4 (1996), pp. 789–803.
3. Brad R. Humphreys and Michael Mondello, “Intercollegiate Athletic Success and Donations at NCAA Division I Institutions,” Journal of Sport Management, vol. 21, no. 2 (April 2007).
4. Jonathan Meer and Harvey S. Rosen, The Impact of Athletic Performance on Alumni Giving: An Analysis of Micro Data, Working Paper No. 13937 (Cambridge, Mass.: National Bureau of Economic Research, April 2008).
5. Franklin G. Mixon Jr., “Athletics versus Academics? Rejoining the Evidence from SAT Scores,” Education Economics, vol. 3, no. 3 (December 1995), pp. 277–283.
6. J. Douglas Toma and Michael Cross, “Intercollegiate Athletics and Student College Choice: Understanding the Impact of Championship Seasons on the Quantity and Quality of Undergraduate Applicants” (paper presented at the 21st Annual Meeting of the Association for the Study of Higher Education, Memphis, Tenn., October 30–November 2, 1996).
7. Robert E. Litan, Jonathan M. Orszag, and Peter R. Orszag, The Empirical Effects of Collegiate Athletics: An Interim Report (prepared by Sebago Associates for the National Collegiate Athletic Association, August 2003), www.ncaa.org/databases/baselineStudy/baseline.pdf.
8. Brad R. Humphreys, “The Relationship Between Big-Time College Football and State Appropriations for Higher Education,” International Journal of Sport Finance, vol. 1, no. 2 (May 2006).
1. What are the main causes of the annual deficits that most athletic departments face each year?
2. Are the NCAA deficit numbers actually accurate? Why or why not? How could one get an accurate figure?
3. What specific adjustments must be made in order for one to arrive at an accurate assessment of the amount a university makes or loses each year on its athletic programs? Explain each of these adjustments.
4. What are some of the positive effects that large football programs and men’s basketball programs have on the publicity of an institution? Is there evidence of this? If so, what is it?
5. Does athletic success have an effect on student interest in an institution?
6. What led to the attempt by institutions to control expenditures rather than to distribute revenues? Was it successful? How so, or how not?
7. How does treating an athletic department as an auxiliary activity affect an institution?
8. How is the financial situation at Michigan likely to be different than at other Big Ten institutions? How about at Division I-A institutions not affiliated with the BCS?
9. What impact does a lack of athletic success have on institutional fundraising? If a member institution goes from being a losing athletic program to an intercollegiate power will that cause a positive shift in fundraising?
10. Are athletic department leaders such as directors and head coaches overpaid? How about relative to professors and other academics? What is the basis for your opinions?
11. What are the key factors an academic institution should use in determining if reclassification is appropriate for them?
12. How does the opportunity for individual member institution to achieve financial success under the NCAA governance system differ from the opportunities NFL teams have in their governance system?