CHAPTER EIGHT
INTRODUCTION
In most industries, a revenue stream periodically appears that ultimately leads to a fundamental change in the way that the industry conducts its business. The sports industry is no exception. Revenue sources for sports franchises have evolved over time, with owners continuously searching for new ways to profit from their investments. In sports, the sea change was fueled by television. Sports teams found that they were able to generate significant amounts of revenue from the sale of the rights to televise their games to broadcasters. Broadcasters found that sports could attract an audience with significant buying power that was otherwise hard to reach in large numbers because of its inconsistent viewing habits—young male viewers in their 20s and 30s. This demographically strong audience was quite attractive to companies searching for an effective medium through which they could advertise their products to their intended buyers. With this demographic in place, broadcasters were able to sell advertising spots on sports programs for a higher rate than on other programs. Thus was born the symbiotic relationship between sports, television, and advertisers that endures to this day. Although the relationships among these stakeholders have become increasingly complex with the passage of time and the introduction of both new broadcasting mediums and methods of distribution, today nearly all sports’ business models include television as a main financial driver. Whether a single pay-per-view event or a multiyear broadcasting contract, few structural decisions are made without first considering the impact on broadcast revenues.
However, this was not always the case. When television emerged as a role player in sports in the 1950s, the initial concern was the negative impact broadcasting an event would have on live attendance at the gate. The logic of the owners of the day made sense. Why would fans pay to see a game in person when television would allow them to see the game for free? Those concerns were short-lived, because the experiment with television proved to be both a financial engine and a fan-base builder. Rather than causing declines in attendance, television led to the creation of new fans who ultimately attended the games. In the 1960s, television started to become the financial engine that it is today. Many of the early concerns about the effect of television on gate attendance were addressed by establishing home game local broadcast and blackout rules. With the evolution of cable, satellite, pay-per-view, and the Internet, the effect of television on the local gate has become even less of a concern to many teams. However, there is a growing concern that the home viewing experience has become so comfortable and robust that fans will increasingly choose to watch games from the convenience of their own living rooms on large flat-screen televisions rather than attend games.
Broadcasting of league games occurs at both the national and regional levels. All sports leagues collectively pool and sell their television rights on a league-wide level, with the resulting rights fee divided equally among all of the teams. These national television contracts are considered to be essential for the long-term success of a sports league, because they provide the league with the broad exposure that is necessary to build spectator interest in the sport as well as the revenues that are required for survival.
Traditionally, national television contracts have been executed with networks that are available on free television nationwide. Until the 1990s, there were only three bona fide networks in the United States; today there are five: ABC, CBS, NBC, Fox, and the relative newcomer CW. In addition to the free networks, approximately 85% of U.S. homes currently pay a monthly fee to subscribe to cable or satellite television. Technological innovations have led to the creation of hundreds of channels that are broadcast on cable television. Beginning with the advent of ESPN in 1979, a number of these cable channels broadcast sports programming, because of its aforementioned appeal. In 2009, approximately 43,700 hours of sports programming was broadcast in the United States.
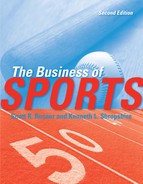
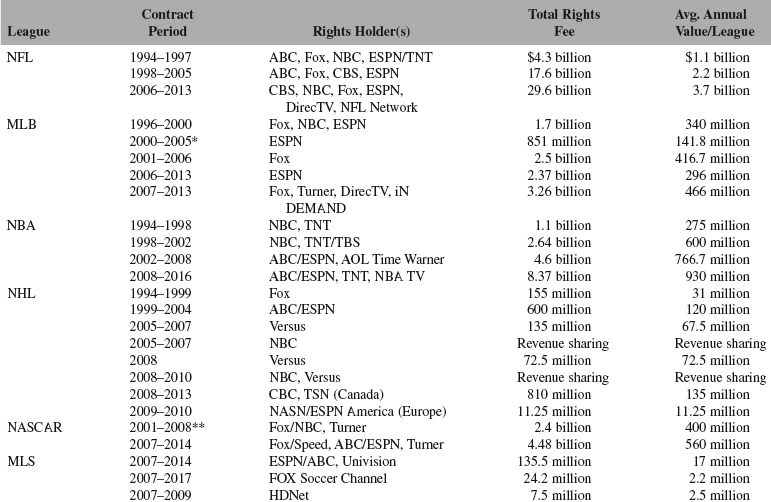
Skyrocketing rights fees have increased the threshold requirement for profitability for the networks. (See Table 1 for recent television rights deals for the major North American sports leagues and Table 2 for information on the NFL’s television rights fees from 1962–2013.) The networks need to increase their advertising revenues in order to recoup this increased investment. Because advertising rates are based on program ratings, the networks had hoped that increased ratings would lead to increased advertising dollars. However, the days of ratings increases for networks are all but over. Prime time ratings for CBS, ABC, NBC, and Fox fell a combined 29% from 1996–1997 to 2006–2007, from a combined 37 ratings points to 26.4. This drop in ratings is likely attributable to the technological innovations that have led to the development and ubiquity of the Internet and digital cable, both of which compete with broadcast networks for the individual’s attention. People—especially younger demographics—are spending more time online and less time watching television than in the past.
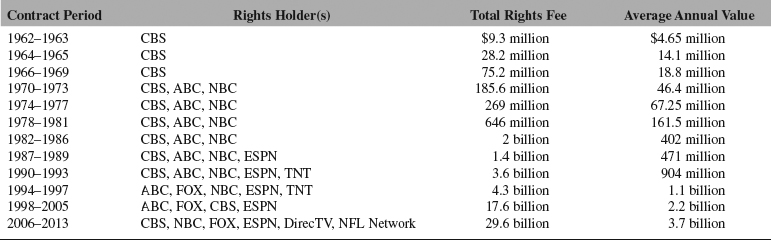
The advent of digital cable has led to a proliferation of cable networks serving a variety of general and sports-related programming niches (see Tables 3 and 4). There seems to be a channel for every interest. This proliferation of programming outlets has led to fragmentation of the viewing audience. All is not lost for sports programming, however. Fragmentation has led to the increased importance of coveted demographic groups who no longer watch any one type of programming in the same numbers as in the past—specifically the 18- to 34-year-old males that sports programming attracts.
Sports ratings vary based on the teams or athletes involved, the existence of any compelling storylines, the presence of certain superstar athletes, the broadcast window in which the game is shown, the programming that airs immediately before and after an event, and the competitiveness of the event. Consider the following sporting events that occurred in 2008 (see also Table 5):
Table 1 Recent Television Rights Deals
*Terms of the deal replaced the terms of the previous MLB deal for ESPN for the 2000 season.
**Represents a 6-year, $2.4 billion deal, plus 2 additional years for Fox. Under the terms of NASCAR’s previous television contract, individual tracks made their own TV deals and Winston Cup races were spread across CBS, ABC, ESPN, TNN, TBS, and NBC for about $100 million in total rights fees paid.
Sources: Street & Smith’s SportsBusiness Journal research, Gould Media, NFLPA.
Table 2 NFL National Television Rights Fees, 1962–2013
Source: Data on file from authors.
• The most-watched Super Bowl ever was an incredibly close game between the large-market New York Giants and the New England Patriots, a team attempting to complete a perfect season.
• The most-watched cable broadcast ever was a Monday Night Football divisional rivalry game between the very popular Dallas Cowboys and the large-market Philadelphia Eagles.
• The most-watched cable golf event ever was a Monday afternoon playoff in the U.S. Open involving Tiger Woods, the transcendent athlete of his generation, competing with a severely injured knee against a journeyman golfer, Rocco Mediate, who was easy to identify with.
• The most-watched Wimbledon final in 8 years featured an amazing five-set match between the world’s two best players, Roger Federer and Rafael Nadal. Some have called it the greatest tennis match of all time.
• The most-watched NBA and NHL Finals in 5 years included a matchup between two historic rivals and leading brands, the Los Angeles Lakers and Boston Celtics, and the latter a matchup of a historically strong franchise and a team featuring young stars.
Ratings for televised sports are relatively strong in comparison to general entertainment programming. In addition, sports programming is considered to be advertising-friendly because it is “DVR proof”; that is, it is still primarily consumed in real time, unlike other programming that is increasingly being recorded and watched at a later time, with the viewer presumably skipping through the commercials instead of watching them.
Nonetheless, networks have lost significant amounts of money on their sports programming due to the enormous rights fees that they have paid and their inability to recoup their investment through advertising sales. Morgan Stanley estimated that total losses from sports broadcasting from 2000–2006 were over $6.6 billion.1 Despite this, the networks are still interested in sports programming because of the ancillary benefits that it provides, namely, the promotional opportunities that it offers to its other, non-sports shows, and the larger branding opportunity. Leslie Moonves, the president of CBS Television, stated, “Broadcast networks must look at sports as a piece of a much larger puzzle and not focus on the specific profits and losses of sports divisions. You can’t remove sports from the other parts of the networks. If you did, it would look as bad as some others make it out to be.”2 Though the evidence of such benefits appears to be anecdotal in nature, it is driving many network decisions. The promotion of a network’s prime-time lineup during its sports programming exposes this programming to an audience that would not otherwise be as likely to be aware of it. If this increased awareness leads some of the sports audience to watch these other offerings, then the network could see a ratings increase in its other programming and allow it to reap additional advertising revenues as a result. In this way, sports could be seen as an overall ratings driver for the network. In addition, the network’s ability to promote its other programming during its sports lineup allows the network to save on the promotional budgets for this programming, because it can reduce the amount of money it spends on promoting these shows in other mediums. For example, NBC received 5 minutes of promotional opportunities during its Super Bowl broadcast in 2009. At the listed advertising rate of $3 million per 30 seconds, NBC received $30 million of free promotions for its prime-time lineup during the game. In theory, then, this allowed the network to spend considerably less in its promotion of these shows via other mediums. (See Figure 1 for a list of advertising costs for the Super Bowl.)
Table 3 Types of Sports-Related Cable Networks
Category | Networks |
General with sports programming | TNT, TBS, etc. |
General sports networks | ESPN, ESPN2, ESPN Classic, ESPN News, Versus, etc. |
Sport-specific networks | Golf Channel, Tennis Channel, Fuse, ESPN U, CBS College Sports Network (CTV), Fox Soccer Channel, etc. |
Media-owned regional sports networks (RSNs) | Fox Regional Cable Sports Nets, Comcast SportsNet (Philadelphia, Chicago, Baltimore-Washington D.C., Sacramento, etc.), Cox Channel 4 (San Diego), etc. |
Team-owned RSNs | NESN, YES, SNY, etc. |
League-owned networks | NBA TV (1999), NFL Network (2003), The MTN. (2006), Big Ten (2007), NHL Network (2007), MLB Network (2009) |
Source: Data on file from authors
Table 4 Top Cable Network Universes (12/09) (# Households)
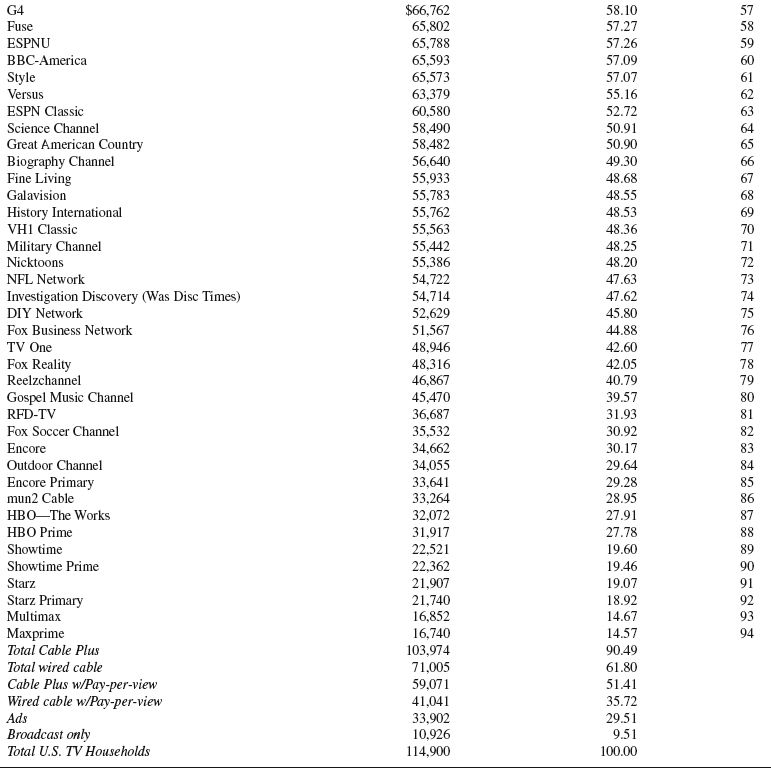
Source: The Nielsen Company. Copyrighted information of The Nielsen Company, licensed for use herein.
Table 5 2008 Top Rated TV Sports Events
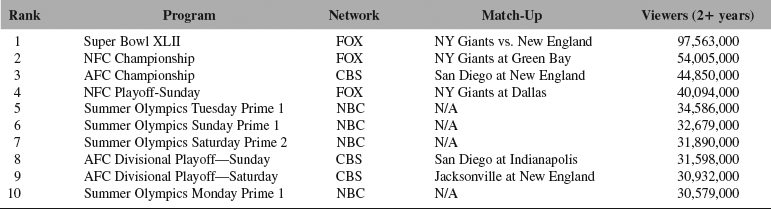
Source: The Nielsen Company. Used with permission.
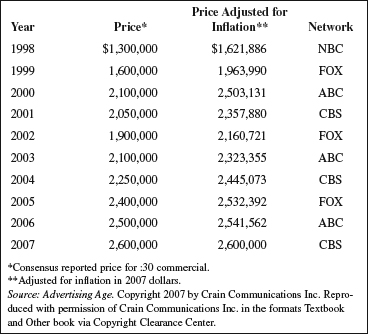
Figure 1 Super Bowl Ad Rates
To a certain degree, networks are willing to view sports programming as a loss leader, because the programming also offers them significant branding opportunities. Fox established itself as a legitimate network when it acquired the broadcasting rights to the NFL and NHL in 1994. The network was able to use its acquisitions to add a number of affiliates in NFL markets that previously had balked at the opportunity to associate themselves with the fledgling network. With the leagues in tow, Fox had instant credibility. Recently, NBC has focused its efforts on key programming, such as the Summer and Winter Olympics and NFL football on Sunday evenings, and then entered into more conservative deals for Notre Dame football and an array of niche sports.
It is likely that each broadcast network will consider certain sports properties to be cornerstones of its programming lineup. They will continue to be willing to pay dramatic rights fee increases in order to retain these “tent pole” properties. However, for other sports properties, the network will take a more conservative approach and only pay rights fees that make financial sense. For example, in addition to the aforementioned approach by NBC, CBS will continue to focus its efforts on four properties—the NCAA men’s basketball tournament, SEC football, NFL football and the Masters.
Cable television is likely to increasingly dominate the national broadcasting agreements entered into by major sports properties. As leagues seek out rights fee increases, cable television networks are most able to bear the additional costs of doing so. This is a function of a cable network’s revenue model. Major cable system operators, such as Comcast, Time Warner, Cox, Charter, and Cablevision, and satellite operators, such as DirecTV and Dish Network, pay monthly per-subscriber carriage fees to cable networks for the right to distribute their channels to their customers. Thus, whereas broadcast networks receive revenues primarily from advertising, cable television networks have dual revenue streams—advertising revenue and negotiated subscriber fees. This dual-revenue stream will enable cable networks to better afford the high cost of sports programming.
In order to afford the ever-increasing rights fees sought by sports properties, sports programmers are constantly attempting to increase the subscriber fees that it receives from the cable system operator. Although typically the most expensive programming for cable system operators, sports programming is important for them because of subscriber demand for the programming and the need to differentiate themselves from their competitors, including direct-satellite subscription providers such as DirecTV. Sports programming, especially the regional sports networks that carry the majority of the home teams’ games, is must-have content for cable system operators, a fact well-known to both the cable networks and the cable system operators. Tables 6 and 7 provide monthly fees per subscriber for sports and nonsports networks, respectively.
Some cable system operators have negotiated fiercely with cable networks over proposed increases in subscriber fees. They feel that the cable networks must absorb some of the increase rather than pass all of it along to the cable system operator’s subscribers, many of whom have no interest in sports and do not want to pay higher cable bills in order to pay for the networks that carry this programming. This has led some cable systems to attempt to place many national and regional sports networks on a pay-tier where subscribers have to pay an additional monthly sum for access to the network instead of on an expanded basic cable package, where all subscribers have access to the channel. However, the sports-tier strategy has seen limited success and is unlikely to endure, especially for established national cable networks such as ESPN and TNT and more popular niche networks
Table 6 Monthly Cable Sports Networks Subscriber Fees (January 2009)
Network | Monthly Fees per Subscriber |
ESPN | $3.65 |
YES | 2.15 |
Comcast Philadelphia | 1.97 |
Comcast Mid-Atlantic | 1.95 |
NESN | 1.95 |
FOX Sports West | 1.93 |
Comcast Chicago | 1.90 |
FOX Sports Florida | 1.90 |
MSG | 1.85 |
FOX Sports New York | 1.80 |
SportsNet N.Y. | 1.80 |
FOX Sports North | 1.67 |
Big Ten Network | 1.10 |
NFL Network | 0.83 |
ESPN2 | 0.52 |
NBA TV | 0.35 |
MLB Network | 0.35 |
Versus | 0.27 |
Golf Channel | 0.25 |
NHL Network | 0.21 |
Speed | 0.19 |
ESPN Classic | 0.17 |
Source: Media Daily News and authors.
Table 7 Monthly Cable Major Nonsports Network Subscriber Fees (January 2009)
Network | Monthly Fees per Subscriber |
TNT | $0.93 |
USA | 0.52 |
CNN | 0.47 |
TBS | 0.46 |
Nickelodeon | 0.45 |
FOX News Channel | 0.42 |
FX | 0.37 |
MTV | 0.32 |
CNBC | 0.27 |
Discovery Channel | 0.26 |
Lifetime Television | 0.25 |
A&E | 0.25 |
AMC | 0.23 |
History Channel | 0.21 |
MSNBC | 0.15 |
VH1 | 0.14 |
The Weather Channel | 0.11 |
Source: Wayne Friedman, “Cable Sports Nets Pay More To Play,” February 27, 2009, Media Daily News.
Despite a difference in penetration between network and cable television of approximately 15% (representing 20 million households) as of January 2009,3 the line between the two broadcasting universes is becoming increasingly blurred. Popular cable programming garners ratings that are competitive with network shows. Cross-ownership of network and cable broadcasters, such as Disney’s ownership and shared production of ABC and ESPN and News Corporation’s ownership of Fox and Fox Sports Net, has made the distinction between cable and network even less important. Thus, cable is likely to be the new national rights model for sports programming. This is evidenced by ESPN landing the exclusive rights to the British Open beginning in 2010 and the entire slate of Bowl Championship Series games beginning in 2011, as well as CBS and Turner jointly sharing the NCAA men’s basketball tournament from 2011–2024.
Unless they see a significant increase in the amount of the retransmission fees that the broadcast networks receive from cable companies (which are analogous to the aforementioned subscriber fees), it is also fair to consider whether the broadcast network model will be able continue to compete against the cable model in landing sports properties. This raises a significant transitional issue confronting sports leagues today, as they consider whether they should move away from the original network model and to what degree. The NBA led the way in this thinking by entering into a 6-year, $4.6 billion deal with ESPN, TNT, and ABC in 2002, and continued with its current 8-year, $7.4 billion deal with the same partners. Most analysts have concluded that it is still too early to tell whether this route is more beneficial to the relevant stakeholders than the league’s single-network model, but a few differences are clear. Although there are fewer viewers, there is an opportunity for the sports property to receive an increase in its rights fees. The NBA is earning more money over the length of these agreements than in its previous broadcasting contracts with NBC and TNT, but these cable outlets only reach 85% of the households that network television reaches. The remaining 15% is problematic, in that people living in these households are unable to watch most of the league’s programming.
In addition to the league-wide national agreements in place with network and cable broadcasters and the emergence of league-owned networks in the major North American professional leagues, sports franchises in the NBA, NHL, and MLB have individual deals in place with broadcasters in their home territories. These deals can be quite important, because the vast majority of each team’s games are broadcast on this basis. (Note that in the NFL the rights to all regular and postseason games are controlled by the national broadcast partners, with only preseason games shown on a local basis.) The value of the local broadcasting agreement varies according to a number of factors, the most important being the size of the team’s market and the team’s popularity within this market. Prior to the advent of cable television, most of the local broadcasting agreements were with independent, over-the-air stations that had limited geographic reach. Cable television created the opportunity for teams to expand their presence on a more regional basis.
The aforementioned proliferation of cable networks included a number of distinct regional sports networks (RSNs) whose programming was built around the home teams. Ultimately, there was a consolidation of many of these RSNs, and Fox Sports Net emerged as the dominant player in the marketplace with its ownership of 19 RSNs nationwide and an affiliation with 5 others. The majority of NBA, NHL, and MLB teams are broadcast partners with Fox Sports Net. Comcast has emerged as another major participant in RSNs, with a hand in 11 of the networks across the country. The ratings for sports programming on RSNs are still strong, reflecting fans’ continued interest in their home teams. RSNs capitalize on the much greater appetite that local fans have for their teams than a national audience would have. Recognizing an opportunity to exploit its revenue potential, cable system operators, media companies, individual teams, and leagues have started their own RSNs. In addition, a number of niche channels focusing on a single sport such as soccer, tennis, golf, action sports, auto racing, skiing, and nonrevenue college sports have been launched.
While the programming content on the RSN must be attractive to viewers, the distribution of the RSN to a large number of subscribers at an appropriate monthly subscriber fee is a key to its success. Enough people must have access to the channel for the advertising rates and subscription fees to sustain the RSN. Thus, it is vital for the RSN to be carried by a large number of cable systems in the local market. Without sufficient carriage, the RSN will fail. In addition, the RSN must have sufficient financing to support the substantial startup costs and initial operating losses, as well as an experienced management team that has the ability to negotiate the aforementioned affiliate agreements and rights fee deals.
The RSN concept is still evolving, and thus far has been met with varying degrees of success across the country. It clearly has not been the answer for every team. The Portland Trail Blazers, Charlotte Bobcats, and Minnesota Twins all unsuccessfully attempted to launch a RSN. Notably, Trail Blazers owner and Microsoft cofounder Paul Allen’s Action Sports Network lost a reported $25 million when the RSN failed after it could not get sufficient distribution in the Pacific Northwest. Then-Charlotte Bobcats owner and BET founder Bob Johnson’s Carolina Sports Entertainment Television (C-SET) shuttered after only one season, because its distribution deals left most of the team’s home market without the network. These failures embody the significant risk that teams face when attempting to launch an RSN. Although the potential payoff to sports teams that own their own RSN is huge, it is very difficult to successfully launch an RSN. Carriage and distribution are difficult obstacles to overcome, especially for sports teams that are newcomers to this aspect of the television business. Even Disney was unsuccessful in its attempt to launch ESPNWest, a proposed RSN that would have carried the games of both the Disney-owned Anaheim Angels and Mighty Ducks. This should send a cautionary note to any team attempting to launch its own RSN. It may be that the team is better off using the possibility of starting its own RSN as leverage in negotiating new rights fees deals with the already existing local RSN.
The discussion of media now transcends television and must include the multiplatform world of broadcast, cable, broadband, mobile, online, and print outlets. In October 2008 alone, 75 million people visited sports Web sites. (See Table 8 for the top five U.S. sports Web sites.) Similar to what has transpired with the advent of “disruptive” technologies such as radio, over-the-air television, and cable and satellite television in previous eras, the creation and continued expansion of the digital world has provided the sports industry with a vibrant revenue opportunity. Sports programming is highly valuable content in the digital world as well, as sports fans clamor for more information and interaction with their favorite athletes, teams and leagues. Internet use continues to increase; according to U.S. Census data from 2007, over 60% of U.S. households have broadband access. Mobile phones are nearing ubiquity—nearly 85% of U.S. households have them, and a growing number of people are living in wireless-only homes.
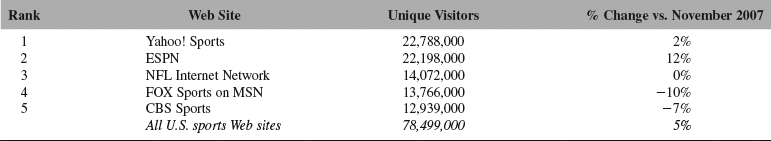
Source: The Nielsen Company. Used with permission.
Although the business model continues to evolve, sports properties have thus far monetized the digital world via two somewhat distinct strategies: a subscription-based model where individuals pay a fee to view the content and an advertising-supported model where the viewership is free and advertising is sold on the site. Although each strategy has its advocates, it is likely that content that appeals to a smaller but dedicated core audience is better suited for a subscription-based model; the advertising dollars that the content can generate is relatively small due to the limited number of unique visitors to the site, but the fan base’s loyalty is high enough that it will be willing to pay to view the content. An example of this is the ATP World Tour and Sony Ericsson WTA Tour’s streaming of 37 of its 2009 tournaments via TennisTV.com, the official video Web site of each tour. Individuals could subscribe to a variety of packages ranging in price from $130 for annual access to $20 for a single tournament. At the league level, the NBA, NHL, and MLB offer their subscription-based out-of-market packages via broadband as well as on television.
An advertising-supported model works best for content that is attractive to a mass audience; here the audience size is large enough to command significant advertising fees. The most successful example of this model to-date has been CBSSports.com’s March Madness on Demand (MMOD) product, the online streaming video of the NCAA Division I Men’s basketball tournament. MMOD operated on a subscription basis, costing an average of $15 from its launch in 2003 through 2005, when approximately 20,000 users bought it. It converted to a free, advertising-supported model in 2006, and over 1.3 million viewed it; this model endures and the product has seen tremendous growth. The 63-game event drew over 7.5 million unique visitors to the MMOD video player in 2009 (58% higher than in 2008), with 8.6 million total hours watched (a 75% increase from 2008).4 In 2009, CBSSports.com generated over $30 million in advertising revenues from MMOD. Other examples of successful live-streaming on a free, ad-supported basis include CBSSports.com’s showing of the 2008 U.S. Open men’s tennis final between Roger Federer and Andy Murray, which reached 300,000 unique visitors who watched a combined 243,000 hours (an average of 49 minutes per user), and NBCOlympics.com’s live-streaming of 2,000 hours during the 2008 Beijing Olympics. Although the technology exists to allow teams to stream their games live in their home territories, in-market streaming has a number of operational and financial obstacles that must be overcome. However, the revenue potential of in-market streaming to mobile devices makes it inevitable; there is simply too much money to be made for a reasonable solution not to appear.
In 2009, MLBAM, the digital arm of MLB and a long-time leader in the digital space, began offering a mobile version of its MLB.TV Premium subscription-based outof-market broadband video package to subscribers of its $9.99 MLB.com at Bat application on the iPhone and iPod Touch. It is likely that the other leagues will follow in due course, giving fans near-constant access to their favorite sports, teams, and athletes. Today’s blogs, message boards, and social networking applications enable sports properties to deepen their relationship with their fans. Tomorrow’s technologies will allow for even more of the same. Although exactly how sports and digital media will intersect going forward is unknown, the passion and loyalty of sports fans and their seemingly insatiable appetite for content related to the object of these desires should allow the industry to monetize this opportunity.
In the first article, “Panel I: The Future of Sports Television,” a panel of sports experts discuss the future of sports television in a wide-ranging conversation, providing a good starting point for the analysis that follows. In the second selection, John Fortunato examines the business of one league’s television programming—the highly rated NFL. Although ratings for NHL programming are low in the United States, hockey games are quite popular among Canadian television viewers, a topic that is examined by O’Reilly and Rahinel in the third selection. In the fourth selection, Diana Moss details the business of RSNs.
Sports properties have exerted considerable efforts to find other revenue streams beyond television. The “new media” certainly encompasses analog and digital cable, satellite, high definition television (HDTV), and other broadcast vehicles. The largest focus in this new media realm, however, has been the Internet. There is not a sector in the sports business that has not dabbled in some way in cyberspace seeking to find a way to add the Internet to its business model. Thus, the chapter concludes with predictions about the future of sports media in an article by Rein, Kotler and Shields.
Notes
1. Andy Bernstein, “Moonves: Sports Worth More Than Money,” The Sports Business Journal, March 17, 2003.
2. Alan Miles, “Digital TV Transition: 2009,” Barclays Capital Equity Research, December 12, 2008.
3. Richard K. Miller and Associates, “Sports Television Broadcasting,” The 2006 Sports Business Marketing Research Yearbook, July 2005.
4. “Final 2009 NCAA March Madness On Demand Traffic Figures Show All-Time Record,” April 10, 2009. Available at: http://www.reuters.com/article/pressRelease/idUS92989+10-Apr-2009+PRN20090410.
OVERVIEW
PANEL I: THE FUTURE OF SPORTS TELEVISION
Ronald A. Cass, Mark Abbott, Irwin Kishner, Brad Ruskin, and Alan Vickery
MR. ABBOTT: … I wanted to speak this morning a little bit about the impact that new technologies have had on the television business for sports…. Most of what I will talk about are things that I have had direct experience with in the last twelve months….
To de-glamorize sports, which has to be done sometimes, it’s about the basic allocation of rights. When you take a look at what we as lawyers in the sports business do, it is often refereeing the fights over how those rights have been allocated. Whether it’s an issue between a league and a team over an allocation of a right or between various broadcast partners, a lot of what we have to do is think through how we want to allocate those rights which we have to maximize the overall value for our sports league. We’ll talk about that in a moment.
But I wanted to talk, first, about the impact that several new technologies have had on the sports business. I think everybody is generally aware… of the great move away from the three broadcast networks to cable and to satellite television and all that that entails.3
I think there are really four trends that I’ve seen, and that we’ve all seen in the last couple of years, that have really come to the forefront and dramatically changed the business, more so than the previous twenty years had done so.
The first is the growth of digital television. Digital television (“DTV”), if you’re not familiar, is the digital transmission rather than through analog. This is done through either a satellite, like DirecTV or Dish Network, or now digital cable which is starting to roll out across the country.4
There is no more room for analog channels…. The bandwidth is already used up.5 And so any new channels that you see are digital. That means they can only be broadcast over satellite or broadcast in an area that has digital cable.
This has presented a great opportunity but also a limitation. The new niche channels that you see rising up that people are talking about—NBA TV,6 or the National Football League (“NFL”) … channel7—they rely upon the rollout of this digital platform.
It has gone a little bit slower than people had anticipated that it might go. It really relies upon cable systems adopting the digital platform for its distribution in order to get your channel distribution.8 So a lot of these channels have an opportunity to be distributed because there is now bandwidth….
That presents a lot of opportunities for sports leagues. We see it really in two ways that I think have already been alluded to. The first is the single-sports channels which have come up. The second is something which is very popular—what are called out-of-market packages.9 We have one called MLS Shootout. NFL Sunday Ticket and Major League Baseball Extra Innings are the types of packages that we are talking about,10 which have become very popular as a result of satellite.
It’s a way for a league and teams to more directly connect with its fans all throughout the country, because no longer do you need to have just a national broadcast to reach everybody. If somebody is willing to pay the fees, which are relatively modest actually, to get one of these packages, you can have access to all the games from all the local markets. That is quite a lot of benefit to the fans and it is a great opportunity for professional sports leagues.
The second trend that is really starting to hit right now is high-definition television (“HD” or “HDTV”).11 There has been a lot of talk about high-definition television over the last few years and there has been a lot of talk about the requirements of broadcasters to broadcast in high-definition, but it is really starting to break out now.12 That is driven by a few things.
One is the development of more content being broadcast in high-definition, which is causing more people to buy high-definition television. High-definition televisions are coming down lower in price.
….
The third trend in technology that is impacting all of television but is a benefit for sports is TiVo and digital video recorders.16 I think you’re probably all familiar with what TiVo is. Basically it’s a hard drive that allows you to simply record things off of television. It’s much easier to use than a VCR. It’s much higher quality. It allows you to very quickly fast-forward through commercials.17
….
People in the sports business tend to think that of all broadcast properties, sports is among the most TiVo-proof, and that is because you incorporate with more frequency now broadcast sponsorship and commercial elements within the game itself. So, the classic example is on the sidelines of an NFL game you will see the Gatorade container or the Motorola headset. That is not just there because the team chose they like Motorola. It is there because Motorola paid millions and millions of dollars for that to get that exposure.20 And you cannot TiVo through that. It is on. When they shoot the coach, you are not TiVo’ing through that. And so TiVo presents sports a really unique opportunity to offer advertisers a way to reach fans that they cannot avoid. I think that is a very important trend and very important for the value of sports broadcast rights going forward.
The fourth trend, which has been going on for a long time—in fact, it had both a boom and bust in the last five years—is obviously new media, and that’s the Internet.
….
No one doubts that the Internet is a transformational medium. I saw a very interesting article the other day that compared it to the airline industry, the point of which was that both the airline industry and the Internet have done more to transform the economy than any other industries. That is, by virtue of being able to fly around the country, it has grown our economy, and the Internet allows communication to happen much quicker and access information much quicker. And so it has transformed the economy in very profound ways, yet you cannot make money at either of them.
I think that is one of the debates that is going on in the Internet. There are those who come to speak to sports professionals and say that the economic model is no different than that of the public library; it is just an information access device. I think most people in the sports business vehemently disagree with that and feel that the Internet is a way to more closely connect your product with the fan. It is all about providing the fan access to information that they want in a way that they want to receive it, and people are starting to find ways to monetize that.
When there was a lot of crazy money and it reached a fever pitch, just as the NASDAQ reached a fever pitch in March of 2000,21 people had raised money from the public markets and the capital markets and were throwing a lot of money at sports rights because, just as sports rights had been used, for example, in Europe by satellite providers to reach homes and to get subscribers, and just as it had been used here by cable companies to get subscribers, the Internet companies were going to use sports content to get eyeballs. The problem was nobody figured out how to monetize those eyeballs once they had them.
There is now a move to subscription-based services, and you will see a lot of this coming. It has happened already, and it is going to come even more this year. People have found that a model that works reasonably well on the Internet is to offer fans—for $9.95 a month—the ability, for example, in baseball to get all the audio broadcasts of all the games nationwide, or to get a package of highlights customized for the teams that you want.22
So, I think the story is still not told entirely on where the Internet is going exactly with respect to sports, but there is no question that it is transformational and that sports leagues are all grappling with the best way to deal with it. I think that you are going to see the fan benefit from that as there are going to be more opportunities to follow your favorite team and learn more about it.
That is a brief overview of the impact that technology has. There is a lot more to say about that, but those are the trends that I think are the most currently being discussed in sports leagues and sports teams.
….
MR. KISHNER: …. Today I am going to talk about the future of sports television and the emergence of what I term the vertically integrated model, or the regional sports network as it has been called in the press in recent days.26
I am going to start off by just giving you a background of what the TV/media rights world looks like today, talk about some of the components that go into it and some of the considerations of forming and organizing a vertically integrated network, and where I see it in the future emerging and in which particular markets.
Television programming of sports events has increased tremendously, almost geometrically, from decade to decade. From 1980 to 1990 television and cable networks went from an average of approximately 4,600 hours of programming to 7,500 hours of sports broadcasting, and from 1990 to 2000 that 7,500 hours increased to over 14,000 hours of sports broadcasts.27
The big four broadcasting networks spend over a billion dollars each on sports programming annually. Gross revenues generated by professional and collegiate athletic contests amounted to a $194 billion business in 2001.28 So clearly there is a tremendous amount of money here, a tremendous amount of value here.
What the regional sports network, with a vertically integrated model, does is it takes one plus one. In other words, combining a sporting event with those broadcasting rights, thereby equaling a greater synergy, greater than one plus one.
The revenue stream from a media contract is one of the primary assets of any sports franchise. It is the means by which a team is able to put product on the field. For example—and I will get to this later—when the Texas Rangers were able to pay $25 million per year for Alex Rodriguez, or $250 million,29 the reason by which that contract was able to be generated was as a result of Tom Hicks and his creating this regional sports network which was ultimately sold to Fox Sports Net for $500 million,30 but the point being that this is a tremendous creation of value.
As an aside, while the TV contract is primarily the main generator of revenue for the team, there are other forms of media which also generate revenue, not the least of which is the radio contract. On the TV contract you are talking in the $50-million-plus area on the high side, to—well, for the Expos it was just under a million. But on the radio side you are talking, call it $8, $9, or $10 million a year potentially for the rights.31
In forming these vertically integrated models, one of the considerations that you need to take into account are the league rules, because ultimately every league has a different set of rules which you need to navigate through.32 Ultimately, these deals all need to be blessed by the league and you need to know what the discrepancies are.
Just to cull out one or two of these, there are territorial restrictions. For example, in the National Basketball Association you have the concept of an inner market where each team has by right an ability to broadcast its signal, and you have an external market which you can buy.33 Actually, by paying to the NBA money, you can broadcast your signal to what is called the outer market.34
There are differences in the leagues between a television market and a radio market. Indeed, in Major League Baseball, just to point out one of the anomalies, every TV deal has to have a provision in it which states that if the broadcast signal is put out to in excess of 200,000 households outside of your territory, then you can terminate that contract as a matter of right, if directed by the commissioner.35 So that is just one of the considerations.
Another consideration is that each league has its own national rights agreement with TV producers, TV companies, and almost always the national rights agreement will preempt the local rights agreement.36 This is one form, in my opinion, of revenue-sharing. I mean, here you have a league that is taking broadcast opportunity from the individual teams and packaging that. But that is another consideration.
Lastly, one of the major considerations, as Mark had alluded to earlier, is the effect of the Internet on all this. As of today, it still has not been a major issue, but clearly as time evolves, that is something that we are going to need to consider.
The new vertically integrated model can be said to have its basis in other derivative models. What I mean by that is there are definitely vertically integrated media companies today. For example, Cablevision owns the Knicks and the Rangers … and there are a couple of other examples.
Actually, you could trace the roots of the vertically integrated model back to CBS, with its purchase of the New York Yankees in the 1960s, although that did not work out too well for CBS at the time….
But in any event, all these models were based on existing media companies trying to find new product to put on the airwaves. The vertically integrated model is different, because here it is ownership of the sports team, either by itself or in alliance with others, creating this new company, if you will, and by doing so creating additional revenue streams as well as creating enhanced value for the company and the franchise—enhanced value, in the sense that for the franchise, because you now have a combined company which, in theory at least, will expand the universe of potential buyers for that product.
Attempts to execute this strategy have met with a fair degree of success. Sometimes it has failed, but most of the models that I have been seeing really have been fairly successful.
As I alluded to earlier, Tom Hicks, the owner of the Dallas Stars and the Texas Rangers, was planning to start a competitive sports network.42 After doing the initial leg-work, he sold the rights for that network for $500 million.43 Again, he created much more value than he would have had through the traditional means.
Paul Allen, the chairman of Charter Communications, created a regional sports network built around his team, the Portland Trail Blazers.44 Although that effort ultimately failed, in the end, I believe, he garnered more dollars for his team or for himself than he would have normally.
Also, another good example is the recent sale of the Boston Red Sox, in which an ownership group led by John Henry purchased the Red Sox for $700 million.45 The reason why that deal was so highly valued was that as part of that deal, the team’s stake in the New England Sports Network was included.46 That $700 million valuation for the sale of the Red Sox shattered the previously high sale of the Cleveland Indians, which was $323 million.47
In forming a regional sports network or this vertically integrated model, there are seven major components that everybody needs to consider before you can even begin to undertake the analysis. I just want to hit those before going into what I see as the future of this.
First off, you need year-round programming, or at least marquee programming. That marquee programming is obviously found by the sporting broadcast of the team or teams that you are going to have the rights to. Therefore, if you want year-round programming, you will need to combine baseball and basketball, or baseball and hockey.
Another component is you need filler programming: historical interest stories or human interest stories. You can accomplish this by purchasing a library of rights from others.
Another factor: you need the correct demographics. You need to have the people who can pay and a sufficient population base to support the emergence of the network.
You need the proper economics…. That turns out to be based on whether YES should be carried as a basic package product or a premium package product.48 That translates into the revenue stream that ultimately winds up into the network.
You need to have financing lined up because the startup costs here are fairly substantial, and to weather the storm through that start-up it is very advisable to have financing in place.
Solid management. You need to have a management team that is able to cut your affiliation agreements in such a way as to know what the market is, what the rights fee should be, etc.
Another very key element in the emergence of these regional sports networks (“RSNs”) or the vertically integrated model is that the existing media deal for these teams needs to be expiring or about to expire, because otherwise there are no rights which you can sell.
….
The bottom line on all this is that this model has many uses way beyond just big-market teams. Indeed, I foresee in the not-too-distant future the emergence of specialty sports networks beyond just the major four leagues. For example, NASCAR racing would be ripe for forming a network; championship wrestling; Major League Soccer—all these arenas are ripe for the emergence of this new model.
….
MR. RUSKIN: … The two themes that I want to touch upon today are: (1) the special strength and value that sports has, and will continue to have, in the television marketplace; and (2) the extent of migration of sports to various non-broadcast options.
Now, on the one hand… sports faces tremendous challenges in the marketplace today. There is certainly a level of pressure on rights fees, on what broadcasters will commit in the first instance to leagues, that I think is greater than it has been probably at any other time over the past decade. There is certainly among telecasters an increasing desire for low-cost programming. The advertising market is extremely tight, and has been tight for a period of time.
And the market is plagued by, or at least marked by, fragmentation—fragmentation meaning the ever-increasing number of broadcast outlets, of channels—which has the effect of each individual channel being less significant in the marketplace. Now, that trend has been ongoing for many years, but the trend when one looks at it today leads, across all television programming, to ratings for any type of television program that are markedly less than ratings for similar programs five year ago, certainly ten years ago or twenty years ago.
All that said, sports remain special, and they remain special in the marketplace for a number of reasons. The first really goes to the very special nature of sports. What many telecasters are looking for is destination viewing, a common term today. They want programming that viewers will want to make an appointment to see. I think NBC called it “appointment television,” the first one to coin it.56 They want programming that viewers are going to see as somehow special, necessary, and that they will actually at ten o’clock want to be in front of their television set.
Mark mentioned before that sports is viewed as either TiVo-proof or more TiVo-proof than most other forms of content. That is true. He explained one of those reasons, which is the ability to continue to provide advertiser or sponsor message during the content of the sport, be it on ice, be it through showing signage, be it through other forms that he described.57
The other reason that it is TiVo-proof, or somewhat TiVo-proof, is that people care about seeing the event live. One of the joys of sports is that you do not know what the outcome is going to be and you want to watch it when you still do not know what the outcome is going to be… But nevertheless, and for the joys of ESPN Classic,58 the fact is sports has that. Very little else does.
I would have said nothing else does. But, interestingly, I think that one of the things that now does is reality television. On the one hand, it is the telecaster’s dream because it is low-cost programming….
But it also has the element that people want to see it live. You know, when they’re in the office at the water fountain the next day…
And so reality television has some of those elements. In fact, as you can see, it has been, and is continuing to be, dominant in the television landscape, and certainly in the over-the-air broadcast landscape.60 That said, sports is still the dominant flow of content that has that special quality and that allows it to be of great interest to telecasters.
Sports also has a different element, and I think it is an element that is sort of interesting as we face a time of possible war and other things that we face in our lives. Sports creates, probably as much as anything, the ability for a shared common experience. The fact is that sports allows us to connect with people whom we do not otherwise know. I mean, how quickly when one is abroad and meets another American does your conversation somewhere along the way turn to sports as an immediate bond that you know things and your life has been touched in a similar way? I think that shared common experience, for obvious reasons, is always important but becomes ever more important.
It is also why—and I will come to this in a moment—certain big events will always remain on broadcast network, events like the Super Bowl, because those events have an ability to reach a number of people that few things do. That experience remains important, I think, as part of, the American psyche if you will.
So for all those reasons sports have a lot of very special qualities.
You can look at how important sports is, how important it is to television, through many prisms. Looking at ESPN and its growth is extremely telling.61 As a few people have mentioned, there is a great proliferation of various networks on cable television today. But if you were to ask a question to a cable operator: “You only get one, you only get to pick one network; what’s the most important network that you must have?” The answer invariably is ESPN. Not surprisingly, this is why ESPN is able to charge more per subscriber than any other national or cable network.62 But the fact is it is ESPN that stands tallest among all of the various cable networks.
….
With respect to ratings, while it is true that ratings have moved down across programming, I think it is probably also so that they have gone down less across sports programming than many other forms of programming. I think in the sports world there is a lot of wringing of the hands: “How can it be Major League Baseball used to get a sixteen and now it’s getting a four or a five?”64 You can look at it in a lot of different areas and a lot of different sports. But the fact is “All in the Family” used to get a twenty-seven;65 today the leading shows are getting approximately half that.66 It is all the way across television programming that the fragmentation has had its impact.
But sports stays strong, amid many of those decreasing effects. And, if you were to look from 1980 to 1990, it was true that for virtually every sport, there was a significant decrease in its average rating of any of its events, across regular season or across average playoffs, that was market.67 If you look over the last three or four years, it is much more of an up and down.68 There has been some flattening out there, and for many of the sports they have been increased on a year-to-year basis. It is really more sport-to-sport and the particular match-ups that they might have over the course of a period of time.
The other thing that makes sports special is technology. Mark was addressing some of the aspects of technology and some of the trends.69 But what is interesting is the extent to which sports is such a leader in the development of technology as it affects the broader viewing experience.
Again, anyone who watches sports can think among the things that you have seen that have enhanced your viewing experience… And we quickly go from being amazed by it to it being an essential part of our viewing.
It was less than ten years ago that Fox created the Fox Box, which in the upper-left-hand corner told you the score and told you how much time was left.71 It seems like such an essential element of your viewing; it’s almost annoying if it isn’t there and you tune in and you want the information. Again, a technology developed through sports.
….
You know, think about it. At what other forms of television do you see that level of technology? If you think about sitcoms or dramas, they increase in certain ways, but they do not bring technology to us in those ways to enhance the experience.
I think HDTV will do more of that. It is really a form of distribution. As Mark said, there are real questions as to where the money gets made. Other than that, it will become an essential way of viewing. And for many sports, the promise of HDTV, both because of its clearer picture and also because of the shape that it will bring you, is viewed as a wonderful promise. Hockey, for example, suffers on television because the shape of the rink is different than the shape of your television set. The ability to expand that, to be able to see a greater amount of action, and to be able to see plays forming should be wonderful to the viewing experience. And again, for all those reasons television is special and sports is special on television.
Interactivity is another area. Again, it is difficult to know all the ways in which the Internet will emerge and evolve, but what is certain is that it provides additional opportunities for information exchange, which is a part of sports that brings the fan and the viewer closer to the sport—whether or not people will be watching streaming video in their office, whether or not it is an ability for them to exchange information with people while they are watching something to call the play, try to make decisions, or create their own camera angles in the way that they want to see it….
The other thing I wanted to touch upon is the area of migration. This is a 1994 report by the Federal Communications Commission (“FCC”), a decade ago, commissioned by Congress in 1992, titled “The Inquiry into Sports Programming Migration.”75 Interestingly, as part of the 1992 Cable Act,76 Congress instructed the FCC to conduct an examination of the carriage of local, national, and regional sports programming by broadcast stations, by cable programmers, and what they described as pay-per-view services, and at that time to analyze the economic causes and the economic and social consequences of migration trends, and to submit legislative or regulatory recommendations.77
They defined sports programming migration as “the movement of sports programming from broadcast television to a subscription medium (i.e., one for which viewers pay a fee).”78 They looked at the period from 1980 through 1994. They concluded at that time, interestingly, that there had not been significant migration of sports programming from broadcast to subscription television. Now, there are a number of things that I find interesting in this.
The first thing that is interesting is the very fact that Congress would commission such a study. It really highlights the uniqueness of sports and how we look at sports in our life.
….
Sports is different in that way. The fact is that with respect to migration, there has been an evolution, not a revolution, but it shows the power of evolution, because the fact is, what was unthinkable not that long ago is now commonplace. The fact is that when one looks at the cable and satellite landscape today, it dominates the sports world. It is really only the NFL that is able to make broadcast television its primary method of distribution.79 As to each of the other major sports and as to every other sport, cable and satellite is their major mode of distribution, and that means playoff games—something that would have been unthinkable at one point in time.80 And again, that has happened as cable TV has grown, and it has become really a part of our life in most every way.
The effect of that, I think, has been, on balance, wonderful for the fan, because at the end of the day it has created more opportunity for viewing, it has created the kind of packages that leagues have created, some of which Mark referred to—the satellite packages, or those available on cable through on-demand, and allow super-fans to obtain as many games or obtain every game, if that is what they want. It allows other fans to have all kinds of viewing available to them on cable, and the like.81
The ultimate point, the reason that this has happened is that cable creates a dual-income stream, and that dual-income stream—the ability to get money both through advertising and through subscriber bases—is what is attractive and what allows leagues and property owners to ultimately get the value to which they are entitled out of the rights of their product.
So, all that said, the bottom line is sports remains strong, sports remains attractive, and it will continue to exist in a highly competitive world, but sports will continue to be critical to the future of television.
….
MR. VICKERY: …. There are two points that I want to address today…. One is the whole question of the struggle between vertically integrated cable companies and sports teams for the ownership and the right to exploit the television rights that go with putting on a sports event. The other issue is the future of sports broadcasting in what is called advanced basic, or expanded basic, compared to paying a separate premium price for sports on a tier.83
Let me start, first, with the question of the struggle over the right to control. The way in which … sports broadcasting has worked in recent years is through vertical integration between the ownership of the teams and the broadcasting of the games to the media. There are really three levels of integration, and he touched on all three: one is the actual ownership of the team that puts on the event; the second is the ownership of the network that programs and packages the sporting events; and then the third level of integration is the distribution, either over-the-air, traditional broadcasting, or through cable distribution, or now through satellite distribution.84 And I suppose the Internet is yet an additional one, although that has not caught on as much thus far.
The Cablevision model … is one in which, at least a number of years ago, Cablevision controlled the distribution to a very large segment of the New York area through its ownership of cable companies. And it integrated into the programming level through Madison Square Garden and Fox Sports New York, in effect, to ensure a supply of programming for its cable distribution.85 That is particularly important to a cable company, or at least the FCC concluded a number of years ago in its report on the cable industry that sports programming is deemed critical to the success of a cable company in a particular area.86 Now, that may be a question that is, at least with respect to regional or local sports, up in the air at this juncture, but that is the traditional wisdom.
Cablevision then took it a step further by integrating all the way to the team level, so that by acquiring Madison Square Garden LP, it acquired the Knicks and the Rangers as well as the forum in which they put on the games.87 So they were integrated at all levels. And for a time, Madison Square Garden Network and Fox Sports New York were the only regional sports networks in the New York area and carried the Yankees under a long-term licensing agreement, the Nets, the Knicks, the Rangers, the Devils, etc.88 And, in a very true sense, their advertising slogan, “New York is our town,” was accurate.89
Now, when the long-term rights agreement—I think it was a ten- or twelve-year agreement—between the Yankees and Madison Square Garden came up for renewal, there was a contentious fight and litigation over the continuation of those rights.90 The licensing agreement, like many sports licensing agreements, had a “right to match” provision in it.91 What at least the owners of the Yankees recognized was that the middleman—that is, the programming network level—was a new line of business that was potentially quite lucrative. And why should they give it up to somebody else?
So the Yankees and the Nets got together and formed YankeeNets,92 and they then, in turn, after litigation—there was litigation which resulted in a settlement that allowed the Yankees, in effect, to get back their broadcast rights and then re-market them free of any matching provision.93 What they did was they ended up joining with other partners to create the YES Network.94
YES Network was an independent programming network. It was not affiliated with a cable company or a national media company, which was a new model.95 But, instead, it was affiliated with the actual teams that were being broadcast. So, in effect, the benefit of the broadcast was now being fully exploited by the owners of the teams rather than by deferring to the cable companies.
It has led to a fight between the cable companies and the owners of the teams because there are some thirty-one regional sports networks across the country,96 and traditionally they have been controlled by cable companies or other giant media companies, and now the future model seems to be the teams taking over their rights and trying to do the programming themselves.
….
Traditionally, there has been an interdependence between the regionals’ programming and the distribution. You can’t have a successful regional programming network unless you get to the customers in that region because, in effect, what regional sports programming networks capitalize on is the much greater appetite that local fans have for their teams than a national audience would have. Therefore, there may be twelve major Yankees games broadcast by Major League Baseball over national network television, but there are 150 or 160 games that are broadcast over the local regional sports network to the people in New York who would like to see a lot more games and follow the team much more closely. The traditional model was that the cable company wanted to ensure that it had the control of all those games so that it could guarantee delivery. Now the teams are controlling it, and yet the teams cannot do it without access to the distribution.
….
One of the examples mentioned earlier was Paul Allen’s venture out on the West Coast.105 As I understand it, it did not succeed, and the reason it did not succeed … is that they did not have the key piece, that is, the access to the distribution channel, because the cable companies refused to do a deal with them. And so that highlights the power that refusal to carry by the cable company has in determining the success of a regional sports network.
Let me turn to the second point that I wanted to raise, which is an outgrowth of the first, and that is whether the future of sports broadcasting is going to be in broadcast basic or expanded basic, which is what most people pay for when they sign up for either a satellite product or a cable company.106 In effect, what you do is pay about $40 or $50 a month, and the satellite company or the cable company decides what comes with that price. You typically get CNN, the History Channel, the network broadcast signals, ESPN, and then…you get the local regional sports networks.107
As the … fight between YES and Cablevision108 illustrates, Madison Square Garden Network and Fox Sports New York, with some exceptions that I will not get into because it is just too complicated to take up the time right now, are carried in Cablevision’s advanced basic offering. Cablevision requires all other cable companies in the area to offer it that way. And that is the way in which regional sports program networks are offered throughout the country.
One of the things that Cablevision is saying—and this again is in the papers—is that YES is too expensive, that subscribers to Cablevision should not be forced to bear the cost of YES if they do not happen to be Yankees fans.109 Well, what they are saying is a challenge to the entire way in which the cable industry has developed. Everybody who subscribes to cable probably has some channels that they never watch, yet they are still paying for. That is always the problem with bundling. In some sense, it is like a newspaper—you buy the New York Times, you might never read the editorial page, or conversely you might not ever reach the sports page, but you are still paying for it. Expanded basic is essentially the same idea. You’ve got the Travel Channel, History Channel, cooking channels, sports, news, and you are not asked to pick which ones you want to include in the package.110
Now, the idea of picking is what is referred to as “á la carte,” and there may be a future in which when you sign up for your cable company, you agree to pay a price, such as $40 a month, and you pick from a Chinese menu of programs, and you get to select ten or fifteen. The problem with that is that it completely redistributes the way in which the revenues and costs would flow, and it is unclear whether a lot of channels would survive, such as the History Channel or a lot of specialties. The sports networks, interestingly enough, would probably be the most vigorous under that model.
But again, the problem in the … Cablevision proposal is that trying to do it with just one network isolates it in a way that it would be economically infeasible. And so if the industry is going to move to a model of “á la carte” or “tiering,” it has to be done on a broad basis, such as putting all sports, including national sports, on a tier, or putting at least all regional sports on a tier.
….
I will conclude by saying that the outcome of this debate goes well beyond the sports world, but the most obvious effect that it would have in the sports world is if the cable companies prevail and they are able to keep regional sports networks off the air if the price is not what they want to pay, then there is going to be a lot less money for regional sports networks; and if there is a lot less money for regional sports networks, that means a lot less money to pay for the broadcast rights from the local teams. And if there is less money for the broadcast rights, that means there is less money to pay salaries of players.
So, the outcome of the current fight between the cable companies and the teams and the fight between independent regional sports programmers and the cable companies for control will have wide ramifications not only for the immediate companies involved but for ultimately the teams themselves….
Notes
3. See, e.g., J.R. Ball, Can TFN Find Its Niche?, GREATER BATON ROUGE BUS. REP., Aug. 5, 2003, at http://www.businessreport.com/pub/21_24/cover/3636-1.html.
4. Digital Television (“DTV”) is a type of broadcasting technology by which broadcast television stations and cable providers send their signals out to viewers digitally. See Fed. Communications Comm’n [FCC], Strategic Goals: Media, Digital Television, at http://www.fcc.gov/dtv/ (last modified Sept. 10, 2003); Digital Television, What Is Digital Television? Consumer Information Page, at http://www.digitaltelevision.com/consumer/what.shtml (last visited Feb. 6, 2004).
5. According to the FCC, bandwidth, the range of frequencies over which analog television is broadcast, is scarce. See FCC, Strategic Goals: Spectrum, at http://www.fcc.gov/spectrum/ (last modified Oct. 6, 2003) (“Because there is a finite amount of spectrum and a growing demand for it, effectively managing the available spectrum is a strategic issue….”). Alternative broadcasting methods, such as digital television, are more efficient and will make the broadcast spectrum available for other uses. Cf. KAET-DT, Glossary of Terms, at http://www.kaet.asu.edu/dtv/glossary.htm (last visited Feb. 6, 2004) (“Analog television receives one continuous electronic signal. In contrast, DTV works on the same principle as a computer or a digitally recorded compact disk. It uses binary code, a series of ones and zeros, rather than a continuous signal.”).
6. NBA TV allows viewers to purchase television packages of live National Basketball Association (“NBA”) games on cable, satellite, and digital cable. See NBA, NBA TV, at http://www.nba.com/video/nbacom_tv.html (last visited Feb. 6, 2004).
7. See Ball, supra note 3.
8. For the FCC’s discussion of the conversion of analog cable systems to digital television, see FCC, FCC Acts to Expedite DTV Transition and Clarify DTV Build-Out Rules, at http://www.fcc.gov/Bureaus/Mass_Media/News_Releases/2001/nrmm0114.html (Nov. 8, 2001).
9. Out-of-market packages allow viewers across the country to purchase subscriptions to watch games of a particular sport that take place outside of their local area. See, e.g., DIRECTV Sports, Subscriptions, at http://directvsports.com/Subscriptions/ (last visited Feb. 6, 2004).
10. See id.
11. See Gary Brown, How HDTV Works, HowStuffWorks, at http://electronics.howstuffworks.com/hdtv.htm (last visited Feb. 6, 2004). High definition is also referred to as “hi-def” or “HD.”
12. See Gary Merson, High Definition All the Time: The HDTV Insider Talks With HD Net Founder Mark Cuban, HDTV INSIDER NEWS-LETTER (Jan. 2002), at http://hdtvinsider.com/sample.html; see also Comcast Adds ESPN Programming to Local HDTV Service, PUGET SOUND BUS. J. (SEATTLE), July 31, 2003, available at http://www.bizjournals.com/seattle/stories/2003/07/28/daily40.html (last visited Feb. 6, 2004).
….
16. TiVo is a service that can be programmed to find and digitally record a user’s choice of shows. See TiVo, The TiVo Story, at http://www.tivo.com/5.1.asp (last visited Feb. 6, 2004).
17. See id.
….
20. Motorola is the official wireless communications sponsor of the National Football League (“NFL”). See Terry Lefton, Motorola Renews with NFL for $105M: League Bags a Big One as Sideline Sponsor Returns for 5 Years and Plans to Do Additional Promotions, STREET & SMITH’S SPORTSBUSINESS J., Nov. 12–18, 2001, at p1.
21. The NASDAQ reached its all-time high on March 10, 2000 when the index closed at 5048.62. See K.C. Swanson, Lessons From the Folly: Opening the March 10, 2000, Time Capsule, THESTREET.COM (Mar. 8, 2001), at http://www.thestreet.com/pf/funds/investing/1335205.html.
22. For an overview of Major League Baseball’s subscription services, see Major League Baseball, Subscriptions, at http://mlb.mlb.com/NASApp/mlb/mlb/subscriptions/index.jsp (last visited Feb. 6, 2004).
….
26. See, e.g., David Barron, Rockets to Begin Network: Astros to Be Joint Owner If FSN Can’t Equal Offer, HOUSTON CHRON., Mar. 1, 2003, at Sports 1 (discussing the proposed Houston Regional Sports Network), available at http://www.chron.com/cs/CDA/ssistory.mpl/sports/bk/bkn/rox/1800212 (last visited Feb. 6, 2004).
27. According to a 1997 poll, cable television provided over 14,000 hours of sports each year, with the four major networks contributing an additional 2,100 hours of televised sports. See Soonhwan Lee & Hyosung Chun, Economic Values of Professional Sport Fran -chises in the United States, SPORT J., at http://www.thesportjournal.org/2002Journal/Vol5-No3/econimic-values.htm (last visited Feb. 6, 2004).
28. In 2002, the sports industry grossed over $212.53 billion annually. See Tim Kroeger, “Sporting” New Technology, at http://komar.cs.stthomas.edu/qm425/03s/Kroeger1.htm (last visited Feb. 6, 2004).
29. See USAToday.com, Baseball, Inside Alex Rodriguez’s Record Deal, at http://www.usatoday.com/sports/baseball/mlbfs41.htm (last updated Dec. 20, 2000).
30. The actual purchase price was $550 million. See Barry Horn, FSN Adds Rangers, Stars over-Air TV Rights, DALLAS MORNING NEWS, Mar. 23, 2000, at 8B.
31. In 2001, the New York Yankees received over $56 million in combined television and radio contracts, while the Montreal Expos received $536,000. See Doug Pappas, The Numbers (Part Two): Local Media Revenues, at www.baseballprospectus.com/news/20011212pappas.html (Dec. 12, 2001).
32. For the regional sports networks’ blackout regulations of individual sports leagues, see Dishnet, Sports Blackout Information, at http://www.dishnet.com/images/multisports/blackout.html (last visited Feb. 6, 2004).
33. See Staci Kramer, Sports Nets Get Closer to Home, CABLEWORLD, Jan. 6, 2003, available at http://www.kagan.com/archive/cable-world/2003/01/06/cwd03010607.shtml (last visited Feb. 10, 2004).
34. Cf. Comcast SportsNet, FAQ, at http://midatlantic.comcastsportsnet.com/faq/faq.asp (last visited Feb. 6, 2004) (“If you live outside of Comcast SportsNet’s broadcast territory you may get Comcast SportsNet’s Orioles, Wizards and Capitals broadcasts via DirecTV).by ordering the MLB Extra Innings package, the NHL Center Ice package or NBA League Pass or through an outer-market package which your cable system may offer.”).
35. See generally Jeff Friedman, The Impact of Major League Baseball’s Local Television Contracts, 10 SPORTS LAW. J. 1, 3–9 (2003
36. See, e.g., FindLaw, Corporate Counsel Center, Purchase of NBC TV Advertising Inventory, at http://contracts.corporate.findlaw.com/agreements/net2phone/nbc.ad.1999.06.25.html (last visited Feb. 8, 2004).
….
42. See supra note 30 and accompanying text.
43. See id.
44. Paul Allen, owner of the Portland Trailblazers, launched the Action Sports Cable Network in July 2001. See Andrew Seligman, Commentary: ASCN Folds, and That’s a Good Thing for Trail Blazers, COLUMBIAN (VANCOUVER, WASH.), Nov. 8, 2002, at b1. The network went out of business in the fall of 2002. See id.
45. See Done Deal: Red Sox Sold to Henry Group; Duquette’s Days Numbered, SI.com, at http://www.cnnsi.com/baseball/news/2002/02/27/redsox_sold_ap/ (Feb. 27, 2002). The reported value of the deal was $660 million. See id.
46. See id.
47. See id.
48. See Len Maniace, YES-Cablevision Dispute Settled, JOURNAL NEWS (WHITE PLAINS, N.Y.), Mar. 13, 2003, available at http://www.thejournalnews.com/print_newsroom/031303/a01p13yes.html (last visited Feb. 10, 2004).
….
56. See NBC Cable Networks, NBC Olympics & Clear Channel Advantage in Joint Marketing Alliance, at http://www.nbccableinfo.com/insidenbccable/networks/Olympics/resources/inthenews/081303.htm (last visited Feb. 8, 2004).
57. See supra note 20 and accompanying text.
58. ESPN Classic, which launched in May 1995, “is a 24-hour, all-sports network featuring the greatest games, stories, heroes and memories in the history of sports.” See ESPN ABC Sports, Customer Marketing and Sales, at http://www.espnabcsportscms.com/adsales/portfolio/index.jsp?content=general_portfolio_expanded.html#classic (last visited Feb. 8, 2004).
….
60. See Nadine Sack, Reality Programs Dominate TV, Red & Black, Feb. 28, 2003, available at http://www.redandblack.com/vnews/display.v/ART/2003/02/28/3e5f8e32bc-590?in_archive=1 (last visited Feb. 10, 2004).
61. ESPN/ABC Sports currently operates several media outlets, including ESPN, ESPN2, ESPN Classic, ESPN Radio, ESPN News, and ESPN.com. See ESPN ABC Sports, Customer Marketing and Sales, The ESPN ABC Sports Media Mix, at http://www.espnabcsportscms.com/adsales/portfolio/index.jsp?contentportfolio.jsp?category=PORTFOLIO (last visited Feb. 10, 2004).
62. See Jon Lafayette, ESPN Sweetens Bitter Pill of Next Rate Hike: Execs Say Extreme Sports SVOD-broadcast Service Adds Value, CABLEWORLD, Apr. 29, 2002 (noting that ESPN is the most expensive national basic cable service at $2 per subscriber), available at http://www.kagan.com/archive/cableworld/2002/04/29/cwd141722.shtml (last visited Feb. 10, 2004).
….
64. See generally Charles P. Pierce, The Decline (and Fall) of Baseball, BOSTON GLOBE MAG., June 23, 2002, at 12 (discussing the problems facing baseball, including its declining popularity).
65. Nielsen Media Research bases its ratings on its “National People Meter Sample.” According to Nielsen’s Web site, “[a] single national household ratings point represents 1%, or 1,084,000 households.” Nielsen Media Research, Inc., Top Ten Primetime Broadcast TV Programs, at http://www.nielsenmedia.com/ratings/broadcast_programs.html (last visited Feb. 8, 2004). “All in the Family” aired on CBS from January 12, 1971, until September 1983. See Tim’s TV Showcase, All in the Family, at http://timstvshowcase.com/aif.html (last visited Feb. 8, 2004). It was the most popular show of the 1978–1979 season, averaging a 30.5 household rating. See R.D. Heldenfels, Stand-Up Comic Gets Different Kind of Show: ‘Big Time’ Variety Program Will Allow Audience to Discover ‘Real’ Steve Harvey, AKRON BEACON J., July 14, 2003.
66. For more information about the weekly Nielsen ratings, see Nielsen, supra note 65. The ratings information is updated weekly.
67. See generally Museum of Broadcast Communications, Sports and Television, at http://www.museum.tv/archives/etv/s/htmlS/sportsandte/sportsandte.htm (last visited Feb. 8, 2004) (discussing the relationship between sports and television as well as the viewership of televised sports over several decades).
68. See Richard Sandomir, The Decline and Fall of Sports Ratings, N.Y. TIMES, Sept. 10, 2003, at D1 (explaining that a “confluence of factors” in 2003, ranging from the war in Iraq to rain delays, put “a larger-than-usual dent in the viewership” of major sporting events, but that viewership for some sporting events, such as the World Series, are stronger than ever).
69. See supra notes 3–22 and accompanying text.
….
71. In 1994, Fox debuted the Fox Box. See John Levesque, A Perilous Evening in the Fox Box, SEATTLE POST-INTELLIGENCER, July 11, 2001, at D3.
….
75. In the Matter of Implementation of Section 26 of the Cable Television Consumer Prot. & Competition Act of 1992; Inquiry into Sports Programming Migration, 9 FCC Rcd. 3440 (1994) (final report) [hereinafter Inquiry].
76. Cable Television Consumer Prot. and Competition Act of 1992, 47 U.S.C. § 521 (1992).
77. See id.
78. Inquiry, supra note 75, at 3442.
79. See Stefan Fatsis, What Price Touchdowns?, WALL ST. J., Jan. 3, 2003, at A7.
80. The NBA has entered into multi-year distribution deals with three cable providers. See, e.g., NBA Enters Deal with Cable Systems, SI.com, at http://sportsillustrated.cnn.com/2003/basketball/nba/09/29/bc.bkn.nbatv.distributi.ap/index.xml (Sept. 29, 2003).
81. See supra notes 9–10 and accompanying text.
82. See supra notes 23–25 and accompanying text.
83. See, e.g., Frank Angst, A Guide to Keeping Your Eye on Junior, CHARLESTON GAZETTE (W. VA.), Mar. 26, 2000, at P4D.
84. See generally Wikipedia, Satellite Television, at http://en.wikipedia.org/w/wiki.phtml?title=Satellite_television&printable=yes (last modified Oct. 25, 2003).
85. See generally Bob Raissman, Giving Hockey Cold Shoulder, DAILY NEWS (N.Y.), Apr. 11, 2003, at 98.
86. Cf. Elizabeth L. Warren-Mikes, Note, December Madness: The Seventh Circuit’s Creation of Dual Use in Illinois High School Association v. GTE Vantage, 93 NW. U. L. REV. 1009 (1999) (“Any event, particularly a sports event, enjoys a symbiotic relationship with the networks or cable stations that broadcast it…. [T]he media depend upon the advertising as well as the ratings boost that occurs when it is granted the right to televise a major event….”).
87. See Cablevision, Corporate Information, Sports & Entertainment, at http://www.cablevision.com/index.jhtml?pageType=entertainment (last visited Feb. 9, 2004) (describing Cablevision’s properties, which include Madison Square Garden).
88. See Brad Rock, A Utahn Makes It Big in N.Y., DESERET NEWS, Sept.27, 2002 (providing that until recently, Madison Square Garden Network (“MSG Network”) and Fox Sports New York had broadcast rights to eight of ten major professional sports teams in New York: the Knicks, Nets, Islanders, Rangers, Devils, Yankees, Mets, and Liberty).
89. This is the slogan for the MSG Network. See MSGNETWORK.COM, at http://www.msgnetwork.com/index.jsp (last visited Feb. 9, 2004).
90. See Nate Allen, MSG Matches Yankees’ IMG TV Deal: Dispute Likely to Continue Over Deal, MARK’S SPORTSLAW NEWS, at http://www.sportslawnews.com/archive/Articles%202000/Yankeesoneyeardeal.htm (Nov. 17, 2000).
91. See id.
92. YankeeNets LLC was formed in June 2001, when the Yankees broke away from the Cablevision Systems Corp.-owned MSG Network. See R. Thomas Umstead, Yankees Go Home, Form Own Net, MULTICHANNEL NEWS, at http://www.multichannel.com/article/CA90559?display=Search+Results&text=yankees+go+home%2C+form+own+net (June 25, 2001).
93. See Richard Sandomir, Yanks Pay $30 Million to End Deal with MSG, N.Y. TIMES, June 21, 2002, at D2.
94. See Rudy Martzke, Yank’ TV Could Bring in $100M, USA TODAY, Sept. 11, 2001, at 1C.
95. Cf. id.
96. See, e.g., DirecTV Regional Sports Networks, at http://www.satisfied-mind.com/directv/regsports.htm (listing DirecTV Regional Sports Networks) (last visited Feb. 9, 2004).
….
105. See supra note 44 and accompanying text; see also Gilbert Chan, Seeking Deal Fit for Kings, SACRAMENTO BEE, Apr. 28, 2003, available at http://www.sacbee.com/content/sports/basketball/kings/story/6531885p-7482561c.html (last visited Feb. 9, 2004).
106. See supra note 83 and accompanying text.
107. For packages and monthly rates, see Cablevision, Products & Services, Pricing and Packages, at http://www.cablevision.com/index.jhtml?pageType=ratecard&zCode=10583&serviceType=io (last visited Feb. 9, 2004).
108. See generally Yankees Entm’t & Sports Network v. Cablevision Sys.Corp., 224 F. Supp. 2d 657 (S.D.N.Y. 2002).
109. See, e.g., YES Sports Channel Files Antitrust Suit Against Cablevision, WALL ST. J., Apr. 30, 2003, available at 2002 WL-WSJ 3393318.
110. See Cablevision, supra note 107.
….
LEAGUE PERSPECTIVES
THE NFL PROGRAMMING SCHEDULE: A STUDY OF AGENDA-SETTING
John A. Fortunato
In 2006 the National Football League (NFL) began televising its games under the contractual parameters of broadcast agreements with CBS, Fox, NBC, ESPN, and DirecTV. These networks pay the NFL revenue totaling over $3.75 billion per season. (The previous contract from 1998–2005 had generated an average of $2.2 billion annually for the NFL.) In addition to being the NFL’s greatest revenue source, television networks are the league’s greatest source of exposure. Once a broadcast contract is signed a partnership is formed with the objective of creating a television programming schedule that attracts the most viewers for NFL games. The creation of the television programming schedule includes the strategic placement of games and the selection of the teams playing in those games.
The broadcast agreements for the 2006 season brought about substantial changes in the NFL television programming schedule. Monday Night Football moved from ABC to ESPN. NBC became the NFL’s primetime, over-the-air network televising games on Sunday night. NBC was also granted a flexible schedule component that allowed the network to broadcast a more meaningful game late in the season. Finally, eight games would be televised on the NFL Network in the final six weeks of the regular season on either Thursday or Saturday night. The result of these programming schedule changes was that there was an increase in audience viewership of NFL games in 2006 for all television network partners.
The agenda-setting model provides a theoretical explanation for the NFL’s television programming schedule strategy. Transfer of topic salience from the media to the public is always at the core of agenda-setting studies. Organizations, such as the NFL, examine the use of the media to help achieve this transfer. Agenda setting research claims that media exposure of a topic increases the public salience of that topic. The theory also suggests that the emphasis of certain attributes of the topic can increase the public salience of those attributes. Therefore agenda-setting researchers claim that the media can influence what topics the audience will think about and how they will think about those topics. For a sports league its attributes are its teams and players. Creating a format that allows the audience to see games with the best teams and the best players and placing these games in a proper location in the programming schedule allows a league to communicate and promote its best attributes. In sports the proper programming schedule can do more than transfer topic salience; in fact, it can help influence the behavior of audience viewing that translates into revenue for the networks and the sports league.
….
THE BUSINESS MODEL OF SPORTS AND TELEVISION
Applying agenda-setting to sports is unique because leagues and television networks sign broadcast rights contracts. In a broadcast rights contract the network agrees to pay a sports league a certain dollar amount for a certain number of years for the rights to televise that league’s games (e.g., Fortunato, 2001; Wenner, 1989). While some agenda-setting researchers have examined how media agendas are constructed (e.g., Kiousis, et. al., 2006; Kosicki, 1993; Roberts, 1997), once sports leagues and networks sign a broadcast rights agreement the topic is clearly placed on the media agenda.
The system of selling broadcast rights to television networks was legally established in the Sports Broadcasting Act passed by the United States Congress in September of 1961. The law provides sports leagues with an antitrust exemption that allows them to collectively pool the broadcast rights to all of their teams’ games and sell them to the highest bidding television network (e.g., Fortunato, 2001; Scully, 2004). In what Congress termed as “special interest legislation” for this single industry of sports leagues, an economic system that provides the NFL with its greatest revenue source was established.
In addition to being their greatest revenue source, television networks provide sports leagues with their greatest source of exposure (e.g., Fortunato, 2001). Exposure is ascertained through the league’s placement in the television programming schedule (day and time that the game is played). The signing of a broadcast contract creates a partnership between a sports league and a television network where both now have a vested interest in increasing the audience watching the games. In addition to game placement, determining which teams will play in these nationally televised games is very much a part of a league’s exposure strategy. The selection of which teams will appear on nationally televised games is the first step in setting up the entire schedule of games for a league (e.g., Fortunato, 2001). The general objective is to provide the audience with games involving the best teams and players at the best placement within the programming schedule. In relating sports to agenda-setting the proper programming schedule can do more than transfer topic salience, and in fact, help influence the behavior of audience viewing that translates into revenue for the networks and the sports league. Offering the games with the best teams and players at the best placement in the programming schedule provides the opportunity for higher audience viewership.
While the league receives its money from the networks, these networks that made the investment in the sports league are selling commercial time during these games to advertisers. Wenner (1989) contends that sports programming is a good proposition because this type of programming offers the desirable, and relatively hard-to-reach, male audience between the ages of 18 and 49. He claims the sports programming demographic tends to be well-educated with considerable disposable income and “advertisers are willing to pay top dollar for this audience because they tend to make purchase decisions about big-ticket items such as automobiles and computers” (p. 14). Bellamy (1998) adds that “with a seemingly endless proliferation of television channels, sport is seen as the programming that can best break through the clutter of channels and advertising and consistently produce a desirable audience for sale to advertisers” (p. 73). Fortunato (2001) summarizes the business relationship between sports leagues, television networks, and advertisers where “the proper exposure and positioning in the program schedule and offering the best product to viewers in the form of teams, players, and matchups are essential to achieve the best television rating, and subsequently to earn the greatest advertising revenue, which would initially benefit the network—and eventually the league—when negotiating its next broadcast rights contract” (p. 73).
TELEVISION PROGRAMMING AND AUDIENCE VIEWERSHIP
Understanding some general perspectives of media use behavior helps to better explain how to possibly achieve the programming schedule objective of high audience viewership. Rubin (1984, 2002) identifies two media-use orientations toward a medium and its content that are based on audience motives, attitudes, and behaviors: (1) ritualized media use and (2) instrumental media use. Ritualized media use focuses on a particular medium, rather than on content. It indicates how people use their leisure time and which medium they attend to when all of these media options are available. In ritualized media use the tendency is to use the medium regardless of the content. Rubin (2002) explains that ritualized use is about participating in a medium more out of habit to consume time as it is the medium that the person enjoys. In ritualized media use people are turning on the television and randomly going through different channels during their leisure time attempting to find a program worthy of taking the time to view, as “watching” is the ritual activity.
Instrumental media use focuses on purposive exposure to specific content and is more intentional and selective on the part of the individual audience member (e.g., Rubin, 1984, 2002; Rubin & Perse, 1987). It is the content available through a particular medium at a particular time that is dictating the media use behavior. In an instrumental media use orientation people are purposely turning on NBC on Sunday night because they want to watch the football game. This instrumental mass media use can be a factor in a person organizing his or her day so as to be done with any other activities and be available to participate in the mass media content at the time it is available.
Television networks attempt to tap into both the ritualized and instrumental media use orientations by aligning certain programming with the leisure time of their desired audience (e.g., Fortunato, 2001). Understanding that television viewing can be based on the audience’s leisure time, the NFL and its television partners will try to create a placement programming schedule that capitalizes on the ritualized nature of television viewing. However, NFL personnel and the television networks that invested in this programming would like to believe they have content whose audience participates in instrumental viewing, watching television to specifically view an NFL game. Having the best teams and the best players participating in the game is the attempt to increase instrumental viewing. This strategy of executing both programming schedule components, placement of games (agenda-setting through exposure) and having the best teams and players participating in those games (agenda-setting through selection of attributes) gives the league and the networks the best opportunity for one or both media-use orientations to be exercised by the audience.
SPORTS AUDIENCE
Understanding some general characteristics of the sports audience also contributes to developing the proper television programming schedule. The sports audience has been described as very loyal and watching sports has been found to satisfy emotional needs (e.g., Madrigal, 2000; Mullin, Hardy, & Sutton, 2000; Sutton, McDonald, Milne, & Cimperman, 1997; Tutko, 1989; Underwood, Bond, & Baer, 2001). Funk and James (2001) indicate that the emotional and loyalty characteristics of the sports fan can result in consistent and enduring behaviors, including attendance and watching games on television. With only a small number of fans having access to tickets to games, watching the NFL on television remains a necessary condition to visually experience the sport live (e.g., Lever & Wheeler, 1993; Wenner, 1989). The emotion and loyalty of the audience combining with the need for television on the part of the audience to experience sports games helps to maintain consistent audience viewership and keep a steady stream of advertisers.
Still, certain game matchups attract larger audiences. Sports fans are obviously most interested in games where their favorite team is playing (e.g., Wann, Schrader, & Wilson, 1999). The opportunity to see a favorite team win has been identified as the number one fan motivation for watching sports (e.g., Gantz, 1981; Wenner & Gantz, 1998; Zillmann, Bryant, & Sapolsky, 1989). Fans also have a strong interest in games where their favorite team is not playing, but the outcome of the game between the two teams that are playing has an impact on their favorite team in the standings and their opportunity to qualify for the playoffs (e.g., Fortunato, 2004; Zillmann et. al., 1989). Therefore, selecting games whose outcome is of interest to many fans is a scheduling objective.
METHOD
The purpose of this paper was to describe the NFL’s television programming schedule and demonstrate how the agenda-setting model helps provide a rationale for this strategy. By following the agenda-setting theoretical claims that transfer of topic salience is through both media exposure of the topic and selection of certain topic attributes, an understanding of what the NFL hopes to attain through its television agreements is provided. To demonstrate how the agenda-setting theoretical model can be applied to the NFL programming strategy, the 2006 season is examined. The NFL is selected because it is the league that generates the highest broadcast rights fees and the largest viewing audiences. The 2006 season’s programming schedule is important to explain because it is the first year of television agreements for the NFL with CBS, Fox, NBC, ESPN, and DirecTV and these broadcast contract parameters will remain in place until at least 2011 [Ed. Note: now 2013].
The results section begins by describing the current financial status of the NFL’s television agreements with all of its broadcast partners. It then explains the exposure changes in the programming schedule that were brought about by the broadcast rights agreements that began in 2006. In particular, the most notable change of a flexible schedule given to NBC for games at the end of the regular season will be explained.
Finally, the viewership of NFL games in 2006 for each broadcast partner is provided. The result of audience viewership is important because that is the objective of the programming schedule strategies and is still the most important audience feedback measure for the networks and the NFL (e.g., Fortunato, 2001). Ratings and viewership data are vital because these numbers have such a tremendous impact on the economics of a television network. Webster and Lichty (1991) describe ratings as “a fact of life for virtually everyone connected with the electronic media. They are the tools used by advertisers and broadcasters to buy and sell audiences” (p. 3). Whether correctly or not, network personnel, advertisers, and to a large extent sports leagues treat ratings as the ultimate audience feedback measure. These ratings numbers are so accepted in the practical industry that they are often the basis for content decision-making on the part of a television network and advertisers. The ratings and viewership data presented here are provided by Nielsen Media Research and ascertained through NFL and network press releases.
RESULTS
In April 2005, the NFL announced broadcast rights contracts that would begin in the 2006 season and change the parameters of the league’s revenue and exposure on television. Under these agreements the NFL would receive television revenue totaling over $3.75 billion per season paid by CBS, Fox, NBC, ESPN, and DirecTV (“Street & Smith’s,” 2005). CBS and Fox remained as the Sunday afternoon rights holders paying a total of $3.73 billion and $4.27 billion respectively to broadcast the NFL through 2011. In the agreements each network received the rights to televise two Super Bowls. NBC replaced ABC as the NFL’s primetime, over-the-air network in a deal that would pay the league a total of $3.6 billion through 2011. Similar to the agreement with ABC, NBC would also receive the rights to televise two Super Bowls, two playoff games on Wild Card Weekend, and the Thursday night season opening game. The network that televises the Super Bowl in a given year would also televise the Pro Bowl in that year. ESPN remained as the NFL’s cable partner agreeing to broadcast Monday Night Football at a price totaling $8.8 billion through 2013. ESPN had previously televised NFL games on Sunday night. DirecTV continued to be the NFL’s exclusive satellite television partner, paying the league a total of $3.5 billion through 2010. The DirecTV NFL Sunday Ticket allows fans to receive all out-of-market games on Sunday afternoon.
These broadcast agreements brought about significant changes in the NFL television programming schedule. The primetime, over-the-air network game would shift from Monday night, where it had been since ABC began televising Monday Night Football in 1970, to Sunday night. In addition to changing the day of the week from Monday to Sunday for the NFL to showcase its premier primetime matchup, the primetime shift featured NBC being awarded a flexible schedule for the final seven weeks of the regular season. There would also be an earlier start time for the primetime games with the Sunday games on NBC beginning at 8:15 ET and the Monday night games on ESPN beginning at 8:40 ET. Finally, eight games would be televised on the NFL Network in the final six weeks of the regular season on either Thursday or Saturday night.
Determining which teams play in these primetime games is more complicated for the NFL than other sports leagues because the NFL does have multiple network broadcast partners. (The NBA, NHL, and Major League Baseball have only one over-the air network partner, although all leagues do have cable partners.) CBS is the primary rights holder to the American Football Conference (AFC), while Fox is the primary rights holder to the National Football Conference (NFC). CBS initially receives all of the AFC intra-conference matchups as well as the games when an AFC team plays an NFC team in the NFC city (i.e., if the New England Patriots played the Bears in Chicago the game would be televised on CBS). Fox initially receives all of the NFC intra-conference matchups as well as the games when an NFC team plays an AFC team in the AFC city (i.e., if the Chicago Bears played the Patriots in New England the game would be televised on Fox). Games must still be allocated to NBC and ESPN, as well as the eight games being televised on the NFL Network. Obviously all networks would like to have the most attractive games televised on their network so they can generate the larger viewership and advertising revenues. The challenge for the NFL is to satisfy all of these networks and generate the highest overall viewership through all of its programming schedule segments.
The flexible schedule given to NBC was the programming schedule change that had the most impact for the NFL’s other broadcast partners. The NFL decided to offer flexible scheduling to its primetime rights holder as an incentive for a network to increase its bid. The need for the flexible schedule stemmed from the difficulty to predict in the spring, when the programming schedule was formulated, which teams would be good in November and December. Whereas Fox or CBS could easily decide which of their many games would be broadcast to the majority of the country, for the primetime network rights holder it did not have this option to switch games and could easily get stuck with ones not featuring the best teams. The most glaring example was that in the 1999, 2000, and 2001 seasons, the Super Bowl champion St. Louis Rams, Baltimore Ravens, and New England Patriots were not part of the Monday Night Football schedule. Therefore to remedy that problem, at the next opportunity to negotiate its broadcast contracts the NFL offered a flexible schedule component to its primetime rights holder.
NBC was awarded flexible scheduling for Weeks Ten through Fifteen, and Week Seventeen in 2006. Week Sixteen did not feature flexible scheduling in 2006 because it was a holiday weekend so that game was determined prior to the season. In flexible scheduling a game would simply be moved from Sunday afternoon to Sunday evening. Games that are originally scheduled for Monday, Thursday, or Saturday are not eligible to be shifted. Teams would be notified twelve days in advance of the switch in Weeks Ten through Fifteen and on six days notice prior to Week Seventeen.
The NFL is also allowed to shift games on Sunday afternoon between the 1:00 ET and the 4:00 ET time periods. Moving games on Sunday afternoon is a common practice of the league and the networks, having occurred eight times during the 2005 season. During the seven-week flexible schedule period CBS and Fox are each able to protect a total of five games, but could not protect more than one game in any week. CBS and Fox did, however, have to make the selections of the games they were going to protect in Week Four (e.g., Hiestand, 2006). All games not protected by CBS and Fox were eligible to be shifted to Sunday night. NBC would make a request for a particular game, but the final decision as to which game gets switched is still at the discretion of the NFL. According to Dick Ebersol, NBC Sports chairman, “We’re able to say to the league, ‘here is a game we would like to have, and here are reasons why we think this is a compelling game.’ And then the league’s television department and the commissioner make the final decision” (Stewart, 2006a). The NFL described flexible scheduling as a strategy that “will ensure quality matchups on Sunday night in those weeks and give surprise teams a chance to play their way onto primetime” (“Flexible scheduling,” 2007).
The flexible schedule could also help preview and promote the teams that figured to appear in the playoffs. In the seven games that were part of the flexible schedule on NBC in 2006, of the fourteen teams playing in those games eleven would qualify for the NFL playoffs. Of the flexible schedule matchups, only the Denver Broncos and the Green Bay Packers did not qualify for the NFL playoffs. The Broncos appeared twice in the NBC schedule during the flexible period, but were eliminated from the playoffs by losing their final regular season game, being upset at home by the San Francisco 49ers. The Green Bay Packers appeared in the Week Seventeen flexible schedule game played on New Year’s Eve against the Chicago Bears amid speculation it would be future Hall-of-Fame quarterback Brett Favre’s final game. The Bears also had the second-best record in the NFL in 2006.
In comparison to previous seasons only six of the fourteen teams playing in the Monday Night game in the final seven weeks of the 2003 season qualified for the playoffs. In 2004 eight of the fourteen teams playing in the Monday Night game in the final seven weeks would reach the playoffs, and in the 2005 season only four of the fourteen teams playing in the Monday Night game reached the playoffs. Also, from 2003 to 2005 in the final seven games of the regular season, there were only a total of four games out of twenty-one in which the game featured teams that would both qualify for the playoffs in that season. Eight of the twenty-one games over that three-year period had matchups where neither team qualified for the playoffs. With the flexible schedule there were four games in 2006 that featured both teams that would qualify for the playoffs and every game had at least one team that qualified for the 2006 playoffs.
The flexible schedule is another example of the partnership that is formed between the NFL and the television networks. The NFL has consistently demonstrated a willingness to work with its broadcast partners and shift its programming schedule. The implementation of the bye-week, a week where the team does not have a game scheduled, was a way to turn a sixteen-week regular season into a seventeen-week regular season, giving the networks an extra week of valuable NFL programming that no doubt helped increase the rights fees they paid to the NFL. Other programming schedule strategies have also been implemented to increase ratings. To illustrate how a seemingly small shift in the program schedule can impact the ratings, when the NFL pushed back the starting times of divisional and wild-card playoff games in the 2001 and 2002 seasons, the result was a 9% ratings increase (Martzke, 2003). After the meaningless final regular season Monday Night game of the 2002 season between the St. Louis Rams and the San Francisco 49ers produced what was at the time the lowest rated game (8.7) in the history of Monday Night Football, the NFL and ABC agreed to not have a Monday Night Football game the last week of the season. Instead in 2003 ABC would inherit the opening game of the NFL regular season with a Thursday evening telecast as part of the NFL’s “Kickoff Weekend.” The season-opening Thursday night game telecast remains a staple in the NFL programming schedule. Again, though, providing one network with a programming asset in the NFL means denying another broadcast partner of televising that game.
AUDIENCE VIEWERSHIP—NFL 2006 SEASON
The result in 2006 for the NFL with its flexible schedule strategy was a 7% increase (1.2 million viewers) in NBC’s viewership compared to Monday Night Football on ABC in 2005. The average of 17.5 million viewers was the best viewership the NFL had received in primetime since 2000 when ABC averaged 18.5 million viewers. NBC also saw a dramatic increase in comparison to the Sunday night programming it aired in 2005, averaging 73% more viewers in the time period of the football game.
There was certainly concern that the flexible schedule would benefit only NBC, hurting both CBS and Fox by denying them the better games. The ultimate result for the NFL and its broadcast partners, however, was that each network had an increase in viewership in 2006 in comparison to the previous year (see Table 9). Dick Ebersol, NBC Sports Chairman, commented, “What is really amazing is that in a backdrop of eroding ratings on broadcast television, that doesn’t seem to be happening with the NFL. It is rare when one entity can keep all its television partners happy, but that’s what the NFL has done” (e.g., Stewart, 2006b).
Table 9 Audience Viewership by Television Network—NFL 2006
Network | Average Viewers | Increase from 2005 |
CBS | 15.2 million | +1% |
Fox | 16.6 million | +5% |
NBC | 17.5 million | +7%* |
ESPN | 12.3 million | +41%** |
*Compared to ABC Monday Night Football in 2005.
**Compared to ESPN Sunday Night Football in 2005.
Sources: NFL, Nielsen Media Research. Previously published in Journal of Sports Media. Used with permission.
In 2006 each network televising the NFL had its own audience viewership successes. Fox’s national game in the late Sunday afternoon programming schedule segment had an average rating of 13.8, 21.8 million viewers, giving it a larger audience than any primetime show during the autumn of 2006 (e.g., Lemke, 2007). Fox also had the three most watched regular season game programming schedule segments of the year, with two of them coming during the flexible schedule period: the late Sunday afternoon segment in Week Thirteen, with most of the country seeing the Dallas Cowboys play the New York Giants, attracted 27.6 million viewers and the late Sunday afternoon segment in Week Twelve, with most of the country seeing the New England Patriots play the Chicago Bears, attracted 24.2 million viewers. Fox’s game on Thanksgiving Day between the Cowboys and the Tampa Bay Buccaneers was the third most watched regular season game of 2006 with 23.8 million viewers… The late Sunday afternoon segment featuring the game between the Cowboys and the Giants was the most-watched NFL regular-season game since the 1999 Thanksgiving Day game between the Cowboys and the Miami Dolphins on CBS.
CBS has the rights to the AFC, which features some teams in smaller television markets than the NFC (i.e., Indianapolis, Jacksonville, Kansas City, Nashville, compared to Fox which has Chicago, Philadelphia, San Francisco, Washington D.C., and also the initial rights to televise the very popular Dallas Cowboys). CBS had two of the top ten programming schedule segments. The late Sunday afternoon segment in Week Eight, with most of the country seeing the Indianapolis Colts play the Denver Broncos, was the most watched television program for that week, including all primetime programming. On five other occasions the CBS national game was one of the top five most watched television programs for that particular week.
In televising Monday Night Football ESPN had the most-watched series in cable television history in 2006. After the 2006 season, excluding breaking news, ESPN’s Monday Night Football occupied nine of the top ten spots on the list of cable’s biggest household audiences ever, including at the time the most watched program in cable television history being the October 23 game between the Dallas Cowboys and the New York Giants with viewership in 11,807,000 homes. (The game was eclipsed by the Disney Channel premiere of High School Musical 2 on August 17, 2007, which had 17.2 million viewers [Levin, 2007]). ESPN also led all networks, cable or over-the-air, in the male demographics of 18–34, 18–49, and 25–54 on Monday night, and on four occasions ESPN was the most watched network, cable or over-the-air, in primetime on Monday night in the autumn of 2006. For ESPN the switch from Sunday night to Monday night produced an average rating jump from 5.8 in 2005 to an 8.2 in 2006 with the games averaging 12.3 million viewers, 3.6 million more than the previous year. George Bodenheimer, president of ESPN and ABC Sports, commented, “ESPN’s Monday Night Football greatly exceeded all expectations. Our commitment to present MNF as never before served our fans and lifted every aspect of ESPN’s business” (“ESPN Mediazone,” 2006).
Finally, the NFL placed games on the NFL Network for the first time, with eight games played on Thursday and Saturday nights over the final six weeks of the season beginning on Thanksgiving evening. The eight games on the NFL Network averaged 4.1 million viewers. At the time the NFL Network was only in 40 million homes, with several cable companies balking at the NFL’s asking price of 70 cents per subscriber per month. In November of 2006 the NFL Network was available to all DirecTV and Dish Network subscribers, but provided only by Cox and Comcast cable companies to customers as part of their higher-priced digital sports tiers, while Time Warner and Charter did not carry the NFL Network at all (e.g., Lemke, 2006). The NFL did undertake an advertising effort asking customers to call their cable provider to urge it to make the NFL Network available on its service. By putting games on its own network the NFL simply now has a communication vehicle to promote its own agenda as well as an asset that fans desire, increasing the long-term profit-ability of the network. The NFL Network has committed to broadcasting games for four years, with Pat Bowlen, owner of the Denver Broncos and chairman of the NFL’s broadcast committee, saying, “As far as I’m concerned, it’s pretty much going to remain a staple of what we do” (e.g., Maske, 2006). It should be pointed out that games on either the NFL Network or ESPN are still available in the home markets of the two teams playing in the game on an over-the-air channel, a policy the NFL instituted when it started placing games on cable television in 1987. The NFL remains the only league that requires games carried by a cable network to be televised on an over-the-air television station into the home markets of the teams that are playing.
DISCUSSION
It is clear that the changes made by the NFL in the television programming schedule are designed for the league to increase its revenue and exposure. Through its broadcast partners the NFL is trying to create a programming schedule that capitalizes on two vital components: the placement of the games and the selection of the teams and players participating in those games. The programming schedule objective is to attract the most viewers for the games that generate greater advertising revenues for the networks and eventually higher broadcast rights fees paid to the NFL. For the NFL, selecting which teams will appear in the primetime games is difficult because to place a game on one network is to deny another network of that asset. When the NFL awarded NBC its Sunday night television package with a flexible schedule component, it guaranteed the network a quality game in primetime, however, CBS and Fox were each certain to lose some games they would have liked to have on their air. As its greatest revenue source the flexible schedule also reiterates that the needs and desires of the television networks and the interests of the television audience are more important than the fans attending the stadium, with fans being told the change of a game time possibly only twelve days in advance (six days for the final week of the season) and perhaps having to alter travel schedules to still attend the game.
Applying agenda-setting to the NFL’s exposure strategy is an example of a theory lending insight into a practical situation. The agenda-setting theoretical model illustrates the importance and provides a theoretical rationale for the NFL’s television programming schedule strategy. This strategy of developing both programming schedule components, placement of games (agenda setting through exposure) and having the best teams and players participating in those games (agenda-setting through selection of attributes) gives the league and the networks the best opportunity to transfer the salience of the NFL to the public and produce an agenda-setting effect. In this example of agenda-setting being applied to the NFL, the proper exposure in the programming schedule and showing better teams in these games not only transferred the topic salience, but increased the behavior toward that topic, an increase in watching NFL games on television. The ultimate agenda-setting result for the NFL of these programming schedule changes was that there was an increase in audience viewership in 2006 for all networks televising NFL games.
References
Bellamy, R. V., Jr. (1998). The evolving television sports marketplace. In L.A. Wenner (Ed.), Mediasport (pp. 73–87). London: Routledge.
….
ESPN mediazone. (2006, December 6). Retrieved December 11, 2006 from: http://media.espn.com/ESPNTODAY/2006/Dec_06/MNFmostviewed.htm.
Flexible scheduling. (2007). National Football League. Retrieved February 11, 2007 from: http://www.nfl.com/schedules/tv/flexible.
Fortunato, J. A. (2001). The ultimate assist: The relationship and broadcast strategies of the NBA and television networks. Cresskill, NJ: Hampton Press.
Fortunato, J. A. (2004). The rival concept: An analysis of the 2002 Monday Night Football Season. Journal of Sport Management, 18(4), 383–397.
Funk, D., & James, J. (2001). The psychological continuum model: A conceptual framework for understanding an individual’s psychological connection to sport. Sport Management Review, 4(2), 119–150.
….
Gantz, W. (1981). An exploration of viewing motives and behaviors associated with television sports. Journal of Broadcasting & Electronic Media, 25(3), 263–275.
….
Hiestand, M. (2006, October 25). Flex concept looking like sweet deal for NBC. USA Today, p. 6C.
….
Kiousis, S., Mitrook, M., Wu, X., & Seltzer, T. (2006). First- and second-level agenda-building and agenda-setting effects: Exploring the linkages among candidate news releases, media coverage, and public opinion during the 2002 Florida Gubernatorial Election. Journal of Public Relations Research, 18(3), 265–285.
Kosicki, G. M. (1993). Problems and opportunities in agenda-setting research. Journal of Communication, 43(2), 100–127.
….
Lemke, T. (2006, November 18). NFL Network to air games, differences. Washington Post, p. C3.
Lever, J., & Wheeler, S. (1993). Mass media and the experience of sport. Communication Research, 20(1), 125–143.
Levin, G. (2007, April 22). High marks for ‘Musical 2,’ USA Today, p. 4D.
Madrigal, R. (2000). The influence of social alliances with sports teams on intentions to purchase corporate sponsors’ products. Journal of Advertising, 29(4), 13–24.
Martzke, R. (2003, January 15). Later starting times help boost NFL’s playoff ratings. USA Today, p. 2C.
Maske, M. (2006, December 28). So far, owners happy with NFL Network. Washington Post, p. E4.
….
Mullin, B. J., Hardy, S., & Sutton, W. A. (2000). Sport marketing, 2nd ed. Champaign, IL: Human Kinetics.
….
Roberts, M. (1997). Political advertising’s influence on news, the public and their behavior. In M. E. McCombs, D. L. Shaw & D. Weaver (Eds.), Communication and democracy: Exploring the intellectual frontiers in agenda-setting theory (pp. 85–96). Mahwah, NJ: Lawrence Erlbaum Associates.
Rubin, A. M. (1984). Ritualized and instrumental television viewing. Journal of Communication, 34(3), 67–77.
Rubin, A. M. (2002). The uses-and-gratifications perspective of media effects. In J. Bryant & D. Zillmann (Eds.), Media effects: Advances in theory and research, 2nd ed. (pp. 525–548). Mahwah, NJ: Lawrence Erlbaum Associates.
Rubin, A. M., & Perse, E. M. (1987). Audience activity and television news gratifications. Communication Research, 14(1), 58–84.
Scully, G. W. (2004). The market structure of sports. In S. R. Rosner & K. L. Shropshire (Eds.), The business of sports (pp. 26–33). Sudbury, MA: Jones and Bartlett Publishers.
….
Stewart, L. (2006a, October 25). Bears–Giants moved under flex schedule. Los Angeles Times, p. D5.
Stewart, L. (2006b, December 15). NFL scoring big in the ratings. Los Angeles Times, p. D12.
Street & Smith’s Sports Business Journal (2005, November 7–13). Indepth: Sports media, p. 22.
Sutton, W., McDonald, M., Milne, G., & Cimperman, J. (1997). Creating and fostering fan identification in professional sports. Sport Marketing Quarterly, 6(1), 15–22.
….
Tutko, T. A. (1989). Personality change in the American sport scene. In J. H. Goldstein (Ed.), Sports, games, and play: Social and psychological viewpoints (pp. 111–127). Hillsdale, NJ: Erlbaum.
Underwood, R., Bond, E., & Baer, R. (2001). Building service brands via social identity: Lessons from the sports marketplace. Journal of Marketing Theory & Practice, 1–13.
Wann, D. L., Schrader, M. P., & Wilson, A. M. (1999). Sport fan motivation: Questionnaire validation, comparisons by sport, and relationship to athletic motivation. Journal of Sport Behavior, 22(1), 114–139.
….
Webster, J. G., & Lichty, L. W. (1991). Ratings analysis: Theory and practice. Hillside, NJ: Erlbaum.
Wenner, L. A. (1989). Media, sports, and society: The research agenda. In L. A. Wenner (Ed.), Media, sports, and society (pp. 13–48). Newbury Park: Sage.
Wenner, L. A., & Gantz, W. (1998). Watching sports on television: Audience experience, gender, fanship, and marriage. In L.A. Wenner (Ed.), Mediasport (pp. 233–251). London: Routledge.
….
Zillmann, D., Bryant, J., & Sapolsky, B.S. (1989). Enjoyment from sports spectatorship. In J.H. Goldstein (Ed.), Sports, games, and play: Social and psychological viewpoints (pp. 241–278). Hillsdale, NJ: Lawrence Erlbaum.
FORECASTING THE IMPORTANCE OF MEDIA TECHNOLOGY IN SPORT: THE CASE OF THE TELEVISED ICE HOCKEY PRODUCT IN CANADA
Norm O’Reilly and Ryan Rahinel
BACKGROUND
The concept of bringing enhanced technology into sport is flush with optimism (Silk et al, 2000). With regard to media technology research, the realisation that sports marketing encompasses the duality of the sports industry (see Mullin et al, 2000; Shank, 2002) is important, as media technologies enable and enhance both the direct exchange of sports products to sports consumers (e.g. watching a game on HDTV) and the indirect marketing of non-sports products through sport (e.g. a beer company’s corporate sponsorship of a professional sports franchise enhanced by iTV). Sports management researchers have devoted attention to technology’s use in live situations (Siegel, 2000; Moore et al, 1999) and in the indirect marketing of non-sports products through sport (Moore et al, 1999; Mendez, 1999). Yet practitioners are also keen on learning how decisions can be made regarding the implementation of technology in the direct exchange of sport products. This decision is not easy for the following reasons:
1. revenues from new technologies may simply be cannibalizing those from old or existing ones
2. senior management may view media as a secondary concern
3. forecasting consumer adoption is difficult when many overlapping variables must be considered (see Boyd & Mason, 1999)
4. adoption may be required from other stakeholders
5. data on which to base a decision may be difficult to acquire.
This paper demonstrates how qualitative research can be used to aid in media technology selection decisions in sport by examining the case of ice hockey, specifically, the NHL in Canada.
WHY ICE HOCKEY AND THE TELEVISED NHL?
Ice hockey plays an important role in Canada’s identity, society, economy and culture (Whitson et al, 2000; Gruneau & Whitson, 1993). It is broadcast by four national networks, its games are among the most watched programmes in Canadian television history (Canadian Broadcasting Corporation, 2002; Hockey Canada, 2004), and its leagues and tournaments (in the professional, junior and international realms) garner widespread public interest.
The NHL is ice hockey’s most commercialised media property. It had revenues of $1.996 billion in the 2002–03 season (Levitt, 2004), including a five-year, $600 million television rights contract in the United States with ABC/ESPN that expired after the 2003–04 season (Street & Smith’s Sports Business Journal, 2005). In Canada, television revenues are lower and from a number of networks (e.g. CTV, Rogers Sportsnet, TSN and CBC). Once content rights to broadcast an event have been purchased, the broadcaster sells advertising to cover the costs of rights. Thus the ability to attract desirable and sizeable audience segments is essential for selling the advertising time around telecasts (Chalip et al, 2000; Shoham & Kahle, 1996). Ratings, measured as a percentage by Nielsen Media Research, are used to assess audience size in Canada and the United States. The higher the ratings, the higher the revenue a broadcaster can earn from the sport (Chalip et al, 2000).
In examining trends in rights fees and ratings, a surprising result emerges. While rights fees have increased, television ratings for all the major professional sports leagues in North America, including the NHL, have declined noticeably over the past decade (Sandomir, 2004).
Over the course of the NHL’s recent six-year TV deal with ABC/ESPN (1999–2004), regular-season cable ratings decreased 31% on ESPN and 38% on ESPN2, with network broadcast ratings on ABC also slipping 21% over that period (The Sports Network, 2005). Furthermore, the ratings demonstrate that the National Basketball Association (NBA) and professional basketball have been and are clearly outperforming the NHL and professional ice hockey. In 2002–03 the NBA had ratings of 1.2 (ESPN), 2.6 (ABC) and 6.5 (NBA Finals) as compared to the NHL with 0.46 (ESPN regular season), 1.1 (ABC) and 2.9 (NHL Finals). In all three cases, the NBA drew at least double the viewership of the NHL (Sandomir, 2004). In recent years, this gap has continued to widen (The Sports Network, 2005; Soloman, 2005).
The comparison to the NBA is important for the NHL, as the NBA is often considered its closest competitor—they are of similar size and scope, have similar schedules at the same time of year and have experienced similar growth patterns. Therefore, it could be said that the NHL is underperforming in the televised media.
A nascent issue here is the impact of digital technology. Digitisation enables the combination of computing and broadcasting technologies and has been posited to be well suited to sport (Chalaby & Segell, 1999; Barnard, 1996; Wolfe et al, 1998). For example, horse-racing (Kruse, 2002), basketball (Silver & Sutton, 2000) and Formula One (Dransfeld et al, 1999) have all dabbled in some form of digital web-enabled television, a delivery paradigm that is forecast to be important to sport for years to come (Turner, 1999). Stakeholders in the ice hockey industry also understand the importance of new media, as shown by the Shanahan Summit (2004), where players, coaches, administrators and broadcasters made recommendations for the future of ice hockey, including those related to television. Indeed, careful consideration by any sporting organisation is needed when deciding upon new technologies, as these opportunities are extended with increasingly incalculable risks (Chalaby & Segell, 1999).
OVERVIEW OF KEY MEDIA TECHNOLOGIES
Preliminary consultation with experts (Peddie, 2004; Anselmi, 2004) and the literature revealed five major media technologies with the potential to impact upon televised sport: VOD, PVRs, MMDs, iTV and HDTV.
Video on Demand (VOD)
Ling et al (1999) describe VOD as “a technology through which video material can be ordered and retrieved over the traditional telephone lines from a central server”. In essence, the viewer determines the viewing schedule, deciding which programmes (“televised products”) should be broadcast at any given time. The benefits of VOD are accrued by broadcasters, who can charge premium fees from advertisers privy to a targeted and distinct market, independent of time constraints.
For televised ice hockey, the impacts of VOD are debatable. First, the marginal targeting implications of VOD are quite small compared to other televised properties, as it is already widely known that the majority of ice hockey viewers are adult males (McDaniel, 2005) and the majority of ice hockey broadcasts are in prime time. Second, and more importantly from a revenue-generation standpoint, VOD customers may disapprove of commercials during programming that they have paid a premium to view during specified timeslots.
Personal Video Recorders (PVRs)
PVRs are an intermediary between the cable signal and the TV that store televised content on hard drives capable of holding anywhere from 10 to 30 hours of programming. One of the features of PVR is the ability for viewers to bypass advertising by “zipping” through the commercial using the fast-forward button (Elphers et al, 2003) or by evading entire commercial sections using an auto-skip feature that automatically records content commercial-free (Williamson, 2001). Poniewozik (1999) cites three additional viewer-centric benefits to PVRs, namely: (i) the ability to choose shows by name rather than channel or time (similar to VOD); (ii) the ability to rewind/replay/pause while recording; and (iii) the absence of a videotape-like storage medium (as compared to traditional VCRs).
Mobile Multimedia Devices (MMDs)
MMDs are a new breed of consumer information and entertainment platforms, which include personal digital assistants (PDAs) and cellular phones. Coined by Apple, PDAs were originally used to support clerical tasks such as note-taking, contact list maintenance and diary-keeping (Daniels, 1994) but they are now evolving into multimedia-oriented devices. Although TV is not widely consumed on PDAs, recent developments in the field may allow for digital TV to be broadcast on these small devices (see Royal Philips Electronics, 2005). Conversely, a more rapid convergence with TV has taken place in the cellular industry. Many common televised products such as news, sports clips and weather forecasts can be broadcast to a customer anywhere. Broadcast partners in this service include ESPN, CNN, Fox Sports, the Weather Channel and NBC. Recently, Bell Canada and Rogers Wireless advertised their mobile video coverage of the 2006 NHL Stanley Cup playoffs and the 2006 FIFA World Cup respectively. Worldwide revenues for FIFA in the latter case were in the tens of millions and distribution spanned 100 countries (Masters, 2006)….
The Canadian Radio-Television and Telecommunications Commission (2002b) describes iTV as: “services [that] require two-way communication between the viewer and the distributor or content provider. This two-way communication is composed of a traditional ‘downstream’ signal from the distributor or content provider and ‘upstream’ or ‘return-path’ information from the viewer to the distributor or content provider.” Broadcasters are interested in this two-way transaction because it allows for highly personalised interactions and appeals (Gladden et al, 2001; Dransfeld et al, 1999) that might lead to emotional loyalty (Rozanski et al, 1999). To date, there is no real consensus on the benefits of iTV to sport. Bernie Ecclestone, sole owner of the rights to promote Formula One, indicated that he was convinced viewers would pay significant sums of money to be able to call up statistics, choose camera views in real-time and play interactive games (Dransfeld et al, 1999). In contrast, some literature suggests that the upward communication capabilities of iTV are still somewhat lacking, and escaping these limitations still requires interaction with one’s computer or mobile phone (Puijk, 2004).
High Definition Television (HDTV)
For the past 40 years, television signals in North America have ascribed to the North American Television Systems Committee (NTSC) standard, which uses analogue signals for production, transmission and display. Table 10 high-lights the technological differences between NTSC and the newer standard of HDTV.
As Table 10 outlines, transmission signals can be scanned either interlaced (i) or progressive (p). Conventional analogue televisions use the interlaced method, which paints every other line in one pass and all other lines in the following pass. Each frame is sent as two fields; one with odd-numbered scanning lines (A) and the other with even-numbered lines (B). In a progressive scanning system, all lines of the frame are scanned sequentially and sent as a single frame, all of which is completed in the same time that interlaced scanning requires to send only one field (A or B). HDTV allows for both methods, while NTSC only allows for interlaced scanning. In addition, for each pixel in a conventional television, HDTV has 4.5, resulting in superior picture clarity, notable especially in televised products with small objects or subjects apt to blurriness. HDTV is also endowed with Dolby Digital surround-sound to provide vibrant and realistic acoustics that account for the foreground and background in addition to left and right partitions.
Table 11 summarises the five technologies reviewed.
DIFFUSION OF INNOVATION
In general, an organisation’s decision to adopt a media technology relies not only on the functional characteristics of that technology but also on target consumers’ current and forecast purchases of related products. Functional superiority and consumer adoption are usually correlated, but not always. From a consumer perspective, the process of innovation adoption is asymmetric (Rogers, 1995). Different consumers will purchase new products at different times relative to the product’s initial release into the market and consistent with their personal frame of reference (Kirton, 1976; Goldsmith & Hofacker, 1991; Rogers, 1995). A foundational model to explain such phenomena is offered by Bass (1969). In this model, cumulative adoption is plotted against time, where adoption is explained partially by internal influence (word of mouth) and external influence (mass media communication). The result is a logistic function that profiles diffusion as beginning slowly and growing at an increasing rate, followed by increased growth at a decreasing rate, and then finally by a peak and then recession (Lekvall & Wahlbin, 1973; Bass, 1969). In empirical demonstrations (including black and white television sets), the rigour of the Bass (1969) model has been established and is used later in this case to forecast consumer adoption.
OBJECTIVE
The objective of this case study is to demonstrate the importance of forecasting media technologies to managers and marketers in sport and, in turn, to provide them with direction in their media technology decisions.
….
Table 10 NTSC and HDTV Specifications for Broadcast
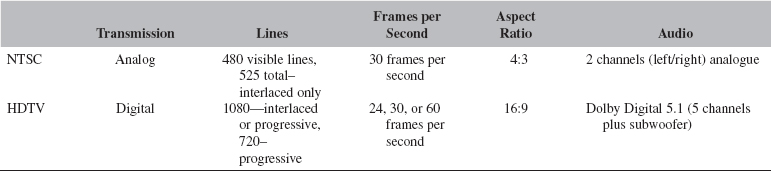
Source: International Journal of Sports Marketing and Sponsorship. Used with permission.
Table 11 Comparison of Five Media Technologies
| Media Technology | Key Viewing Characteristics | Potential Impact on Televised Sports Products |
Video on Demand (VOD) | Viewing convenience (time) | Targeted advertising, relaxed competition for timeslots, pay-per-view payment model |
Personal Video Recorders (PVRs) | Viewing convenience (time, advertising bypass, replay) | Advertisement disputes, relaxed competition for timeslots |
High Definition Television(HDTV) | Sharper image, wider screen, built-in surround sound | Increased sports visibility with higher resolution, less panning—easier to follow action, product enhancing—sharper image/better sound |
Mobile Multimedia Devices (MMDs) | Viewing convenience (geography), small size, motion quality | Highlights and box scores available on demand, additional decreased sharpness and content rights revenues |
Interactive Television (ITV) | Viewer participation, viewing customization | Player statistics available on demand during game, personalized interactions, customized camera angles |
Source: International Journal of Sports Marketing and Sponsorship. Used with permission.
RESULTS
‘Hockey Night in Canada’: Review of Televised Hockey Diffusion in Canada
During February 2004, 187 NHL games were played (approximately 6.45 games per day); 65 were broadcast nationally and 205 regionally. Interestingly, only 43% of the nationally broadcast games involved at least one Canadian-based NHL team (n 26 games). Of the 187 games, 150 were broadcast on major networks….
[A]s a percentage of total broadcasts, CBC broadcasts the most games involving Canadian teams (100% of its total broadcasts). Furthermore, … 32% of the major broadcasts (including national and regional broadcasts) involved Canadian teams. This suggests that it may be profitable for major networks to engage in the broadcasting of non-regional teams as demand may transcend regional barriers.
‘Flooding the Ice’: The Ice Hockey Environment and Media Technologies
Underlying the drive for technology examination in sport is the immense demand for the ice hockey product in Canada. Although Anselmi (2005) disagreed with hockey being the most consumed product in Canada by noting “there are probably 20 million cans of Coke [consumed] every day”, both Peddie (2005) and Hendren (2005) focused on the importance of ice hockey consumption, referring to the ice hockey product as the “undisputed emotional leader” and “part of the Canadian fabrique”. One can infer that in assessing the impacts of technology, both unit consumption and the significance of each unit consumed should be taken into account (especially when drawing comparisons between asymmetric product classes).
An early emergent theme in the interview sessions was the reciprocal relationship between media technology and professional ice hockey. That is, ice hockey viewership is a driving force behind media technology adoption in general (Peddie, 2005; Anselmi, 2005; Hendren, 2005; Shannon, 2005) and media technologies affect the way ice hockey can be, and is, consumed (Peddie, 2005; Anselmi, 2005; Hendren, 2005; McEwen, 2005; Shannon, 2005). Further to this point, each of the sports management experts commented specifically on this latter relationship with reference to television, suggesting a ‘first to mind’ association between media technology and the television medium. For example, Anselmi (2005) describes the relationship between ice hockey and television as enabling the distribution of the ice hockey product “outside the shell” of the arena, which he in turn related to the ability for growth demanded by shareholders.
Peddie (2005) supported this by noting: “Just the numbers will speak to that. We’ll get 19,000 to 20,000 [at the arena] sold out every night and at home we’re getting 350,000 locally and 1,300,000 plus [nationally] going to three million for the Stanley Cup. So you just touch more people [with TV].”
Hendren (2005) alluded to speciality channels and specifically to the current near-saturation status of sport channels. If this holds, then further addition, and therefore, fragmentation, of sports channels will yield only minimal returns, necessitating other means if sport organisations are seeking to grow through technology or its applications.
An important note is that in all of the general questions posed regarding media technology, sports management experts alluded only once to a non-television technology; ironically this was the website for Canada’s subscription sports channel (TSN—www.tsn.ca). This lends support to the selection of the five media technologies in question, as they are concerned with the visual aspects of ice hockey delivery versus the primarily audio and informational mediums such as satellite radio and the World Wide Web. In selecting one of the five media technologies, experts were unanimous in their assertions that HDTV would be the most influential (Peddie, 2005; Anselmi, 2005; Hendren, 2005; McEwen, 2005; Shannon, 2005; Hearty, 2005). Here, the experts specifically noted that while economic factors limited the initial adoption of HDTV, production and viewer-centric factors are becoming paramount in its rapidly increasing market adoption.
‘Cycling the Puck’: Market Forces and HDTV Adoption
The unanimity among experts was somewhat perplexing given that HDTV technology had been around for quite some time and that its adoption had been sluggish. When pressed further on their position, technology experts attributed this to the fact that the Canadian broadcast community continues to lag behind the United States (Hearty, 2005; McEwen, 2005) since, in the early days of HDTV, the Canadian Radio and Telecommunications Commission decided to allow market forces to determine when broadcasters should commence delivery of HDTV signals in Canada (Canadian Radio-Television and Telecommunications Commission, 2002a; Hearty, 2005; McEwen, 2005). By contrast, the Federal Communications Commission in the United States set a mandate that all U.S. broadcasters must use digital feeds by 2006, and subsequently, all televisions on the U.S. market must be capable of receiving these feeds by 2007 (Federal Communications Commission, 2002; Hearty, 2005; McEwen, 2005).
The impact of this decision on the HDTV landscape was a Canadian HDTV content void, as Hearty (2005) notes: “From an equipment perspective there is a twenty per cent increase in costs if using HD … the costs of talent are the same. HD will cost more for bandwidth so there is an incremental cost of carriage. Depending on quality standards of SD, the HD could be in the order of three to six times the cost.”
Without forced transition, Canadian content producers were reluctant to invest in the extra equipment, talent and bandwidth required for HDTV. This resulted in a Canadian content void such that the switch to HDTV will necessitate the importing of content from the United States or a radical shift towards producing Canadian HDTV content (Hearty, 2005).
From a demand perspective, Shannon (2005) noted the following with regards to the slow consumer adoption of HDTV: “… the viewer is not necessarily akin to change as much as we think. They are much more conservative in what they like than the people that create the entertainment … I’m not changing until I get tons of programming and I know the price is reasonable and won’t take my family vacation away”.
Indeed, Shannon asserts that the historic adoption of HDTV was equally hindered by the high initial price-point for related purchases (i.e. HDTV feed and HD-ready television). Combined with a long purchase cycle (Hendren, 2005), viewers chose to ride out high prices from HDTV equipment manufacturers and service providers that may perhaps have been enacted to cover the increase in production costs noted by Hearty (2005) and to tap into the lack of price sensitivity among innovative customers.
In summary, the technology experts reveal that a clearly superior core technology was jockeyed out of its market potential due to the circular requisites of broadcasters, producers and consumers (Shannon, 2005; Hearty, 2005; McEwen, 2005). On the one hand, relatively little content was being produced because of the lack of HDTV feeds and HDTVs purchased, while on the other hand, consumers were waiting for HDTV content prior to purchasing. Coupled with other extraneous factors such as a long purchase cycle and high costs of production, consumers were impervious to HDTV despite its clear dominance as a media technology. Thus the experts maintain their position that HDTV will be the most influential media technology for the ice hockey product.
They provided further support for this position by indicating that current markets are now shifting. We sought to explore this further since we know that current adoption of HDTV in Canada is approximately 1 million households (McKay, 2005). In the absence of readily available data for future adoption in Canada, we can adopt comparable data and forecasts from the US market which reveal dramatic HDTV sales increases in 2004, 2005 and 2006 (Yankee Group, 2004; Consumers Electronics Association, 2004; TWICE, 1999). From this data, a Bass model forecast was carried out, which determined that the Canadian market would peak sometime in 2007 at anywhere between 3 million and 5 million units. The experts generally supported this forecast, with only Hendren (2005) noting that it could be “a little longer”. Also, Peddie (2005) underlined the importance of the impact of dropping prices.
‘Power-Play’: Production-Centric and Viewer-Centric Advantages of HDTV in Ice Hockey
Ice hockey coverage is distinct from other sports for a variety of reasons, many of which broadcasters have struggled with, as Shannon (2005) describes:
“Of the big four [North American professional sports], you could create a graph of the live experience versus TV experience. The biggest gap in the ratio is hockey, as we don’t do as good a job with the sound of the game as we should [and] we do a terrible job with the speed of the game … and that is where we need to improve our focus—on telling the stories of the game. NBA does the best and there is no coincidence that basketball has the smallest playing surface. Hockey is the only sport with a physical barrier between cameras and the game … NBA puts camera positions ahead of seats, NHL does not.”
Unprompted, Shannon (2005) confirms the appropriateness of our comparison between the NHL and NBA, duly noting that the NBA is clearly outperforming the NHL because of the NBA focus on “telling the stories of the game”. Shannon (2005) further asserts two shortcomings of current NHL coverage in order of increasing deviation from the live experience: sound and speed; both were supported by other experts as areas that will benefit considerably from HDTV (Hearty, 2005; Anselmi, 2005; Peddie, 2005; McEwen, 2005). Specific to the issue of sound, HDTV surround-sound is able to provide viewers with a “true auditory experience of sitting in the stands with commentary and game sounds in the fore and arena clamor in the background” (McEwen, 2005). Although the issue of speed is likely to go unnoticed by avid fans and viewers (Peddie, 2005), it does play an important role in attracting new viewers. In this regard, Anselmi (2005) noted that speed was the primary complaint communicated by novice fans in non-hockey intensive markets: “… we don’t necessarily understand the game, we can’t really anticipate where the play is going to go next, we have trouble seeing the puck”. While the increased clarity of HDTV can partially remedy this through the decreased blurring of images (Mc-Ewen, 2005; Hearty, 2005), the wide aspect ratio allows for the reduction of several filming techniques that have made it difficult to follow televised ice hockey, as Hearty (2005) described: “Think about production values with sports for SDTV. SDTV is low resolution; you have to get in close—use long lenses and zoom in. Recognise it moves very fast in cases, so you are challenged, the more you move in the smaller the field you can capture. Cut, cut, cut or pan and zoom. Both techniques are used due to lack of resolution…. With HD you can pull back because of additional resolution, you don’t have to move the camera as much and don’t have to cut as much.”
In short, experts indicate that HDTV allows for decreased camera movement and switching commonly found in current NHL coverage, enabling the viewer to follow the puck in the same field of view more than in SDTV. Additionally, it allows viewers to see up-ice and follow players without the puck as plays materialise (Anselmi, 2005). Collectively, these improvements will allow the novice fan to follow the game more competently and the experienced fan to enjoy it more comfortably (Peddie, 2005; Anselmi, 2005).
‘Know Your Opponent’: HDTV against the Competition
In addressing HDTV in the context of the alternative media technologies, some experts commented on the projected behaviour of ice hockey viewers. In referring to Table 11, one might classify the five media technologies into two groups—those that allow for convenience (PVRs, VOD, MMDs) and those that directly affect the core viewing experience (iTV, HDTV). Experts noted the latter were more relevant to this analysis of the televised hockey product (Hendren, 2005; Anselmi, 2005). We agreed, as the legal aspects of PVRs (see Paramount Pictures Corporation vs. ReplayTV, Inc. & SonicBlue, Inc., 2001; Anselmi, 2005), the difficulties of a pay-per-view model as implicated by VOD and the degraded viewing quality of MMDs all pose barriers to adoption in the sport industry. Of the two remaining technologies, HDTV is an improvement (i.e. sound, aspect ratio, resolution) of a previously adopted viewing technology—NTSC, whereas iTV is essentially a convergence between television and the internet, which is not currently adopted in television viewing behaviours. Anselmi (2005) describes this divide:
“Over the last several years you’ve heard a lot about ‘interactive’—you know, it’s one of those buzzwords of the 90s that you get sick of. And I’m still not entirely convinced that people want to do that—generally … because I think people who watch TV are still kind of passive consumers. I mean, do you want to sit there and [interact] while watching a game? I don’t want to. If I really want the stats … I can go to leafs.com and figure out anything I want. It’s all there you know so do you really need to do that as part of the broadcast?”
This finding is consistent with previous diffusion studies, which found higher diffusion rates among technologies that were functionally similar to previously adopted technologies (e.g. Ettema, 1984) and, more specifically, projected sports as a driver of HDTV diffusion (e.g. Dupagne, 1999).
CONCLUSION
This case study demonstrates the importance of adopting expert consultation and forecasting techniques to assessing future impacts of media technologies on sport. Both practitioners and researchers must forecast and be cognisant of media technologies and related happenings in the marketplace. Importantly, this case reveals a six-stage procedure for this:
1. expert identification of potentially important technologies
2. background research and expert consultation to narrow the consideration set to the key technology (or two)
3. use of industry data to forecast the growth of that technology
4. expert understanding of that technology vis-a-vis market forces
5. expert identification of the advantages of that technology to the sport or interest, both for production and consumption
6. expert consultation to ensure that these advantages are sustainable through comparison to other competing technologies.
HDTV is identified as the most influential future media technology for the televised hockey product in Canada. This finding provides important direction to practitioners involved in ice hockey. Pertinent information for the future of ice hockey is also hypothesised for all five media technologies, with particular emphasis on HDTV. Practitioners need to understand all five technologies and support and plan for the adoption and diffusion of HDTV as a common technology in the mass market, as both the literature and the experts believe that all five are potentially impactful and that HDTV will provide greater benefit to the televised hockey product over other televised products. This is an important contribution as it suggests HDTV as a potential source of competitive advantage. In this regard, practitioners must not overlook two other findings: the potential impact of the certain arrival of iTV and HDTV convergence and our forecast that HDTV market adoption will pass the 25% benchmark in late 2007, at which point more than a quarter of all Canadian televisions will be HDTV. The latter is especially pressing as it provides a managerial deadline for adoption after which competitive advantage through adoption might dwindle
References
Anselmi, T. (2004) Personal Communication, Toronto, Canada, 8 November.
Anselmi, T. (2005) Personal Communications, Toronto, Canada, 3 January.
Barnard, P. (1996) Danger of a shotgun marriage, The Times, 12 June, 1–3.
Bass, F. M. (1969) A new product growth for model consumer durables, Management Science 15 (5), 215–227.
Boyd, T. C. & Mason, C. H. (1999) The link between effectiveness of ‘extrabrand’ attributes and the adoption of innovations, Journal of the Academy of Marketing Science 27, 306–319.
Canadian Broadcasting Corporation (2002) Olympic Hockey Ratings. Retrieved 10 April from: www.cbc.ca.
Canadian Cable Television Association (2001) Re: public notice CRTC 2001-62, call for comments on a proposed policy to oversee the transition from analogue to digital over-the-air television broadcasting. Retrieved 3 July from: www.ccta.com.
Canadian Radio-Television and Telecommunications Commission (2002) Broadcasting Public Notice CRTC2002-31. Retrieved 3 July 2005 from: http://www.crtc.gc.ca.
Canadian Radio-Television and Telecommunications Commission (2002b) Report on Interactive Television Services. Retrieved 30 March from: http://www.crtc.gc.ca.
Chalaby, J. & Segell, G. (1999) The broadcasting media in the age of risk, New Media and Society 1 (3), 351–368.
Chalip, L. & Leyns, A. (2002) Local business leveraging of a sport event: managing an event for economic benefit, Journal of Sport Management 16 (2), 132–158.
Chalip, L., Green, B. C. & Vander Velden, L. (2000) The effects of polysemic structures on Olympic viewing, International Journal of Sports Marketing & Sponsorship 2 (1), 39–57.
….
Consumers Electronics Association (2004) Digital cable ready HDTV sales to hit 1 million, TWICE 19 (13), 16.
Daniels, S. (1994) Personal digital assistants, Work Study 43 (2), 22–23.
Dransfeld, H., Jacobs, G. & Dowsland, W. (1999) Interactive TV and Formula One: a strategic issue for engine suppliers, European Business Review 99 (5), 292–299.
Dupagne, M. (1999) Exploring the characteristics of potential High Definition television adopters, Journal of Media Economics 12 (1), 35–50.
….
Elphers, J. L. C. M., Wedel, M. & Pieters, R. G. M. (2003) Why do consumers stop viewing television commercials? Two experiments on the influence of moment-to-moment entertainment and information value, Journal of Marketing Research 40 (4), 437–453.
Ettema, J. S. (1984) Three phases in the creation of information inequities: an empirical assessment of a prototype videotext system, Journal of Broadcasting 28 (4), 383–395.
Federal Communications Commission (2002) Review of the Commission’s rules and policies affecting the conversion to digital television. Retrieved 3 July 2005 from: http://www.fcc.gov/.
Gladden, J., Irwin, R. & Sutton, W. (2001) Managing North American major professional sport teams in the new millennium: a focus on building brand equity, Journal of Sport Management 15 (4), 297–317.
Goldsmith, R. E. & Hofacker, C. F. (1991) Measuring customer innovativeness, Journal of the Academy of Marketing Science 19 (3), 209–222.
Gruneau, R. & Whitson, D. (1993) Hockey night in Canada: sport, identities, and cultural politics. Toronto: Garamond Press.
Hearty, P. (2005) Personal Communication, Toronto, Canada, 26 January.
Hendren, G. (2005) Personal Communication, Toronto, Canada, 13 January.
Hockey Canada (2004) TV Ratings for Hockey Canada events in Dec/Jan, press release, 7 January.
….
Kirton, M. (1976) Adaptors and innovators: a description and measure, Journal of Applied Psychology 61 (5), 622–629.
Kruse, H. (2002) Narrowcast technology, interactivity, and the economic relations of space: the case of horse race simulcasting, New Media and Society 4 (3), 385–404.
….
Lekvall, P. & Wahlbin, C. (1973) A study of some assumptions underlying innovation diffusion functions, Swedish Journal of Economics 75, 362–377.
Levitt, A. (2004) Independent review of the combined financial results of the National Hockey League 2002–2003 season, report commissioned by the National Hockey League under the retention of the NHL legal counsel, published 5 February.
Ling, R., Nilsen, R. & Granhuag, S. (1999) The domestication of video on demand: folk understanding of a new technology, New Media and Society 1 (1), 83–100.
Masters, C. (2006) World cup kicking off with mobile video content. Retrieved 2 July 2006 from: http://www.hollywoodreporter.com/thr/international/article_display.jsp?vnu_content_id=1002613791.
McDaniel, S. R. (2005) Reconsidering the relationship between sensation seeking and audience preferences for viewing televised sports, Journal of Sport Management 17 (1), 13–36.
McEwen, M. (2005) Personal Communication, Toronto, Canada, 2 August. McKay, J. (2005) Canada lagging US in HDTV, Canadian Press, 7 March.
Mendez, H. Y. (1999) Virtual Signage: The pitfalls of ‘Now you see it, now you don’t’, Sports Marketing Quarterly 8 (4), 15–21.
Moore, J. N., Pickett, G. M. & Grove, S. J. (1999) The impact of a video screen and rotational signage systems on satisfaction and advertising recognition, Journal of Services Marketing 13 (6), 453–468.
Mullin, B. J., Hardy, S. & Sutton, W.A. (2000) Sports marketing. Champaign: Human Kinetics Publishers.
Paramount Pictures Corporation vs. Replay TV, Inc. & SonicBlue, Inc. (2001) United States District Court—Central District of California. Retrieved July 2, 2005 from: http://www.eff.org/IP/Video/Paramount_v_ReplayTV/20011031_complaint.html.
Peddie, R. (2004) Personal Communication, Toronto, Canada, 8 November.
Peddie, R. (2005) Personal Communication, Toronto, Canada, 3 January.
Puijk, R. (2004) Television sport on the web: the case of Norwegian public service television, Media, Culture & Society 26 (6), 883–892.
….
Poniewozik, J. (1999) Here come PVRs, Time Canada, 154 (13), 50–52.
Rogers, E. M. (1995) Diffusion of innovations (4th ed.). New York: The Free Press.
Royal Philips Electronics (2005) New Philips technology allows watching digital TV on small portable devices, press release. Retrieved 2 July from: www.philips.com/newscenter.
Rozanski, H. D., Baum, A. G. & Wolfsen, B. T. (1999) Brand zealots: realizing the full value of emotional brand loyalty, Strategy-Business (Booz Allen Hamilton) 17 (Fourth Quarter).
Sandomir, R. (2004) TV SPORTS; Ratings and Labor Woes Cloud NHL’s TV Talks, The New York Times, 24 February, D5.
Shanahan Summit (2004) Shanahan Summit Recommendations, press release, 8 December.
Shank, M. D. (2002) Sports marketing: a strategic perspective. Upper Saddle River: Prentice Hall.
Shannon, J. (2005) Personal Communication, Toronto, Canada, 5 January.
Shoham, A. & Kahle, L. R. (1996) Spectators, viewers, readers: communication and consumption communities in sports marketing, Sports Marketing Quarterly 5 (1), 11–19.
Silk, M., Slack, T. & Amis, J. (2000) Bread, butter, and gravy: an institutional approach to televised sport production, Culture, Sport, Society 3 (1), 1–21.
Silver, A. & Sutton, W. (2000) An interview with Adam Silver, President and Chief Operating Officer, NBA Entertainment, International Journal of Sports Marketing & Sponsorship 2 (2), 101–110.
Soloman, G. (2005) The NHL could learn a few things from the NBA, The Washington Post, 26 June, E02.
Street & Smith’s Sports Business Journal (2003) Year of the Rights Deal, 7 February.
The Sports Network (2005) The NHL has lost its only remaining U.S. cable TV rights holder, press release, 1 June.
Turner, P. (1999) Television and the Internet convergence: Implications for sports broadcasting, Sports Marketing Quarterly 8 (2), 43–51.
TWICE (1999) HDTV Sales are seen at 2M by 2005, TWICE 14 (22), 4–5.
Whitson, D., Harvey, J. & Lavoie, M. (2000) The Mills Report, the Manley Subsidy Proposals, and the business of major league sport, Canadian Public Administration 43 (2), 127–156.
Williamson, R. (2001) Content cutbacks endanger broadband growth. Retrieved July 2, 2005 from: http://www.eweek.com/print_article2/0,1217,a=17828,00.asp.
Wolfe, R., Meenaghan, T. & O’Sullivan, P. (1998) Sport, media and sponsor—The shifting balance of power in the sports network, Irish Marketing Review 10 (2), 53–66.
Yankee Group (2004) Sales of high-definition TV sets expected to grow rapidly this year, industry report, 16 March.
REGIONAL SPORTS NETWORKS
REGIONAL SPORTS NETWORKS, COMPETITION, AND THE CONSUMER
Diana Moss
I. INTRODUCTION
In an economy increasingly characterized by complex business relationships, Regional Sports Networks (RSNs) are no novelty. There are now about 40 such entities in the U.S., the oldest of which is the Madison Square Garden Sports Network (MSG). Launched in 1969, MSG offers programming for the New York Knicks (NBA), New York Rangers and Buffalo Sabres (NHL), New York Liberty (WNBA), and New York Red Bulls (MLS).1 Arguably, the centerpieces of the RSN industry in the U.S. are the two large, rival families of RSNs controlled by Comcast SportsNet (CSN) and Fox Sports Net (FSN).2 CSN operates eight [now 11] RSNs while FSN controls almost 18 [now 19] networks that offer sports programming for a variety of individual U.S. cities and regions.
The prominent role of media in sports likely accounts for the ownership interests of multi-channel video programming distributors (MVPDs) in many RSNs. MVPDs include cable and Direct Broadcast Satellite (DBS) providers. RSNs are hugely profitable, with margins estimated at 30 to 40 percent and average fees of $2 per subscriber, second only to the Entertainment and Sports Programming Network’s (ESPN) fees of $2.50 per subscriber [and currently approximately $4.00].3 In the recent acquisition of Adelphia cable assets by Time Warner and Comcast, Federal Trade Commission Commissioners Leibowitz and Jones Harbor noted that “RSN programming… is a unique product, of tremendous value to a certain segment of consumers, and thus access to it is crucial to cable and satellite providers’ ability to remain competitive.”4
Comcast and Fox have aggressively pursued the formation of RSNs around the country, often vying with each other for control of key markets. For example, Fox has recently ceded RSN markets in Chicago, the Bay Area, New England, and New York to CSN and entered other markets in Southern California, Arizona, Houston, Indiana, and Kansas. Both CSN and FSN have purchased a number of formerly independent RSNs. Strategic competition also appears to play a large role in the RSN industry. For example, News Corporation, parent of FSN West, purchased the Los Angeles Dodgers (MLB) in 1998 with the alleged purpose of discouraging Disney (which then owned ESPN and the Anaheim Angels (MLB)) from launching its own RSN—ESPN West.5
Competition between RSNs in bidding for team media rights and in negotiating with MVPDs for distribution is often quite fierce. A number of independent RSNs have been outbid by the larger incumbents, CSN and FSN, in their attempts to purchase the media rights to specific teams. The Grizzlies Regional Sports Network, for example, was formed to carry the programming for the Memphis Grizzlies (NBA) but folded before its first scheduled game because the team re-signed with FSN South.6 And the Victory Sports channel, owned by the Minnesota Twins (MLB), collapsed in 2004 after less than six months on the air because the Twins failed to negotiate deals with local area cable or DBS distributors.7 Twins programming returned to the local FSN network.
Vertical relationships involving sports-related multi-video programming (MVP) link up the media rights holders (i.e., the teams) with the RSN, which purchases the rights to transmit the events. The RSN then coordinates with and jointly markets the programming to MVPDs who offer it in turn to subscribers in the form of sports channels and other premium sports packages. These relationships can range from ownership through merger or acquisition, to contractual agreements with exclusive terms and conditions, to simple buyer-seller relationships.
Partial ownership structures are common for RSNs. For example, Comcast has a 20 percent ownership interest in SportsNet Chicago (which replaced the defunct FSN Chicago), along with Cubs (MLB) owner the Tribune Company (20 percent share) [Ed. Note: now Tom Ricketts, who owns a 25 percent share] and the White Sox (MLB) and Bulls (NBA) owner, Jerry Reinsdorf (40 percent share). The CSN Bay Area is jointly owned by Comcast (45 percent), Fox (30 percent), and the San Francisco Giants (25 percent). Other RSNs are joint ventures that do not include MVPD ownership. The New England Sports Network (NESN), for example, is a joint venture between the Boston Bruins (NHL) and Red Sox (MLB)….
RSNs raise threshold competition policy issues because of the unique structure of the markets involved. Rivalry at one or more levels in the chain of vertical integration involving sports teams, RSNs, and MVPDs is often limited, if not nonexistent. Under these circumstances, changes in control that create or strengthen vertically-integrated content/distribution platforms warrant a rigorous level of scrutiny by antitrust and regulatory agencies.
This article sets forth the various scenarios for vertical arrangements involving RSNs that potentially raise competitive and consumer problems. Central to the analysis are the unique issues surrounding the demand for sports programming and market definition surrounding those markets. This article also notes that while there are no antitrust exemptions involving relationships between professional league sports and MVPDs, other sports-related immunities might be argued to apply to RSNs.
Fact situations in RSN markets can vary substantially, so there are no simple answers to the foregoing questions. But it is possible to frame the major questions they raise for competition policy. The article proceeds in Section II with some brief background material on markets for sports MVP. Section III then discusses potential horizontal and vertical competitive issues that may arise in such markets. Section IV considers important questions that are specific to markets for sports MVP that can bear on antitrust analysis. Set forth in section V is a discussion of the applicability of certain sports-related immunities to RSNs and MVPDs. The article concludes with a discussion of the implications that competitive issues surrounding sports MVP markets have on antitrust and regulatory policy.
MARKETS FOR SPORTS MVP
There are a number of possible scenarios involving markets for local sports programming. Two scenarios, however, are most likely to be encountered. One scenario is a single, unintegrated RSN in the upstream media rights market and competing cable and/or satellite providers in the downstream MVPD market (Figure 2). A second scenario (Figure 3) involves multiple, unintegrated upstream RSNs and competing downstream MVPDs. Figures 2 and 3 indicate the relationship between the RSN and MVPDs in the downstream market and the individual teams and the RSN in the upstream market. In either case, an unintegrated RSN markets programming to both the local cable and DBS providers, although it could have an exclusive arrangement to market programming to only one MVPD.9 Also note that the figures assume that consumers choose one mode of MVP distribution, but nothing precludes sports enthusiasts from subscribing to both cable and DBS services, if they are available.
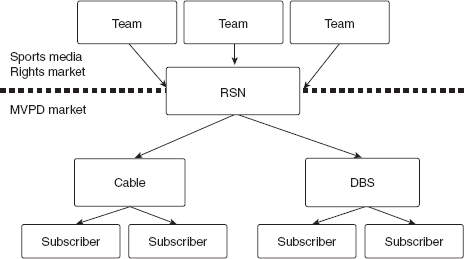
Figure 2 Single RSN and Rival MVPDs
Source: Loyola Consumer Law Review. Used with permission.
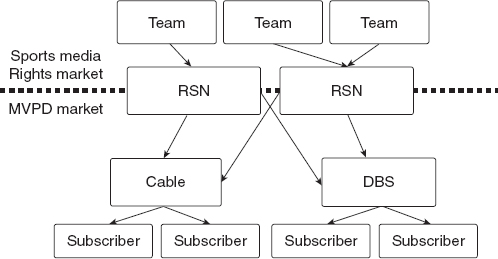
Source: Loyola Consumer Law Review. Used with permission.
As for the relationships in the upstream market, Figure 2 indicates that an RSN purchases the media rights for one or more local professional teams. This relationship best describes, for example, CSN Chicago, which handles programming for the White Sox, Cubs, Bears (NFL), Bulls (NBA), Blackhawks (NHL), and Fire (MLS). The FSN West and FSN Prime Ticket serve the Southern California market, collectively covering a vast array of teams, including: the Clippers (NBA), Lakers (NBA), Angels (MLB), Dodgers (MLB), Ducks (NHL), Sparks (WNBA), Kings (NHL), Chivas (MLS), and Galaxy (MLS).
Figure 3 shows the scenario involving multiple RSNs that market programming for different combinations of teams or sports in the same geographic area.10 For example, the Rocky Mountain region hosts both the Altitude Sports and Entertainment Network (ASE), which carries programming for the Nuggets (NBA), Avalanche (NHL), Rapids (MLS), and Mammoth (NLL). Rival FSN Rocky Mountain carries the Broncos (NFL), Rockies (MLB), and Mammoth.
The scenario shown in Figure 3 prompts a number of questions. One is the extent to which consumers have access to both cable and DBS modes of MVPD, since different RSN programming can be carried on rival MVPD providers. The ability of consumers to switch MVPD providers in response to programming prices, content, and quality is an important feature in markets with multiple RSNs. DBS continues to be slightly less available in certain markets that are served by cable. In 2002 the Federal Communications Commission estimated that 88 percent of cable subscribers also had access to DBS, up by 12 percent from 2001.11 Cable penetration rates, however, have declined over time—falling to a 17 year low of about 61 percent in February 2007.12 Most of this share was given up to DBS. Between 2004 and 2005, for example, DBS subscribership increased by almost 13 percent.13 In 2005, DBS accounted for about 28 percent of all U.S. MVP subscriptions.14
Another question is the extent of competition in the upstream market for sports media rights, which arguably influences the number of RSNs that potentially operate in any given region. Table 12 lists U.S. RSNs that carry programming for professional sports and the regions they cover as of the writing of this article. There are a total of 15 RSNs nationwide, serving 28 regional markets. Seven markets contain two or more RSNs, including: New York City (three), Kansas City (two), the Mid-Atlantic region (two), Ohio (three), New England (two), the Rocky Mountain region (two), and the Northwest (two). The remaining 21 markets contain only one RSN.15
Potential “overlaps” in RSN programming are greater in large cities that can support more than one same-sport team or that contain a large enough number of professional sports teams to support multiple RSNs. For example, New York City hosts both the Yankees Entertainment and Sports Network (YESN) that covers the Yankees (MLB) and SportsNet New York (SNY), which carries the rival Mets. The Mid-Atlantic region also hosts multiple RSNs. The Mid-Atlantic Sports Network (MASN) carries programming for rival MLB teams the Orioles and Nationals as well as the Ravens (NFL). The CSN Mid-Atlantic carries the Redskins (NFL), Wizards (NBA), Capital (NHL), D.C. United (MLS), Bayhawks (NLL), and Mystics (WNBA).
Because the demand for sports programming is driven in large part by fan loyalty, however, it is not clear to what extent RSN packages actually compete, despite the apparent choices in programming that are evident in many of the markets served by multiple RSNs.
Table 12 Regional Sports Networks (RSNs) in the United States
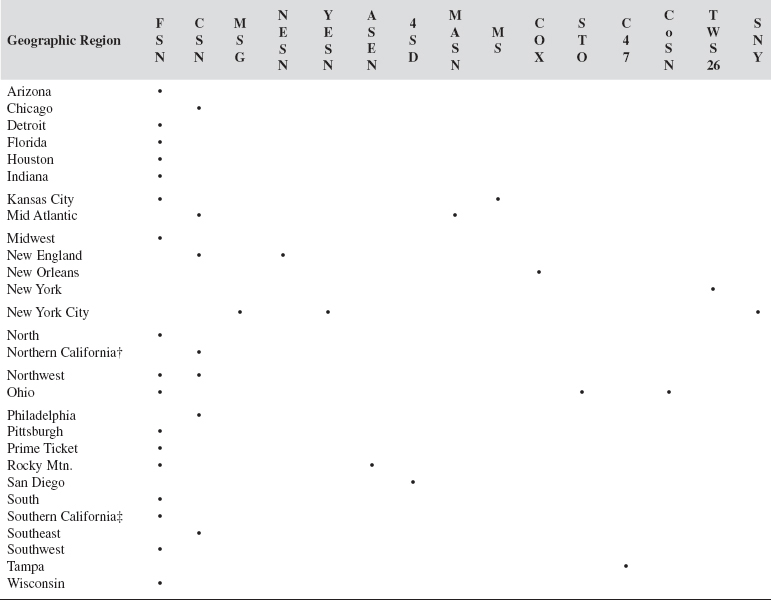
Key to Abbreviations:
FSN = Fox Sports Net; CSN = Comcast Sports Net; MSG = Madison Square Garden Network; NESN = New England Sports Network; YESN = Yankees Entertainment and Sports Network; ASEN = Altitude Sports and Entertainment; 4SD = Channel 4 San Diego; MASN = Mid-Atlantic Sports Network; MS = Metro Sports; COX = Cox Sports; STO = SportsTime Ohio; C47 = Catch 47; CoSN = Columbus Sports Network; TWS26 = Time Warner Sports 26; SNY = SportsNet New York.
†Includes CSN West and CSN Bay Area Networks
‡Includes FSN West and FSN Prime Ticket
Source: Loyola Consumer Law Review. Used with permission.
Note: ESPN is not included in the table because it is a national sports network.
COMPETITIVE ISSUES INVOLVING RSNS AND MVPDS
Mergers or contractual agreements involving RSNs and MVPDs can fundamentally alter the incentives and abilities of market participants, potentially affecting prices, output, choice, and innovation in both programming and distribution. While the focus here is primarily on vertical arrangements, it is helpful to review the horizontal issues that can arise in RSN and MVPD markets.16 For example, does the aggregation, coordination, and joint marketing function performed by a single RSN eliminate competition in the upstream media rights market? If it does, then the RSN could restrict programming output and raise prices to MVPDs. The answer to this query, of course, largely depends on whether individual team programming competes for the viewership of local fans or, in the alternative, whether the RSN performs a valuable economic integration function for a series of individual team “monopolies,” each with no good substitutes.
Mergers of either MVPDs or RSNs also have horizontal effects. In Figure 3, for example, the merger of two independent RSNs could produce a more powerful entity with a greater ability to make demands on downstream MVPDs. This includes placement on an MVPD’s standard tier and/or a per customer charge that would be passed on to subscribers. The rumored combination of the YESN and NESN in 2004 potentially raised this issue.17 A merger of unintegrated local cable providers that creates significant market share, on the other hand, might enhance buyer market power. The likely competitive effects of these scenarios depend on a variety of factors, including the structure of upstream and downstream markets, the degree of vertical integration, consumer preferences, and any relevant efficiencies. The preponderance of vertical integration involving RSNs (e.g., joint-ownership by teams and MVPDs), however, bears strongly on competitive judgments involving horizontal integration such as the merger of two cable companies.
Vertical integration or contractual arrangements that mimic a merger between RSNs and MVPDs pose the classic double-edged sword for competition and consumers—the balancing of efficiencies against potentially restricted output, higher prices, reduced choice, and less innovation resulting from the exercise of market power. There are three potential categories of economies that might result from such integration. One is lower transactions costs for the merged firm due, for example, to: (1) eliminating price negotiations for certain services and (2) avoiding the haggling between stakeholders about how to divide the proceeds of sports media productions. A second source of savings is investment in equipment that can be used in joint production of sports and non-sports programming. Finally, integration can eliminate double margins (i.e., successive markups) associated with imperfectly competitive up and downstream markets.
At the same time, consolidation that creates a vertically-integrated content/distribution platform or exclusive agreements involving an unintegrated RSN and MVPD can have potentially anticompetitive effects.18 For example, consider a merger between the RSN and cable provider in Figure 2. Such a combination potentially creates the ability and incentive for the firm to adversely affect market outcomes by foreclosing the rival DBS supplier from access to RSN programming (i.e., input foreclosure) or to engage in conduct that would otherwise raise its rival’s costs by charging more for programming or lowering the quality of such programming in a way that could inhibit the MVPD’s ability to compete.19 A merger or exclusive agreement between an RSN and DBS supplier in Figure 3 poses the additional possibility that the merged entity could deny or frustrate the rival RSN access to placing programming on its MVP system (i.e., customer foreclosure).
The foregoing types of input and customer foreclosure or raising rivals’ costs strategies are typically considered in vertical arrangements involving upstream input and downstream output suppliers.20 The integrated firm’s ability to foreclose or raise rivals’ costs stems from the control of RSN programming. Incentive turns on whether frustrating or denying access is a profitable strategy. For example, the integrated or contractually-related firm must offset the lost programming revenue from rival MVPDs with a revenue gain from its own sales of sports programming at supracompetitive prices. This cost/benefit analysis depends on the structure (i.e., market shares and concentration) in upstream and downstream markets.
Consider now a merger of the two cable providers (one with an existing interest in an RSN) in Figure 4. Such a combination might increase the firm’s incentive to adversely affect market outcomes. With a greater share of the downstream MVPD market, the merged company might find it profitable to deny or frustrate the rival DBS supplier’s access to the programming of its integrated RSN affiliate or otherwise raise its costs, thus impairing the firm’s ability to compete in the downstream market. Alternatively, the larger post-merger MVPD might have more incentive to foreclose the competing RSN from access to the merged company’s MVPD as a customer.
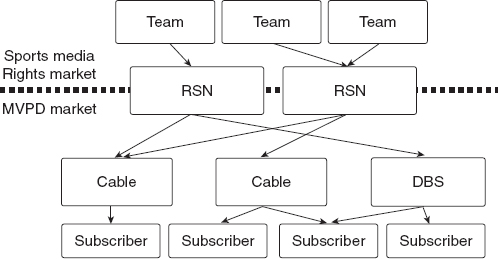
Figure 4 Rivals RSNs and Multiple, Rival MVPDs
Source: Loyola Consumer Law Review. Used with permission.
Likewise, the merger of the two competing RSNs in Figure 4 (one with an existing interest in a MVPD) could increase the ability of the merged entity to adversely affect market outcomes. With a control over all RSN programming in the market, foreclosure of the rival MVPD is more viable.
The exclusionary conduct embodied in foreclosure is problematic because it narrows the field of options for rivals in their respective markets. Depending on the type of fore-closure, such diminished competition can increase the prices at which RSN programming is sold to MVPDs and/or those charged to subscribers of MVP services.
Consumers’ ability to switch to competing MVPDs to avoid subscription price increases or degradation in programming quality is a key factor in determining whether mergers or exclusive agreements involving RSNs and MVPDs can harm consumers. These issues have arisen in a number of cases, including the Federal Communication Commission’s decision in Fox’s proposed acquisition of DirecTV21 and the Federal Trade Commission’s investigation into Comcast and Time Warner Cable’s proposed acquisition of the cable assets of Adelphia.22
IMPORTANT FACTORS IN EVALUATING COMPETITIVE ISSUES
Competition analysis under both antitrust and regulatory standards typically looks at a number of factors: market definition and structure (i.e., market shares and concentration), competitive effects, the role of entry, and merger-related efficiencies. Two of these factors are likely to stand out in assessing competitive outcomes in sports-related MVP—market definition in upstream media rights and downstream MVPD markets and the role of consumer-related efficiencies.
Market Definition
Market definition is the first and often most important step in antitrust analysis. A “relevant” market for antitrust purposes is the smallest group of products (in a geographic area) that consumers could switch to in order to avoid a price increase by a “hypothetical” monopolist. Market definition therefore asks what products consumers view as good substitutes. If consumers can switch to other available products, then it would be harder for any single seller or group of sellers to profitably increase prices.23 Applied in the RSN context, the question of market definition centers on how MVPDs are likely to view programming for different local teams marketed by an RSN.
For example, is programming for the local baseball team a good substitute for local hockey? Is programming for one local baseball team a viable substitute for a rival local baseball team, as in the case of the Yankees and Mets in New York or the Dodgers and Angels in Southern California? If not, then the media rights for each team are effectively individual monopolies and joint marketing would not eliminate competition.24 Alternatively, if programming for individual teams offered by an RSN does compete for the viewership of local fans, joint marketing through an RSN eliminates such competition and could result in restricted or lower quality programming and higher prices to MVPDs.
Decisions in a number of antitrust cases, including USFL v. NFL, indicated that the most important sports constitute separate markets.25 Under such circumstances, an RSN such as CSN Chicago that coordinates the rights for multiple different-sports teams may not raise competitive concerns. However, RSNs like MASN and FSN West that jointly market the rights of the rival Orioles and Nationals and the Dodgers and Angels, respectively, may be problematic.
In downstream markets, the relevant antitrust question is how MVP subscribers view RSN products offered through different MVPDs. For example, do consumers consider different RSN channels and packages sold by local cable and satellite providers to be effective substitutes? This may be the case in the larger metropolitan areas that host the multiple RSNs shown in Table 12. And in what instances do sports channels compete with other forms of non-sports premium programming? In downstream markets, the FTC has made both of the foregoing determinations—i.e., that premium sports channels comprise a market and that premium pay television programming comprises the relevant market.26
Based on the foregoing, consolidation of RSNs in a “premium sports channel” market could pose competitive problems while under a broader market definition (e.g., all premium pay programming), it would not. Market definition is, and will likely continue to be a controversial part of competitive analysis involving sports-related MVP, particularly with ongoing changes in how sports programming is marketed, with larger numbers of channels offered in basic packages and sports and non-sports programming bundled together as part of premium services.
Consumer Issues
Because of the intense popularity of and role of fan loyalty in driving demand for sports programming, the competitive analysis of sports-related MVP is likely to consider other factors that could bear on enforcement decisions involving integration or contractual relationships. First, MVP subscribers may place a higher value on convenience and quality than they do on price. This characteristic of consumer demand creates tensions for the desirability of certain market structures that would be achieved through mergers or agreements involving RSNs and MVPDs. For example, fans might willingly pay a supracompetitive price to avoid the service interruptions that could occur because of disruptive bargaining. Such problems could arise between rival RSNs over the media rights to individual or groups of teams or between multiple RSNs and MVPDs in a geographic market.27 Under the foregoing circumstances, arrangements or outcomes that place local sports programming with a single RSN could provide benefits to consumers.
Second, placing RSN’s sports programming with an MVPD in an exclusive arrangement could arguably allow the firms to differentiate themselves from a competing sports content/distribution (i.e., RSN/MVPD) platform in the market. This type of “systems” competition could allow rival RSN/MVPD platforms to compete more effectively.28
Both of these potential pro-consumer scenarios involving vertical relationships between RSNs and MVPDs should, however, be considered in light of the fact-patterns in specific cases. For example, horizontal integration between MVPDs (as in the case of Comcast/Time Warner/Adelphia), if superimposed on exclusive arrangements between un-integrated RSNs and MVPDs may renew or intensify the bargaining over the share of profits that are divided between the various stakeholders. This increases the likelihood of service disruptions that inconveniences fans and viewing audiences.
Multiple offerings between rival RSNs, each with exclusive agreements with cable and DBS providers, could also force consumers to invest in different or additional equipment and pay for bundled packages that include redundant sports programming.29
The weight given to the foregoing considerations in antitrust analysis will depend largely on the magnitude of potential competitive harm raised by various transactions. More competition in popular sports channels and packages offered through RSNs is very much in the interest of MVPDs who—given strong viewership for the team-specific programming that is offered by different RSNs—would find ready customers. Moreover, promoting competition at both the RSN and MVPD levels is likely to ensure that prices are low, and that consumers are afforded choice in sports-related programming.
APPLICABILITY OF ANTITRUST EXEMPTIONS RELATING TO PROFESSIONAL LEAGUE SPORTS
There are no specific antitrust exemptions involving professional league sports and MVPDs. Nonetheless, another source of controversy in the RSN debate may be whether antitrust immunity afforded league sports in certain contexts should apply to RSNs.30 For example, professional baseball has the benefit of a court-created exemption which extends to franchise relocations and other conduct that is the “business of baseball.”31 Arguments that the provisions of the Sports Broadcasting Act (SBA) of 1961 may exempt RSNs may also surface in the debate. The SBA exempts from antitrust scrutiny any league that “sells or transfers all or part of the (broadcast) rights of the league’s member clubs.”32
While the applicability of the baseball exemption outside the player market is still unresolved by the courts, it is likely that the exemption would not easily be extended to the joint marketing activities of RSNs. Several attempts to apply the baseball exemption to media have failed.33 The exemption does not cover arrangements that are designed to protect or increase the profits of a particular team owner or when the controlling entity (the RSN) is not a baseball team engaged in the business of baseball.34 Arguably, the joint marketing of rights through RSNs is no more the business of baseball than is running a parking lot adjacent to the stadium.
The broadcast exemption is also not easily extended to RSNs. Here again, several attempts to expand coverage of the SBA to MVPD have failed.35 The SBA deals with collective sales of rights or joint contracting by a league, not to sales of individual rights by local team owners or to the resale of rights by a rights purchaser (e.g., an RSN). Moreover, major federal cases have construed the applicability of the SBA to “sponsored telecasting” to apply narrowly to over-the-air television broadcasting. This means it would not affect negotiations with cable or satellite providers by entities controlling the media rights.
Implications for Antitrust and Regulation
The foregoing analysis of competitive issues in sports programming markets highlights two major policy issues. First, MVPD markets have benefited by continued penetration of DBS. But cable mergers that increase incentives to fore-close rival MVPDs from affiliated RSN programming could quickly reverse those gains. Competition will therefore benefit from continued close monitoring and scrutiny of cable consolidation. In problematic cases, divestiture can reduce cable market power. And regulatory policy initiatives and directives that promote the continued penetration of DBS and compel carriage of independent programming should be promoted.
Second, the lack of close substitutes created by fan loyalty to particular local teams can have significant implications for competition in MVPD markets. This unique feature of demand for sports programming will affect whether joint marketing of rights through RSNs creates competitive problems. It also will affect outcomes of vertical relationships between MVPDs and RSNs and mergers or either downstream MVPDs or upstream RSNs in the presence of vertical arrangements. Exclusive agreements that fore-close competing MVPDs from access to RSN programming could impose significant switching or duplication costs on consumers who are forced to invest in multiple services to get the programming they want.
The foregoing issue highlights the growing dichotomy between cable-based and DBS-based MVPD systems. In this case, maintenance of “systems competition” is heavily dependent on robust upstream media rights and downstream MVPD markets and open and unfettered MVPD access to local sports programming. Exclusive agreements or mergers that limit MVPD access to programming undercut the benefits of growing, head-to-head competition between cable and DBS. Vertical relationships therefore require careful monitoring and (when necessary) remedial conditions such as “open access” to programming or divestiture.36
Notes
1. Little League Communications Division, New England Sports Network, Madison Square Garden Network to Televise LLB New England, Mid-Atlantic Region Tournament Games, Little League Online, April 14, 2008, http://www.littleleague.org/media/newsarchive/2008stories/New_England_Sports_Network_Madison_Square_Garden_Network_to_Televise_LLB_New_England_Mid-Atlantic_Region_Tournament_Games_-_April_14.htm.
2. See, e.g., Ronald Grover et al., Rumble in Regional Sports, BUS.WEEK, November 22, 2004, available at http://www.businessweek.com/magazine/content/0447/b3909143mz016.htm.
3. Grover, supra note 2; see also Frank Ahrens, Area Baseball Network Must Form Quickly, WASH. POST, Sept. 30, 2004, at A14.
4. Time Warner/Comcast/Adelphia, Statement of Commissioners Jon Leibowitz and Pamela Jones Harbour (Consurring in Part, Dissenting in Part), January 31, 2006, File No. 051-0151, available at http://www.ftc.gov/os/closings/ftc/0510151twadelphialeibowitzharbour.pdf.
5. See John Dempsey, Disney, Fox in NHL Faceoff, VARIETY, Aug. 6, 1998, available at http://www.variety.com/article/VR1117479211.xhtml?categoryid=18&cs=1.
6. Grover, supra note 2.
7. See Mike Reynolds & R. Thomas Umstead, Twins Rights Victory for Fox, MULTICHANNEL NEWS, May 17, 2004, available at http://www.allbusiness.com/government/government-bodies-offices-regional-local/6259986-1.html.
….
9. Federal Communications Commission (FCC) program access rules prohibit exclusivity between integrated cable providers and RSNs. Integrated entities are required to charge other MVPDs reasonable and non-discriminatory fees for programming. These rules were extended for five years in September 2007. See, e.g., John Eggerton, NCTA Pans Program-Access Rules in FCC Filing, BROADCASTING & CABLE, Jan. 4, 2008, http://www.broadcastingcable.com/article/CA6517249.html.
10. Some RSNs also cover local collegiate and minor league teams.
11. This issue has arisen in controversial mergers of cable or DBS providers. See, e.g., Richard J. Gilbert and James Tarliff, Sky Wars: The Attempted Merger of EchoStar and DirecTV, in THE ANTITRUST REVOLUTION 120 (J. E. Kwoka & L. J. White, eds. 5th ed. 2008) (citing F.C.C., REPORT ON CABLE INDUSTRY PRICES, FCC 03-136, released July 3, 2003, available at http://fjallfoss.fcc.gov/edocspublic/attachmatch/FCC-03-136A1.pdf).
12. Steve Donohue, Cable Penetration Hits 17-Year Low, MULTICHANNEL NEWS, Mar. 19, 2007, http://www.multichannel.com/article/CA6425963.html.
13. F.C.C., ANNUAL ASSESSMENT OF THE STATUS OF COMPETITION IN THE MARKET FOR THE DELIVERY OF VIDEO PROGRAMMING, 12TH ANNUAL REPORT, released March 3, 2006, at 37, available at http://hraunfoss.fcc.gov/edocspublic/attachmatch/FCC-06-11A1.pdf [hereinafter 12TH ANNUAL REPORT]. Note that a more recent report has not yet been released by the FCC. See, e.g., Barbara Esbin & Adam Thierer, Where is the FCC’s Annual Video Competition Report?, Progress & Freedom Foundation, Apr. 11, 2008, available at http://www.pff.org/issues-pubs/ps/2008/ps4.11whereisFCCvid=compreport.html.
14. 12TH ANNUAL REPORT, supra note 13.
15. Table does not report RSNs that carry collegiate sports or arena football programming. For the purposes of distinguishing regions by distinct geographic area, Northern and Southern California are divided into two regions. RSNs serving the Portland and Seattle areas (Northwest) are combined, as are those offering programming for teams based in Ohio.
16. The competitive effects of consolidation or agreements on competition and consumers are evaluated under the “no-harm” (to competition) standard employed by the antitrust agencies under Section 7 of the Clayton Act (15 U.S.C. § 18); Section 5 of the Federal Trade Commission Act (as amended, 15 U.S.C. § 45); and the broader public interest standard applied by the FCC in exercising its statutory authority under the Communications Act (410 U.S.C. § 310(d)).
17. See, e.g., Yanks, Red Sox in TV Merger?, CNN Money, Aug. 3, 2004, http://money.cnn.com/2004/08/03/news/midcaps/yesnesn/index.htm.
18. The United Kingdom Monopolies and Mergers Commission blocked the take-over of the Manchester United football (soccer) club by Rupert Murdoch’s BSkyB—the monopoly supplier of premium sports programming. See, e.g., Martin Cave and Robert W. Crandall, Sports Rights and the Broadcast Industry, 111 THE ECON. J. 469 (2001) at F4-F26.
19. Note that FCC rules that require integrated cable providers to offer programming on reasonable and non-discriminatory terms can be gamed by setting a high price charged to competing MVPDs. But the same price—charged by the cable provider to “itself”—is effectively a transfer price and arguably does not affect the ability of the firm to compete.
20. See, e.g., Michael H. Riordan and Steven C. Salop, Evaluating Vertical Mergers: A Post-Chicago Approach, 63 ANTITRUST L.J. 513 (1994) and David Waterman, Vertical Integration and Program Access in the Cable Television Industry, 47 FED. cOMM. L.J. 511 (1994) at 517-20.
21. See F.C.C., General Motors Corp and Hughes Electronics Corp Tranferors, and News Corp. Ltd., Transferee, Memorandum Opinion and Order, FCC 03-330, released January 14, 2004, available at http://hraunfoss.fcc.gov/edocspublic/attachmatch/FCC-03-330A1.pdf.
22. See, e.g., posting of Shepard Mullin to Antitrust Law Blog, FCC Antitrust Highlights, http://www.antitrustlawblog.com/highlights-153-fcc-antitrust-highlights.html (Aug. 7, 2005); David Lieberman, FCC Asked to Put Limits on Deal for Adelphia, USA TODAY, July 24, 2005, available at http://www.usatoday.com/money/media/2005-07-24-adelphia-usatx.htm; F.T.C., FTC’s Competition Bureau Closes Investigation into Comcast, Time Warner Cable and Adelphia Communications Transactions, January 31, 2006, http://www.ftc.gov/opa/2006/01/fyi0609.htm.
23. See U.S. D.O.J. and F.T.C, Horizontal Merger Guidelines, 57 FR 41,552 (1992), revised, 4 Trade Reg. Rep. (CCH) P 13,104 (April 8, 1997), Section 1, available at http://www.usdoj.gov/atr/public/guidelines/hmg.htm.
24. Most RSNs provide coverage of local or sports teams within or near a major metropolitan area with strong fan loyalty and support. A local MVPD would be unlikely to consider sports-related MVP offered by non-local RSNs a good substitute.
25. See, e.g., USFL v. NFL, 842 F.2d 1335 (1988). For a more detailed discussion, see Franklin M. Fisher, Christopher Maxwell, and Evan Sue Schouten, Sports League Issues: The Relocation of the Los Angeles Rams to St. Louis, in The ANTITRUST REVOLUTION at 277 (J. E. Kwoka and L. J. White, eds., 4th ed. 2004).
26. European competition authorities have made similar findings. See, e.g., Office of Fair Trading, The Director General’s Review of BSkyB’s Position in the Wholesale Pay TV Market, (1996), available at http://www.oft.gov.uk/shared–oft/reports/media/oft179.pdf.
27. Due to asymmetries (i.e., imbalances) in information between buyers and sellers, establishing prices for programming is costly and bargaining can be a disruptive process. One example of this is the negotiations between YESN and Cablevision in NYC. See, e.g., Echostar’s Dish Network is Lone Holdout in Cablevision, YES Network Deal, LONG ISLAND BUS. NEWS, March 28, 2003, available at http://www.allbusiness.com/north-america/united-states-new-york/1147329-1.html.
28. See, e.g., Sports Programming and Cable Distribution: The Comcast/Time Warner/Adelphia Transaction, December 7, 2006, Prepared statement of Federal Trade Commission, (Presented by Michael Salinder, Director, Bureau of Economics to Committee on the Judiciary, US Senate), available at http://www.ftc.gov/os/testimony/P052103SportsProgrammingandCableDistributionTestimonySenate12062006.pdf.
29. At the same time, mergers or exclusive agreements could also harm consumers by forcing them to purchase multiple and/or incompatible hardware.
30. See, e.g., Stephen F. Ross, Monopoly Sports Leagues, 73 MINN. L. REV. 643 (1988). Ross argues that the single-entity argument is flawed as a matter of economics because club-run leagues do not have a unity of economic purpose and lack a residual claimant to organize the league and distribute the proceeds. See also, e.g., Bengt Holmstrom, Moral Hazard in Teams, 13 BELL J. OF ECON. 324 (1982) and Michael A. Flynn & Richard J. Gilbert, The Analysis of Professional Sports Leagues as Joint Ventures, 111 The econ. J. 469 at 27 (2001).
31. See Federal Baseball Club vs. National League, 259 U.S. 200 (1922); see also Toolson v. New York Yankees, Inc., 346 U.S. 917 (1953) and Flood v. Kuhn, 407 U.S. 258 (1972).
32. 15 U.S.C. § 1291.
33. See, e.g., Henderson Broadcasting Corp. v. Houston Sports Association, Inc., 659 F. Supp. 109 (S.D. Tex. 1987). Here, a district court held that an exclusive agreement between the Houston Astros and a radio station was not exempt because the competition affected was with a rival broadcaster, not a participant in the baseball industry.
34. See Stephen F. Ross, The Baseball Antitrust Exemption Lives, But with Criticism, in the Eleventh Circuit, American Antitrust Institute, May 28, 2003, http://www.antitrustinstitute.org/Archives/247.ashx.
35. In Shaw v. Dallas Cowboys Football Club, Ltd., 172 F.3d 299 (3d Cir. 1999), the Third Circuit Court of Appeals held that the statute did not protect the NFL’s sale of games for satellite programming packages.
36. See e.g Thomas A Piriano, Jr A Proposal for the Antitrust Regulation of Professional Sports, 79 B. U. L. REV. 889 (1999) at 954-55.
THE FUTURE
THE FUTURE OF SPORTS MEDIA
Irving Rein, Philip Kotler, and Ben Shields