CHAPTER SIX
INTRODUCTION
Hundreds of teams are competing in sports leagues throughout the United States, and thousands more are competing globally. Revenues generated by sports leagues can be divided into two very broad categories: (1) national (and global) revenues that are shared equally by all of the teams in the league and (2) local revenues generated by each individual team that are retained, in large part, by that individual team.
Like franchises in many other industries, professional sports franchises are typically granted an exclusive geographic territory by the league in which they play that is theirs to exploit. These home territories range from a 50-mile radius from the home city in the NHL to a 75-mile radius from the home playing facility in the NFL, NBA, and MLB.
The market in which a team plays obviously has an enormous impact on its local revenue-generating capability. Every city is different, and this is manifested in the team’s ability to monetize the local market. As one travels to various cities across the United States, the differences are readily apparent. New York, Green Bay, San Diego, and Detroit are all very different places, yet their teams compete against one another and they are allowed to generate revenues in their local marketplaces. The size of the market and fan avidity in those marketplaces varies greatly.
Like all businesses, professional sports teams are always attempting to increase their revenues. But the fact that teams come together in the context of a league makes for an interesting dynamic. Teams with a larger revenue-generating potential sacrifice some of their upside for the betterment of the league as a whole. This is effectuated by the presence of league-wide agreements in a variety of areas, from the creation of defined home territories to revenue-sharing programs. Thus, a fundamental tension exists between the teams that try to push the envelope of league rules as far as possible (and sometimes even break them), and the league offices, which attempt to control these aggressive behaviors. The first article by Jack Williams discusses potential revenue streams for professional teams.
These local revenues are extremely important to the financial fortunes of each team. Sports fans are tribal in nature and are passionate about their teams. Fans disproportionately support their hometown teams over outof-market teams, and fan avidity is strongest in the local market. In short, fans “root, root, root for the home team.” Teams monetize this passion in their local market through a number of different means. Local revenues are typically generated through ticket sales; stadium-related revenues, such as luxury and club seating premiums, stadium club fees, and facility naming rights fees; concessions and parking revenues and other revenues derived from the facility on game and nongame days; local media rights deals with local cable and broadcast television outlets and radio stations; local advertising and sponsorship sales; and sales of novelties, programs, and merchandise sold in the stadium and at team-owned stores. National revenues are generated through league-wide media rights deals with national broadcast, cable, satellite, and radio companies; revenues generated by league-owned sports networks; digital media revenues realized through league and team Web sites; league-wide sponsorship deals; consumer products and licensing; league events and the hospitality surrounding them; and all international revenues generated by the league and its teams.
Extrapolating from the Green Bay Packers 2008 annual report, distribution of non-media-related national revenues in the NFL in 2007 totaled nearly $1.1 billion. Distribution of media-related national revenues was $2.8 billion. (See Table 1 for an overview of the Green Bay Packers’ finances.) The importance of each revenue source varies both by league and by team, as does the relative importance of local revenues in the overall league revenue mix. For example, local revenues comprise over three-quarters of MLB revenues due to the large number of games played; at the same time, they comprise less than half of NFL revenues because of the size of the national media contracts held by the league (a consequence of the league’s popularity, the relatively small number of games played, and the fact that all games are broadcast nationally). NHL teams generated a combined $1.12 billion from regular season gate receipts alone in 2007–2008, a season in which the league generated a total of $2.56 billion. Ticket sales are the lifeblood of NHL franchises, because its national revenues, especially those from its national television contracts, are relatively low compared to other leagues. See Table 2 for NHL team ticket revenues in 2006–2007 and 2007–2008. This chapter focuses on the primary revenue opportunities available to each team in the local market, its primary expenses, and the accounting issues faced by professional sports franchises.
Table 1 Green Bay Packers Financials, 2007
| Revenues Source | Amount |
National TV revenue | $87.5 million |
Road-game share | 15.1 million |
Other national NFL revenue | 32.9 million |
Local revenue | 105.8 million |
Total Revenue | $241.3 million |
| Expenses | |
Operating expenses | 219.9 million |
Player Expenses | 124.7 million |
Operating Profit | $21.4 million |
Source: Green Bay Packers 2008 Annual Report.
As noted earlier, gate receipts are a key revenue driver for sports franchises. Team Marketing Report issues a seasonal report for each league that documents ticket prices across the league. According to its most recent reports, the average ticket price in the NFL in 2009 was $74.99, with the average for each team ranging from $160 for the Dallas Cowboys to $51 for the Buffalo Bills. The average ticket price in MLB in 2009 was $26.64, from the high of $73 charged for the average ticket to a New York Yankees game in their new stadium to a low of $14 charged by the Arizona Diamondbacks. In the NBA, the average ticket price was $49.47 in 2008–2009, with a high of $93 for the Los Angeles Lakers to a low of $24 for the Memphis Grizzlies. Finally, the average ticket to an NHL game cost $49.66 in 2008–2009, ranging from $76.15 for Toronto Maple Leafs tickets to $29.94 for the St. Louis Blues.1 This highlights the difference in demand for the tickets for teams even within the same league. It is not surprising that very popular teams in markets where fan avidity is strong, such as New York, Dallas, and Toronto, can charge more for tickets than those less popular teams located in Phoenix, Memphis, and Buffalo. Season tickets are immensely important for teams, because they provide annual upfront revenue that is guaranteed regardless of team performance and a myriad of other factors. Individual game sales and group sales comprise the remaining ticket sales. Demand for tickets to any one game is a function of a number of different factors—the won–loss record of the home team, team tradition, the presence of a superstar player, the quality of the visiting team, promotional giveaways, day of the week, weather, and perceived value. The article by Berri, Schmidt, and Brook examines the impact of star players on gate receipts in the NBA; the excerpt that follows by Lawson, Sheehan, and Stephenson looks specifically at the impact that David Beckham’s arrival had on MLS ticket sales.
In order to drive attendance and increase revenues to lower-demand games, teams began to widely adopt variable ticket pricing schemes in the early 2000s. These pricing policies can be based on any number of different factors, including many of those that have already been noted. Beyond the primary ticket market composed of season, individual, and group sales, teams are attempting in varying degrees to monetize the secondary ticket market. Traditionally the prerogative of ticket scalpers and licensed ticket brokers, technological innovations and entrepreneurial endeavors have led to the creation of more transparent, and thus legitimate, secondary ticket markets. Teams and leagues have established their own secondary ticket markets and have struck marketing deals with established market leaders such as StubHub. In addition, recognizing that they have sacrificed millions of dollars in ticket revenues to suboptimal pricing models, savvy teams have used these secondary markets to gauge the inefficiencies in their pricing models and make the appropriate modifications in their pricing in subsequent seasons. The article by Rascher, McEvoy, Nagel, and Brown takes a deeper look at variable ticket pricing strategies in MLB.
Table 2 NHL Ticket Revenue per Game
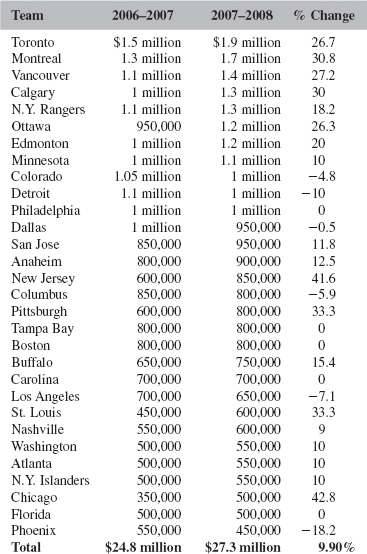
Source: Toronto Star graphic from NHL data. Reprinted with permission–Torstar Syndication Services.
Beyond gate receipts, teams can generate substantial revenues from their playing facilities. The recognition of these potential revenues leads to periodic facility-building booms across professional sports, including one that is currently approaching its end. Seeking to fully monetize their home contests, teams have sought to build stadiums and arenas funded as much as possible from public sources. The construction of a new facility is a transformational moment for a professional sports franchise, because it creates a host of new revenue streams. Beyond providing teams with the ability to substantially increase ticket prices, new revenues can be generated from the sale of naming rights to the facility; multiple-season leasing of luxury seating and other premium seating areas; seat licensing fees; the creation of lucrative marketing partnerships; the establishment of new concessions agreements with one of the dominant concessions companies and new parking arrangements with the appropriate body; and the possibility of hosting events at the facility on nongame days. Table 3 examines the local revenues generated by the New Orleans/Oklahoma City Hornets during the 2006–2007 season.
Sports venue concessions in the United States are dominated by a handful of providers. Sports franchises that control the concessions environment in their facility either through ownership or by the terms of their lease typically outsource this function in order to focus on their core competencies. Aramark (31% market share), Levy Restaurants (19%), Centerplate (16%), and SportService (16%) dominate the marketplace, with the remainder divided among a number of smaller firms (9%) and teams that handle concessions in-house (9%).2 Facility operators enter into long-term contracts with concessions companies that are granted the exclusive right to provide their products and services at the venue. The most common types of vendor contracts are profit-and-loss agreements, whereby the concessionaire receives all of the net sales and bears all of the expenses from providing its services at the facility; profit-sharing agreements, whereby the venue is paid a commission based on the concessionaire’s profits at the venue; and management fee agreements, whereby the concessionaire is paid a management fee for its services. In most of these contracts, the concessionaire pays the facility a significant upfront payment and agrees to upgrade the facility’s concessions infrastructure. This can provide the franchise quite a windfall if it controls the concessions at the facility. The excerpt from Coates and Humphreys examines the relationship between the demand for attendance at MLB games and the prices of tickets and concessions.
Table 3 Oklahoma City/New Orleans Hornets Local Revenue, 2006–2007
| Revenue Source | Amount |
Season tickets | $28.7 million |
Single-game and group tickets | 1.5 million |
Sponsorship/advertising | 9.35 million |
Suite sales | 3.9 million |
Club seats | 1.35 million |
Concessions | 921,000 |
Merchandise | 132,000 |
Parking | 198,000 |
Other | 6,000 |
Total Local Revenue | $46.1 million (in OKC, $40.6 m; NO, $5.5 m) |
Source: New Orleans/Oklahoma City Hornets 2006–2007 statement of local revenue.
Note: 35 regular season games and 2 preseason games in Oklahoma City, 6 games in New Orleans.
A recent trend in stadium construction that teams are attempting to monetize whenever possible is to incorporate the facility into a larger real estate opportunity. The modern sports facility is typically part of a larger mixed-use project that incorporates residential housing, hotels, retail stores, restaurants, movie and music theaters, and bars into an entertainment zone that the team will participate in developing. Examples of this include the Staples Center in the AEG Live project in Los Angeles; Gillette Stadium in the Patriot Place development in Foxboro, Massachusetts; and proposed projects in Brooklyn (Atlantic Yards), Philadelphia, and St. Louis. The financing of each new stadium project is idiosyncratic; some locales are willing to provide a substantial amount of the funding for the project, whereas others are unwilling to provide anything beyond infrastructure. If such a thing exists, the typical deal of late involves a public–private partnership, with the project funded by both public and private financing. Chapter 7 explains stadium revenues and funding in great detail.
In addition to stadium-related revenues, the national and local sale of broadcast, cable, satellite, radio, and Internet rights can provide teams with vast amounts of revenue. (Chapter 8, which focuses on media, provides a wealth of information on this topic.) In the United States, the sale of national television rights through each league’s current long-term deals provides the NFL with an average of $3.7 billion annually through 2013; the NBA with an average of $930 million per year through 2016; MLB with an annual average of $783 million through 2013; NASCAR with an average of $560 million until 2014; and the NHL with $72.5 million per annum through 2011. Thus, each NFL team receives an average of $115.6 million per year from the current national television deal; each NBA team receives $31 million; each MLB club gets $26.1 million; and each NHL team nets $2.4 million.
The media revenues available at the local level vary by team and league. NFL teams are generally limited in their ability to monetize local media, because the presence of the overarching national media deals leaves them with a limited inventory of local media opportunities, consisting of preseason television rights, regular season radio rights, and shoulder programming, such as pre- and post-game shows, coaches’ shows, and youth-focused shows. MLB teams, in contrast, have substantial local media opportunities. Forbes estimated that in 2008 MLB teams earned a combined $690 million from local cable deals—an average of $23 million per team.3 The revenues are top-heavy, with the top 10 teams generating $379 million. See Table 4 for information on MLB’s largest local media deals.
A number of teams own part or all of their regional sports networks, which offers tremendous revenue potential, because teams can receive part of the advertising dollars and subscriber fees that drive these businesses. For the Boston Red Sox, New York Yankees, Toronto Blue Jays, Cleveland Indians, Chicago Cubs, Chicago White Sox, Washington Nationals, Baltimore Orioles, San Francisco Giants, and New York Mets, this ownership is a windfall. Other teams receive a guaranteed rights fee for the sale of their games, including the Los Angeles Angels of Anaheim, who receive an average of $40 million per year as part of their long term deal with FSN West.4 The revenue disparity among MLB clubs in their local media deals is noteworthy, with teams in the lower third of the scale receiving a fraction of those in the top third.
Table 4 Baseball’s 10 Largest Local Cable Deals
| Team | Cable Deal Per Year | Cable Network |
New York Yankees | $80 million | YES |
New York Mets | 52 million | SNY |
Los Angeles Angels of Anaheim | 40 million | FSN West |
Detroit Tigers | 33 million | FSN Detroit |
Los Angeles Dodgers | 31 million | Prime Ticket |
San Francisco Giants | 30 million | CSN Bay Area |
Seattle Mariners | 29 million | FSN Northwest |
Arizona Diamondbacks | 28 million | FSN Arizona |
Baltimore Orioles | 28 million | Mid-Atlantic Sports Network (MASN) |
Washington Nationals | 28 million | Mid-Atlantic Sports Network (MASN) |
Source: Christina Settimi, “Baseball’s Cable Kings,” Forbes, April 22, 2009.
The popularity of NBA and NHL teams allows them to similarly monetize their local media rights, though typically not nearly to the same degree as their MLB brethren. This is a function of the ratings generated (which, in turn, is a function of the popularity of the team in the local market) and there being half as many games played in each league (162 in MLB vs. 82 in the NBA and NHL).
Teams and leagues generate revenue through the sale of sponsorships at both the national and local levels. Sponsoring companies use the association, exposure, and ability to leverage their relationships with the team or league to achieve their marketing goals.5 The sponsorship may entail a number of different elements, including advertising, grassroots marketing, hospitality, cause-related marketing, sales promotion, and public relations.6 With various levels of sponsorships sold by leagues at the national level and by teams at the local level, there is ongoing debate about which categories of sponsorship, if any, should be reserved exclusively for either the teams or the leagues. Another issue is the degree of category exclusivity that should be provided at each level. Broad category exclusivity can be of great value to the sponsor. The NFL example is instructive. The league has a large number of sponsors at the league level, as seen in Table 5. Although the benefits of these deals vary, sponsors typically receive category exclusivity, the ability to use league marks in advertising and promotions, signage at league events, media exposure, and hospitality benefits. The NFL’s sponsorships with Gatorade (isotonic beverage), Motorola (wireless telecommunications equipment), and Reebok (on-field apparel)—all of which appear on the playing field and/or sidelines—are exclusive to the league; that is, no team may sell sponsorships in any of these categories. These deals are quite lucrative: Gatorade pays the league a reported $45 million annually through 2011 for the sponsorship, Reebok pays over $30 million annually through 2012, and Motorola pays $50 million annually through 2011 to showcase a product that it does not even sell at retail—coaches’ headsets! In the other categories, teams may sell sponsorships in their local markets alongside the league’s national deals. In the most lucrative of these nonexclusive league deals, Anheuser-Busch pays a reported $200 million per year (including up to $50 million in cash rights fees and an additional $150 million in marketing, media, and team spending commitments) for its Bud Light brand to be the league’s official beer from 2011–2016. This deal replaces the NFL’s previous beer sponsorship with MillerCoors that paid a reported $100 million annually. At the team level, the sale of sponsorships similarly can be exclusive or nonexclusive. For example, in 2009 the Philadelphia Eagles had beer sponsorships with Miller Lite, Budweiser, and Heineken. Overall, the team had 45 sponsors at multiple levels in a number of different categories.
Table 5 NFL Sponsorships, 2009
| Sponsor | Product or Service | Year Sponsorship Began |
Bank of America | Team identified credit cards, official bank; NFL affinity credit cards | 2007 |
Bridgestone | Automotive tires | 2008 |
Campbell Soup | Soup, canned pasta, tomato food sauces, salsa, chili | 1998 |
Canon USA | Cameras and equipment, binoculars and field glasses, photo printers, camcorders | 1984 |
FedEx | Worldwide package delivery service | 2000 |
Frito-Lay | Salted snacks, popcorn, peanuts and peanut products, salsa, dips | 2000 |
Gatorade | Isotonic beverage | 1983 |
General Motors | Passenger cars, passenger trucks | 2001 |
IBM | Computer hardware and software, IT services | 2003 |
Mars Snackfood | Chocolate and non-chocolate candy products | 2002 |
MillerCoors | Beer | 2002 |
Career services | 2008 | |
Motorola | Wireless telecommunications equipment | 1999 |
National Dairy Council | Milk products | 2003 |
National Guard | NFL High School Player Development | 2009 |
News America | Super Bowl insert | 1979 |
Pepsi | Soft drink | 2002 |
Procter & Gamble (Prilosec OTC) | Over-the-counter heartburn medication, locker room products | 2005 |
Samsung | Televisions, stereo and speaker components, DVD players and recorders | 2005 |
Sprint | Wireless telecommunications services | 2005 |
Ticketmaster | Online ticket exchange provider | 2008 |
Tropicana | Juice | 2002 |
Visa | Payment systems services | 1995 |
Source: “NFL close to IBM renewal; Visa up next,” SportsBusiness Journal, September 14, 2009. Used with permission of the National Football League.
In addition to revenues generated directly from the aforementioned sources, professional sports franchises, leagues, and other sports properties realize significant monies through the sale of officially licensed products bearing their names, logos, and marks. In 2001, the NFL sold $2.5 billion of licensed products. MLB had sales of $2.3 billion, and NASCAR’s sales were $1.2 billion. The NBA generated $1.0 billion, and the NHL sold $900 million of its goods. Collectively, the sale of sports-related products represented 14.9% of all licensed goods sold in the United States in 2001. This figure actually represents a decrease from previous years in the overall sales of sports-related licensed goods, which is likely attributable to both a shift in fashion trends and a downturn in the economy. The fickle nature of fashion can cause revenues to fluctuate, presenting a problem to professional sports leagues and franchises in that the uncertainty in the revenue stream can dissuade the entity from relying on the sale of licensed products in its budgeting process.
Licensees—the manufacturers of these products—typically pay the sports property a royalty fee ranging from 4 to 10% of the wholesale selling price of the goods (depending on the product) in exchange for the right to sell products containing league and team names, logos, and marks. These monies are paid by the licensees to each league’s properties division. The respective properties division then pools the funds and distributes them equally across all league teams, similar to the manner in which revenues generated from the sale of national media rights are apportioned. So, although all teams benefit from the increased royalties generated from an increase in the sales of licensed products, there appears to be little incentive for an individual club to incur a significant amount of the cost of doing so, while reaping little of the benefit in the form of increased revenue. To overcome this obstacle, leagues have carved out exceptions to this general revenue sharing rule and typically allow teams to keep a disproportionate share of the proceeds generated from the sale of their licensed products where they also serve as the retailer, such as when selling in their playing facilities and at team-owned stores or when the sale occurs within a specific mile radius of this facility. See Table 6 for the top-selling NFL player jerseys and Table 7 for the top-selling NBA jerseys.
Despite these efforts, the general sentiment among popular clubs with strong licensed product sales, such as the Dallas Cowboys, is that they should not be forced to share the value of their brands with other, less popular clubs that have lower brand value. Thus, the manner in which revenues from licensed products are allocated is likely to remain a matter of intraleague dispute. Although the net revenues received by each club from the sale of licensed products are approximated to be only several million dollars per year, the resolution of this debate is an important indicator of the future of revenue sharing in each league. (See Tables 8 and 9 for a list of top merchandise sales by team in the NFL and NBA, respectively.)
Table 6 Top-Selling NFL Player Jerseys, 2008
| 2008 Rank | Player |
1 | Jets QB Brett Favre |
2 | Cowboys QB Tony Romo |
3 | Giants QB Eli Manning |
4 | Steelers S Troy Polamalu |
5 | Vikings RB Adrian Peterson |
6 | Colts QB Peyton Manning |
7 | Cowboys RB Marion Barber |
8 | Cowboys TE Jason Witten |
9 | Chargers RB LaDainian Tomlinson |
10 | Steelers QB Ben Roethlisberger |
11 | Eagles RB Brian Westbrook |
12 | Patriots QB Tom Brady |
13 | Cowboys WR Terrell Owens |
14 | Bears LB Brian Urlacher |
15 | Falcons QB Matt Ryan |
16 | Giants RB Brandon Jacobs |
17 | Broncos QB Jay Cutler |
18 | Steelers WR Hines Ward |
19 | Bears WR Devin Hester |
20 | Cowboys LB DeMarcus Ware |
21 | Patriots WR Randy Moss |
22 | Redskins TE Chris Cooley |
23 | Ravens QB Joe Flacco |
24 | Bears RB Matt Forte |
25 | Saints QB Drew Brees |
Source: “Cowboys Rank as Top-Selling NFL Team; Favre Leads in Jersey Sales,” SportsBusiness Daily, January 8, 2009. Used with permission of the National Football League.
On a percentage basis, team expenses are generally consistent across professional sports leagues. Player compensation is the biggest expense for every team in the NFL, NBA, NHL, and MLB. An extensive discussion of athlete compensation is found in Chapter 10. The second largest expense for most teams is staff compensation. Head coaches’ salaries have increased dramatically in the past two decades, as has the compensation (and quantity) of assistant coaches. Front office staffs have grown in size as teams have become much more complex organizations, and, although salaries are still much smaller than those of the coaches and players, they represent a sizable expense for most teams.
Table 7 Top NBA Jersey Sales, 2008–2009
| Rank | Player |
1 | Kobe Bryant (L.A. Lakers) |
2 | LeBron James (Cleveland Cavaliers) |
3 | Chris Paul (New Orleans Hornets) |
4 | Kevin Garnett (Boston Celtics) |
5 | Allen Iverson (Detroit Pistons) |
6 | Dwyane Wade (Miami Heat) |
7 | Paul Pierce (Boston Celtics) |
8 | Nate Robinson (New York Knicks) |
9 | Pau Gasol (L.A. Lakers) |
10 | Dwight Howard (Orlando Magic) |
11 | Derrick Rose (Chicago Bulls) |
12 | Ray Allen (Boston Celtics) |
13 | Steve Nash (Phoenix Suns) |
14 | Shaquille O’Neal (Phoenix Suns) |
15 | Carmelo Anthony (Denver Nuggets) |
Source: NBA.com. Figure used with permission from NBA Properties, Inc. All Rights Reserved.
Every franchise has team and game-related expenses; that is, those expenses that are associated with team travel to away games and the cost of putting on home games. And, like every business, sports franchises have general and administrative expenses that arise. Teams also have marketing expenses that arise out of their marketing efforts, including the servicing of their numerous corporate partners.
Similar to many other businesses, sports franchises also have a research and development (R&D) expense. Here, the R&D function is called player development. Teams must scout amateur and professional players and pay for the salaries of the players and coaches in its minor league system. Although college basketball and football programs serve as a no-cost player development system in the NBA and NFL, MLB and NHL teams have farm systems that require them to spend considerable sums on player development annually. NBA teams do subsidize their NBDL affiliates, and most NHL teams have one minor league affiliate (and some have two). However, most MLB teams have six minor league affiliates. MLB teams spend approximately $20 million on player development annually.7
Table 8 Top Selling NFL Team Merchandise, 2008
| 2008 Rank | 2007 Rank | Team |
1 | 1 | Cowboys |
2 | 7 | Giants |
3 | 3 | Steelers |
4 | N/A | Jets |
5 | 4 | Bears |
6 | 2 | Patriots |
7 | 8 | Redskins |
8 | 9 | Eagles |
9 | 5 | Packers |
10 | 6 | Colts |
Source: “Cowboys Rank as Top-Selling NFL Team; Favre Leads in Jersey Sales,” SportsBusiness Daily, January 8, 2009. Used with permission of the National Football League.
Table 9 Top NBA Team Merchandise Sales, 2008–2009
| Rank | Team | |
1 | Los Angeles Lakers | |
2 | Boston Celtics | |
3 | New York Knicks | |
4 | Cleveland Cavaliers | |
5 | Chicago Bulls | |
6 | New Orleans Hornets | |
7 | Phoenix Suns | |
8 | Miami Heat | |
9 | Detroit Pistons | |
10 | San Antonio Spurs |
Source: NBA.com. Figure used with permission from NBA Properties, Inc. All Rights Reserved.
Teams also have facility-related expenses. Rent payments, stadium upkeep and renovations, utility bills, and seating reconfigurations can all be part of the team’s responsibility as a tenant. The amount depends entirely on the lease deal that the team has entered into. Teams that paid for part or all of their playing facility must service the debt on the facility, which can be onerous, depending on the amount and terms of the financing. More details on facility financing and expenses can be found in Chapter 7.
Facility construction and the purchase agreement are the two largest sources of debt for professional sports franchises. The acquisition of most teams is financed by debt. In 2008, NFL teams carried a combined $9 billion of debt, and MLB clubs carried over $5 billion in debt obligations. Although leagues have facilitated the debt financing process by establishing credit facilities that teams can borrow from, the leagues are wary of teams being weighed down by this debt. To that end, the leagues have enacted rules that restrict the amount of debt that teams can carry. MLB teams must have a 60–40 debt–value ratio (although there are some exceptions for teams in new stadiums), NBA teams are each limited to $175 million in debt, and NHL teams can carry debt up to 50% of the team’s value. The article by Hill and Vincent takes a deep dive into the business of Manchester United, perhaps the top sports brand globally.
Like many other industries, the operations and financial results of professional sports franchises are highly seasonal in nature. Likewise, sports organizations are entities with inventories, production functions, research and development functions, and very high fixed costs that require significant capital. However, unlike other industries, the accounting practices of professional sports franchises vary significantly.
One common accounting issue for professional sports franchises involves the use of related-party transactions. The ownership of sports franchises by non-sports-related businesses and the nature of the sports industry have created numerous opportunities for these types of transactions. Typically, the presence of the nonsports business is used to lower the apparent profitability of the sports franchise in favor of improving the situation of the other, related businesses. This is problematic in that the tax liability of the sports franchise is lowered, and the team’s financial outlook is distorted. A professional sports franchise with an operating profit may be able to claim a book loss. Paul Beeston, a Toronto Blue Jays executive, summed up how the use of related-party transactions can dramatically affect the book profits of a professional sports franchise: “Anyone who quotes profits of a baseball club is missing the point. Under generally accepted accounting principles, I can turn a $4 million profit into a $2 million loss and get every national accounting firm to agree with me.”8 This distortion has been the cause of much controversy, because the misleading financial picture has been relied upon by professional sports franchises in pursuit of new, publicly funded stadia and by professional sports leagues when negotiating collective bargaining agreements with athletes. Teams and leagues have argued that their dire financial status requires that other stakeholders make significant concessions in negotiations.
Although the use of related-party transactions is not an illegal practice per se, it has created animosity and mistrust and, consequently, has harmed the long-term relationships between the negotiating parties. As a result, the perception among many stakeholders is that the financial statements of sports franchises cannot be relied upon whether related-party transactions are being used or not. Given the recent spate of accounting scandals in the United States that have depleted consumer and investor confidence in big businesses across numerous sectors of the economy, it is imperative that the sports industry avoid a similar fate.
Excerpts from the SEC filing made by the publicly held parent company of the New Jersey Nets upon the announcement of its sale to Russian oligarch Mikhail Prokhorov provide a rare glimpse into the finances of an NBA franchise. The filing indicates a franchise in some financial distress. The Nets’ gross revenues dropped nearly 20% from 2007 to 2009 due to the team’s poor on-court performance and the recession. Although operating expenses also decreased during this period, the team suffered annual operating losses of $68.5 million and $68 million in the two most recent years.
Despite the relative financial strength of the professional sports industry compared to other industries, the financial failures of several franchises and leagues has led those entities to seek financial reorganizations. The Phoenix Coyotes filed for bankruptcy protection under Chapter 11 in 2009 after incurring nearly $270 million in operating losses from 2004 to 2008. (See Table 10 for a list of bankruptcies.) Such reorganization can be done either privately between the franchise and its creditors or publicly through Chapter 11 of the Bankruptcy Code. Although hardly a desirable outcome, it is important for sports industry leaders to understand the process of financial reorganization. In a selection found in the supplementary online materials, Timothy Cedrone gives a comprehensive explanation of this process in both England and the United States.
Table 10 Major Sports Team Bankruptcies Since 1969
| Year | Team | |
2009 | Phoenix Coyotes (Hockey) | |
2003 | Buffalo Sabres (Hockey) | |
2003 | Ottawa Senators (Hockey) | |
1998 | Pittsburgh Penguins (Hockey) | |
1995 | Los Angeles Kings (Hockey) | |
1993 | Baltimore Orioles (Baseball) | |
1975 | Pittsburgh Penguins (Hockey) | |
1970 | Seattle Pilots (Baseball) | |
1969 | Philadelphia Eagles (Football) |
Sources: CNNmoney and East Valley Tribune.
Notes
1. Team Marketing Report, “Fan Cost Index.” Available at http://www.teammarketing.com/fancost/ (accessed June 2009).
2. ESPN The Magazine, July 13, 2009, at 34.
3. Christina Settimi, “Baseball’s Cable Kings,” Forbes, April 22, 2009.
4. Id.
5. Steven M. McKelvey, “Sport Sponsorship,” in Lisa Masteralexis and Carol Barr (eds.), Principles and Practice of Sport Management (3rd ed.). Sudbury, MA: Jones & Bartlett, 2008, at 338.
6. Id.
7. Andrew Zimbalist, “There’s More than Meets the Eye in Determining Players’ Salary Shares,” Sports Business Journal, March 10, 2008, at A4.
8. Larry Millson, Ballpark Figures: The Blue Jays and the Business of Baseball. Toronto: McClelland & Stewart, 1987, at 137.
OVERVIEW
THE COMING REVENUE REVOLUTION IN SPORTS
Jack F. Williams
Along with the U.S. population, [sports’] fanbase has grown enormously in the last half century, as new professional leagues sprouted, media mushroomed, and professional sports became thoroughly assimilated into the entertainment industry. Fans are the geese who have laid the golden eggs for pro athletes, team owners, sports broadcasters. Meanwhile, that same flow of cash has altered the relationship between spectators and the contests. A newfound distance, which can verge on alienation, separates the audience from athletes and teams. Choices made within the sports and political establishments over the next few years may determine whether pro sports’ dizzy growth continues, or if those golden orbs will turn into goose eggs.1
Sports as a business has matured at an accelerating pace in the past two decades.2 During this time period, participants in the business of sports have aggressively pursued alternative sources of revenue in an effort to drive earnings. These new sources are sought both to grow and stabilize revenue.3 In large part, technology has been at the vanguard of the revenue revolution, allowing a level of fan interaction that has changed how we think about sports and the successful sports business plan. Traditionally, the sports market consists of gate revenues for live sporting events; rights fees paid by broadcast and cable television networks and TV stations to cover those events; merchandising, which includes the selling of products with team or player logos; sponsorships, which include naming rights and payments to have a product associated with a team or league; and concessions. Currently, other revenue streams such as internet, satellite, or mobile phone subscriptions to sports events or programming are transforming sports into programming content designed as a means to secure greater revenue. These new sources bring with them a host of legal, financial, and business issues that will challenge our understanding about fundamental aspects of property law, privacy, publicity, and value. This paper will discuss both traditional and non-traditional revenue sources, the legal and business implications they create, and the need for a new business paradigm to address these issues and harness the new synergies the leveraging of existing and future technologies present.
I. STATE OF THE BUSINESS OF SPORTS
Sports is big business.4 Its present structures and attributes are well known.5 … The focus in this article is on the sports entertainment sector. That sector includes professional and amateur sports teams and tournament sports…. The sports entertainment sector is comprised of various firms (i.e., clubs) that join together in leagues to provide similar, well-defined products and services (i.e., some form of competition, media, merchandise, etc.) through similar production methods (i.e., play the game).6
….
II. TRADITIONAL SOURCES OF REVENUE
Traditionally, revenue platforms in the sports sector consist of: (1) gate revenues for live sporting events; (2) rights fees paid by broadcast and cable television networks and TV stations to cover those events; (3) merchandising, which includes the selling of products with team or player logos; (4) sponsorships, which include naming rights and p ayments to have a product associated with a team or league; (5) actual team ownership; and (6) concessions.14 Following is a discussion of how those revenue platforms play out in the context of three professional sports leagues—the National Football League, Major League Baseball, and the National Basketball Association.
A. National Football League (NFL)15
Established in 1920, the National Football League (NFL) has emerged as the most stable of professional sports when it comes to controlled growth, revenue, and financial success.16 …
….
Unlike other industries, sports require the cooperation of all firms through the league and competition on the field of play. Although General Motors Corporation does not need Ford Motor Company to produce automobiles, the Atlanta Falcons need the Dallas Cowboys to produce football games. In an effort to theoretically bring greater competition to the field, the sports entertainment sector has sought various revenue models. The NFL has adopted a sourced approach to revenues: (1) retained revenues and (2) shared revenues.26
Retained revenues are generated and kept by each team; thus, retained revenues are not shared among teams in the NFL…. Retained revenues include the following:
• Sixty percent of the gate receipts from home games,28
• Naming rights,
• Sponsorships,
• Luxury suite revenue,
• Concessions, and
• Local broadcast rights.29
Shared revenues are allocated and shared across the teams in the NFL…. The primary sources of shared revenue include:
NFL Properties, Inc., the marketing arm of the NFL, is also a major revenue source…. Revenue from NFL Properties activities is shared equally among all thirty-two teams, the league office, and NFL Charities.35 Experts, however, have observed that this particular revenue stream may be stabilizing or possibly decreasing because of competition from other sports and consolidation among vendors that deal with NFL Properties.36
Finally, franchise values in the NFL have accelerated at an accelerating rate over the past three decades.
….
B. Major League Baseball (MLB)45
The beginnings of baseball in America are shrouded in some mystery and considerable controversy.46 Although most experts agree that baseball began in the United States in the mid-1800’s, some trace the game back to American Indian stickball and some to the English game of rounders. Many wrongly trace the “invention” of baseball to Abner Doubleday. The legend goes that General Doubleday, Civil War hero, invented baseball in 1839 in Cooperstown, New York. However, in 1839, Doubleday was a cadet at West Point, living a very busy day with hardly the opportunity to play let alone invent a new game. Moreover, General Doubleday never took credit or even mentioned the game of baseball in his many personal journals.47
All early baseball players were amateurs. In 1869, that changed, and with it, the face of the game.48 In that year, the Cincinnati Red Stockings paid its players becoming the first professional baseball team to publicly acknowledge that they actually paid their players, a practice that had existed surreptitiously for some time. By 1876, eight professional teams formed the National League. In 1900, eight teams formed the American League.49 Although the Leagues increased the number of games per season over time, in 1961, the American League increased the number of games played each season by each team from 154 to 162.
….
The attendance at MLB games has steadily increased along with ticket prices…. Each team in MLB generates its operating revenue through several sources.57 These sources include the following:
• Regular season game receipts,
• Local television, radio, and cable contracts,
• Post Season (for those teams that qualify),
• Local operating revenue, and
• National revenue.58
… Presently, MLB teams are participating in a revenue sharing program. In accordance with the program, each team invests thirty-four [now 31%] percent of net local revenues into a pool. The pool is then divided among the teams. Some teams are net contributors, that is, revenue sharing is a net liability, whereas, some teams are net recipients, that is, revenue sharing is a net asset.60
In MLB, when it comes to revenue sources, the gate is still king. Approximately forty percent to fifty percent of total revenue is traced to game receipts.61 When one also considers other local revenues, including concessions, suites, and other game-day in-park revenue, the number increases to as much as sixty percent.62 The gate receipts are shared with approximately eighty to ninety percent retained by the home team and the remaining ten to twenty percent going to the visiting team.63
….
C. National Basketball Association (NBA)68
….
NBA attendance has grown steadily over the past decade….
Unlike the other sports leagues considered in this article, NBA teams keep all home gate receipts and do not share with the visiting teams.77 NBA television contracts also generate substantial revenues.78 …
The NBA has also focused attention on licensing fees.
….
D. Other Revenue Sources
Smart financial and legal minds hover all around sports. Notwithstanding some notable setbacks, failures, and false starts, those folks that toil in these fertile fields have invented and developed several interesting revenue growth models. Most of these models build on traditional revenue sources, using those traditional sources as a platform from which to spring new growth models. The following section explores just a few of these revenue growth models.
1. Architecture
Our first revenue source is a subtle but effective variant of the adage that “gate is king.” Architects have captured something that we fans have known intuitively for some time. If you build a nice stadium, specifically designed and suited for the game at hand, the fan experience is more gratifying. Build a baseball field, construct a football stadium, erect a basketball arena, and watch the fan base grow. Multipurpose sports facilities are out, kind of ugly, and bad for revenue growth. A well-suited facility breeds fan gratification. That gratification translates into more at the gate - both in increased attendance and higher ticket prices.88 What the architects and financial experts have also uncovered, not so intuitive to us fans, is that the smaller the stadium (within reason), the greater the gate.89 The data suggest that the smaller the stadium, the smaller the number of seats; the smaller the number of seats, the more scare tickets become; the more scare tickets become, the more a team can charge for those tickets.90 Under the watchful eye of MLB, architects are working to get the supply-and-demand of stadium design at perfect balance.91 Other sports should also consider this formula; bigger is not always better, at least from a revenue growth perspective.
2. Luxury Suites and Club Seats
Our second revenue source simply seeks to retrofit existing stadiums or incorporate by design in new stadiums a new look and feel to the game that is business and corporate user-friendly. Luxury suites and club seats present a lucrative opportunity for increasing revenues.92 According to some experts, these products represent one of the fastest growing revenue sources in sports.93 New stadiums… are incorporating luxury seats in their design and construction.94 Older stadiums are re-designing and retrofitting their present seats in an effort to convert them to luxury seats.95
Luxury suites, also known as luxury boxes, sky boxes, or executive suites, are private to semi-private rooms that ring the stadium and allow groups to mingle, schmooze, and at least occasionally watch the game either through the large window or balcony or on closed-circuit television. As mentioned these suites are lucrative, allow the team to increase revenue per seat, and hook corporate sponsors.96 Club seats, also referred to as premium seats, do not offer the privacy or most of the amenities of the luxury suite, but are usually more comfortable, often come with service at your seat, and usually have some of the best sight lines in the stadium.97
… It is not unusual for a team to offer several grades of luxury suites based on size, location, and amenities, in order to capture even greater premiums….
3. Pay-Per-View
Professional sports franchises are adding to their revenue through pay-per-view (PPV) contracts with local networks and cable companies.103 Revenues from PPV have increased dramatically from a humble $435 million in 1991 to $3 billion in 2000.104 This is, by all accounts, a virtually untapped revenue resource.
An extension of the PPV platform is to offer the Super Bowl and World Series on PPV in addition to those marquee sports events’ regular network broadcasting. The PPV version could offer different angles, additional content, trivia contests, on-field sound, and the like.
4. Satellite Radio
Professional sports have found a new home on satellite radio. These satellite broadcast providers look to sports to provide content that attracts listeners and advertisers. Fans love satellite broadcast. It allows them the opportunity to follow their home teams even when their employment requires that they change “homes.” This revenue platform is also relatively untapped. Watch for professional sports leagues to enter into the market with a greater presence. Also, watch for the possibility that a professional sports league or combination of leagues explore or consider purchasing their own satellite broadcast company. Imagine the NFL, MLB, and NBA entering into a joint agreement in order to reduce start-up costs and tap an even greater audience with greater league control. Armed with ready-made content, we may witness the revenue race thrusting back to the future when it comes to satellite broadcasts.
5. Personal Seat Licensing
In 1997, personal seat licensing (PSL) was estimated to raise $500,000 in one time fees.105 That number appears to have increased. The PSL is a “cheap” way in which to raise onetime revenue. However, as a revenue generating product, it lacks strategic legs.
6. Media Access Charges
The Media Access Charge (MAC) is a rent based on gross receipts. The MAC operates in a way similar to a percentage rent term between a tenant and a shopping mall. For example, according to the Minnesota Legislature Study on Sources of Revenues, fees from use of the broadcast facility at a stadium, at rates of $10,000 per game for television/cable and $5,000 per game for radio broadcast, would raise an estimated $2.16 million per year from MLB and $215,000 per year from NFL broadcasts.106
7. Naming Rights
…. Although quite cumbersome and the butt of many sports commentators’ jokes, there seems to be no letting up on the name game.
8. Sport as Entertainment
In the arena of sports as entertainment, the NBA is unequivocally “best in show.” Both the NBA and the National Basketball Players Association (NBPA) emphatically recognize that the sports industry, properly understood, is a sector of the entertainment industry. The NBA not only competes with the NFL and MLB, but also competes for the entertainment dollar with movies, recordings, videos, and the like.
The NBA has been aggressive in blurring the distinction between sport and entertainment, exploiting the bleed over of one form of entertainment into the other. Among products that the NBA has developed are the commissioning of a recording that captures the “NBA spirit” and video games that take the video experience to another level of entertainment. For example, the soundtrack for EA sports “NBA Live 2003” was certified a platinum album with over 1 million recordings sold, the first ever video game soundtrack to reach that recording milestone.109
Although both the NFL and MLB have joined the NBA in recognizing that the sports sector is a part of a much bigger picture, the three professional sports leagues have so much unrealized potential that one should not be surprised to see more attempts at exploiting the natural fit between sports and other forms of entertainment. Some may argue that such an alliance is a pact with the devil in that it taints the game, making it too glitzy, too “Hollywood”; that view, however, is quaint and shortsighted.
9. International Expansion
One way in which to increase revenue is to increase the geographic pie. Historically, the NFL, MLB, and the NBA looked exclusively to the United States for their fan base and revenue growth. That has changed. Recognizing that the three professional leagues operate in a mature domestic environment, international expansion is a logical and rational next step to revenue growth. The sports industry is not immune from globalization. For some time, MLB has operated in an international market through exhibition games and the like. It also has successfully discovered and cultivated players from Mexico, the West Indies, Central America, and South America for decades. More recently, player scouting has included other countries like Australia and Canada. In 2006, the World Baseball Classic, a tournament of national teams featuring MLB players on the rosters of the United States and foreign teams, brought baseball to the world in a more formal sense. If not a domestic success, the Classic was certainly an international one. Surprisingly, however, MLB has been slow in moving outside the continental United States.
….
The NBA is also considering international expansion. With the popularity of basketball in Europe, that continent appears to be the likely start for the NBA. The presently existing professional league structure in countries like Italy, France, Spain, and Israel suggests an interesting possibility. Would the NBA consider a merger or alliance with an existing European league? Experts appear to think not; the NBA’s brand is worldwide and already strong in Europe.112 For example, approximately twenty percent of all NBA merchandise (about $430 million) is sold internationally.113 Moreover, over fifteen percent of the $900 million in annual television revenue (excluding local broadcasts) comes from 148 non-U.S. television partners in 212 countries.114 The NBA has also determined that approximately forty percent of its visitors to www.nba.com access the website from locations outside of the United States.115 More promisingly, it appears that almost fifty percent of NBA fans said that the “influx of international players has increased their interest.”116
III. NONTRADITIONAL REVENUE SOURCES
Professional sports leagues are competing in a vicious arena, and one that is not on the playing field. With the heavy competition for the entertainment dollar coming from many different angles, every revenue dollar is precious. However, any professional sports league or organization that sets its eye on the quick buck will someday realize just how much potential revenue slipped through its collective hands.
Professional sports leagues are leaving revenue on the table. Extending existing revenue platforms are necessary but not sufficient in order to maximize revenue. With operating costs increasing, driven largely by player salaries, and with competition being launched from other entertainment sectors that are competing for the same seats and eyes, a new revenue paradigm is necessary….
The key is to find efficient and effective techniques in order to mine such revenue. This emerging revenue paradigm will embrace existing and new technologies. These new technologies will change the fan experience, allowing more interaction and greater fan control over his or her experience. These new technologies will also permit the fan to customize his or her experience, developing a cozy and personalized interface with the game.
Another example may help demonstrate what I am suggesting. NFL future revenue trends necessarily include internet and broadband media rights…. Leveraging the new technologies with these and other relationships is precisely what the NFL must do to compete effectively.
Any revenue paradigm shift would not leave behind existing revenue sources. In fact, a new paradigm would continue to build on and expand such sources. What the new paradigm offers, however, that the old revenue thought experiments did not, is a new perspective. This new perspective is fueled by an understanding that professional sports is not about the game, it is about the way in which we as fans experience the game.
Following are some suggestions for reaping revenue:
1. Housing Related to the Sports Complex
NASCAR has moved into the housing market with luxury suites at the Atlanta Motor Speedway, for example. These houses are selling for more than $1 million. A variety of housing options could be crafted, depending on the venue, to suit a range of budgets. For example, in more rural or suburban areas, a league or team within the league might design and market communities based on their proximity to the venue, with prices descending the farther away one’s home rested.
In urban markets, with land at a premium, it might make more sense to design arenas to incorporate mixed use luxury condo and hotel units into the existing structure. Because major sports complexes frequently host a wide range of activities from massive religious revivals to tractor pulls and from large concerts and conventions to traditional sporting events, the demand for permanent housing to experience the full range of these events might be limited. Nonetheless, hotels allowing customers to self-select the events they wish to see, and rent suites accordingly, might be a viable option.
2. Computers at Your Seat
It is undeniable that every game in every sport faces some down time. Why not offer fans the ability to use a computer while sitting at their seat? Initially, I thought renting a portable device would be the most effective way to go. For example, a Tough Book is a laptop computer designed by Panasonic to take a beating. However, almost immediately, the flaws in this idea become apparent. A laptop is a cumbersome device for someone sitting in cramped stadium seating; if a baseball is flying towards you and you jump up to catch it, your ToughBook is going to go flying. Moreover, because they are portable, the notebook computer would also be easy to steal. Additionally, if you are sitting in an upper deck and you dropped or threw one of those devices, it could kill someone. That is a bad thing.
Yet, still the basic idea has some merit. What if the device was small and folded up, attached to your armrest? It could have a small LCD screen and a place to swipe a credit card. You could order drinks or food from your seat and perhaps check your email. You could allow patrons to surf the web set to your website, of course. Of course, with advances in cell phones and PDAs, it seems unlikely that folks would pay for what they may be able to already do on their own devices. However, beyond ordering food and drinks and surfing the web, what if you offered up the fan the ability to cycle through the various camera signals in the facility. A fan could use the device to access the TV coverage of the game, the camera shots not on the air, and perhaps additional camera feeds (for example, in the locker room, tunnel, dug out, etc.) not available anywhere else. Advertisements could also be mixed in with this programming either in the form of logos appearing on live camera feeds or traditional commercials during breaks.
3. Projected Ads on Field/Court/Ice
Because soccer games do not take commercial breaks, other than at half time, professional soccer was forced to come up with alternative ways of selling advertisements. One revenue source has been to place advertisements around the stadium along the walls surrounding the field. Most professional sports already sell similar advertising. Check out the ads around the ring of a stadium next time you take in a game. Another creative way professional leagues have made up for the lost opportunity for commercials is by selling time for companies to either attach their logo to the bug on the screen or by superimposing their logo directly onto the field of play. When MLB attempted to promote the film Spiderman II by placing the movie’s logo on the bases during one game, MLB was widely criticized for defiling the game.122 Superimposing a logo on the field of play would only be seen by television viewers, and, thus, it might be less controversial. The right to sell those images might be retained by the professional sports teams when negotiating their broadcast licenses.
….
5. Headsets that Would Connect the Fan to the Field
Technology drives new fan experiences. The use of multiple camera angles, helmet cameras, live microphones, sideline interviews, slow motion, instant replay, superimposed first down lines, and the like are designed to bring a new and fresh experience to the fan. A new fan experience that would extend that logic could include headsets that would connect the fan to the field of play by allowing fans to listen to the interaction among coaches or between a coach and his players. Obviously, teams would need to be certain that providing radio content did not violate any exclusivity rights offered to their broadcasters. This could be done either by renting/selling cheap headsets that could pick up a low frequency radio signal or by simply providing the signal and allowing fans to bring their own radios. It is not unusual for fans to watch a game, in person or on TV, with the sound turned down, while simultaneously listening to the play-by-play on the radio. Fans could choose to do this in most arenas already by simply tuning into their local radio station that is broadcasting the game. In addition, what if fans were given access to radio feeds that picked up sideline/on-the-field conversations or picked up signals from up in the booth? This could be offered for free with commercials or offered for a service fee with or without commercials.
….
7. Interactive TV
Interactive Television or iTV is touted as a technology that will change the way a fan interacts with the sports broadcasting. By providing greater access to content including statistics, live games, commentary, and perhaps linking content to a fan’s fantasy team, the iTV promise is to generate greater interaction between a fan and the sport and to retain viewership.125 Additionally, broadcasters could offer viewers the ability to cycle through alternative camera angles for a single game or display multiple games simultaneously.126
8. Broadcast License for Trains and Airlines
Professional sports, assuming this would not violate their contracts with TV broadcasters, might license train and airline companies to provide live coverage of their games or, perhaps, video of past “classic” games. This could be either by pay-per-view with a customer swiping a credit card through the monitor on the seat back in front of him or by a licensing agreement with the carrier.
9. Fan Blogs (with Advertising)
Blogs (Web Logs or journals) are becoming ubiquitous on the internet. Although the bane of some in the sports industries, they have become a fixture in the sports landscape.127 They are a way for fans to express their opinions on a forum of their peers. Presently, various fans may have their own blogs where they can rant about every possible bit of minutia involving their team. Why not channel this by providing fans with the opportunity to post their thoughts on the team’s webpage? It would have to be a relatively open forum allowing fans to be critical of owners, players, and management alike. The owner, manager and players might occasionally post their own thoughts on this blog, thus encouraging fans to frequently check in to see who is saying what. By channeling fans onto the team’s own, free blog, the team could then sell advertisements and merchandise on its blog page.
10. Gaming
Professional sports and gaming present a paradox. On one hand, professional sports benefit indirectly from gaming in that placing wagers on outcomes of games and other events increases brand awareness and fan interest. On the other hand, direct involvement between the leagues and gaming establishments may call into question the integrity of the game, price shaving, throwing a competition, etc. From a revenue generating perspective, however, gaming is the proverbial “elephant in the room.” Gaming must be addressed in a careful, deliberate manner, eschewing hyperbole and “parades of horribles.” There are many ways in which both the integrity of the game may be preserved and revenues from gaming enjoyed by professional sports teams. It really is just a matter of time.
A common approach may be the simple raffle. A team could raffle off choice sideline seating, a court or dugout presence, ride a team flight or bus, or toward an even bolder step, a chance to call a play. To be sure, there would be substantial push back. But there is with any innovation.
….
A professional sports league could run the same program, partnering with a state, an Indian tribe, or the federal government through a national lottery. It could even earmark a large percentage of revenue to its charitable foundations. Thus, there are ways by which a league could limit its operational involvement in the gaming activity. Ultimately, gaming provides new opportunities for revenue growth, expansion of the fan base, content for advertising, and a new way by which fans may experience a game.
[Ed. Note: Author’s discussion of fantasy leagues is omitted.]
….
V. OBSERVATIONS
….
The coming revolution in revenue is like the runners at second and third—ducks on the pond, golden opportunities if one acts thoughtfully and boldly. The real question is whether the leagues pick up the runners. If they execute properly, we can all come out winners; if not, they will continue a revenue slide as other forms of entertainment compete for our dollar. The key is an understanding of two fundamental drivers: (1) content is everything, and (2) technology (including, but not limited to the Internet) delivers content. Those that can develop a revenue model that integrates both drivers will succeed.
Only the most naive would reject the notion that new technologies have changed the game and the way fans experience the game. The Internet, just one ubiquitous example of the new technologies saddling up to the sports industry, has done more than change sports—it has transformed sports. Not only is the Internet a vehicle for online retailing of merchandise and a stage for advertising, it is also one’s own highlight vault and mirror into the experience of professional sports. With the advent of the Internet and its accessibility through the worldwide web, the sports industry has mutated. Sports are no longer sports plus the Internet; they are a whole new industry—“new, interactive sports.” Those business competitors that recognize this seismic shift will be able to position their teams, league, or organization to reap the advantages of the new technologies and the new markets. Those that do not, will fail. Ducks on the pond, indeed.
Notes
1. Craig Lambert, Has Winning on the Field Become Simply a Corporate Triumph?, HARV. MAG., Oct. 2001, available at http://www.harvardmagazine.com/on-line/09014.html.
2. Id. The reader will notice that in this article, the National Hockey League (NHL) has been left out …
3. Sports teams also provide an opportunity for state and local taxing authorities to grow their respective tax bases. For example, in a financial report prepared for the Minnesota State Legislature on sports activity conducted at the Metrodome (NFL Minnesota Vikings, MLB Minnesota Twins, and Big Ten University of Minnesota Gophers football), the following taxes are collected: (1) sales tax on food and alcohol; (2) 10% ticket tax (including complimentary tickets) and 6.5% state sales tax on tickets (in addition to the 10% ticket tax); (3) 6.5% gross receipts tax on merchandise licensed by professional and collegiate sports teams; (4) personal income tax paid by visiting teams; (5) lottery games with a sports theme; and (6) tax on rental vehicles in the Metro area. See Paul Wilson & Mary Jane Hedstrom, Appendix C: Summary of Revenue Sources, Minn. Leg. (January 31, 2002) (on file with author). See also I.R.S., Sports Franchises, Market Segment Specialization Program Training 3123-005 (8-99); TPDS No. 839831 (on file with author).
4. Sports is big business in the United States and internationally. The Sports Industry, Bus. & Econ. Research Advisor (BERA) (2005), http://www.loc.gov/rr/business/BERA/issue3/issue3_main.html.
5. To say that the sector is well known is not to suggest that the sector is static. On the contrary, the sports sector is dynamic. For an excellent book on the evolution of the modern sports industry that includes discussions on sponsorships, franchise relocation, radio and television, stadium issues, and endorsements, see PHIL SCHAAF, SPORTS, INC.: 100 YEARS OF SPORTS BUSINESS (2004). See also THE ECONOMICS OF SPORT VOLUME I (Andrew Zimbalist ed., 2001) (covering many aspects of the business of sports).
6. See generally WILKOFSKEY GRUEN ASSOC., GLOBAL ENTERTAINMENT AND MEDIA OUTLOOK: 2005–2009: FORECASTS AND ANALYSIS OF 14 INDUSTRY SEGMENTS (6th ed. 2005).
….
14. I.R.S., supra note 3.
15. See National Football League website, www.nfl.com (last visited May 31, 2006).
16. The Business of Professional Football, Bus. & Econ. Research Advisor (BERA) (2005), http://www.loc.gov/rr/business/issue3/football.html.
….
26. The Business of Professional Football, supra note 16.
….
28. See Soonhwan Lee & Hyosung Chun, Economic Values of Professional Sports Franchises in the United States, 5 SPORTS JOURNAL (2002), available at http://thesportsjournal.org/2002Journal/Vol5-No3/economic-values.htm.
29. The Business of Professional Football, supra note 16.
….
31. The current agreement with the NFL is an eight-year contract that totals $17.6 billion. Kagan, supra note 25, at 45. About 65% of all revenues of NFL teams are from television rights licensing. Lee & Chun, supra note 28.
32. Lee & Chun, supra note 28.
33. The Business of Professional Football, supra note 16.
….
35. Kagan, supra note 25, at 64.
36. The Business of Professional Football, supra note 16.
….
45. Major League Baseball, www.mlb.com (last visited June 5, 2006).
46. … For interesting treatments of the business of baseball, see Andrew Zimbalist, May the Best Team Win: Baseball Economics and Public Policy (2003); Fred Claire with Steve Springer, My 30 Years in Dodger Blue (2004); Charles P. Korr, The End of Baseball as We Knew It: The Players Union, 1960-81 (2004); Fay Vincent, The Last Commissioner: A Baseball Valentine (2002); Marvin Miller, A Whole Different Ball Game: The Inside Story of the Baseball Revolution (2004); John Helyar, Lords of the Realm (1995); Stefan Szymanski & Andrew Zimbalist, National Pastime: How Americans Play Baseball and the Rest of the World Plays Soccer (2005).
47. Abner Doubleday, BaseballLibrary.com, http://www.baseballlibrary.com/baseballlibrary/ballplayers/D/Doubleday_Abner.stm (last visited July 25, 2006).
48. Reds Timeline History Highlights, http://mlb.mlb.com/NASApp/mlb/cin/history/timeline1.jsp (last visited July 25, 2006).
49. National League, http://www.ringsurf.com/info/Sports/Baseball/National_League/ (last visited July 25, 2006).
….
57. See generally Richard C. Levin et al., THE REPORT OF THE INDEPENDENT MEMBERS OF THE COMMISSIONER’S BLUE RIBBON PANEL ON BASEBALL ECONOMICS (July 2000).
58. Baseball, USA Today Baseball Weekly.com, Dec. 5, 2001, http://www.usatoday.com/sports/baseball/stories/2001-12-05-focusexpenses.htm.
….
60. Tim Reason, Squeeze Play, CFO.com, Apr. 1, 2004, http://www.cfo.com/article.cfm/3012785?f=search Baseball, USA Today Baseball Weekly.com, http://www.usatoday.com/sports/baseball/stories/2001-12-05-focusexpenses.htm.
61. Id.
62. Id.
63. Lee & Chun, supra note 28.
….
68. National Basketball Association, www.nba.com (last visited July 28, 2006).
….
77. Lee & Chun, supra note 28.
78. Kagan, supra note 76, Executive Summary.
….
88. See Reason, supra note 60.
89. Id.
90. Id.
91. Id.
92. For an interesting take on luxury suites, see Lambert, supra note 1.
93. Lee & Chun, supra note 28.
94. Id.
95. Id.
96. Id.
97. Id.
….
103. Lee & Chun, supra note 28.
104. Id.
105. Wilson & Hedstrom, supra note 3.
106. Id.
….
109. Horrow, supra note 81.
….
112. Horrow, supra note 81.
113. Id.
114. Id.
115. Id.
116. Id.
….
122. See Darren Rovell, The Tangled Web of Sports and Advertising, Espn.com, May 6, 2004, http://sports.espn.go.com/espn/sportsbusiness/news/story?id=1795742; Spiderman Bases Shot Down, USAToday.com, May 6, 2004, http://www.usatoday.com/sports/baseball/2004-05-06-spider-man-plan-dropped_x.htm.
….
125. See Interactive TV: The Opportunities for Sport, available at http://www.sportbusinessassociates.com/sports_reports/interactive_tv.htm (last visited June 6, 2006).
126. Global Interactive Sports TV Revenues to Increase, Indiantelevision.com, http://www.indiantelevision.com/headlines/y2k3/mar/mar92.htm (last visited June 6, 2006).
127. See, e.g., Sports Illustrated, Blog Central, http://sportsillustrated.cnn.com (last visited June 6, 2006).
….
IMPACT OF STAR PLAYERS ON GATE RECEIPTS
STARS AT THE GATE: THE IMPACT OF STAR POWER ON NBA GATE REVENUES
David J. Berri, Martin B. Schmidt, and Stacey L. Brook
Competitive balance in professional team sports has been the subject of numerous theoretical and empirical publications. The theoretical literature argues competitive imbalance, or the on-field domination of one or a small number of organizations, reduces the level of uncertainty of outcome and consequently reduces the level of consumer demand.1 The empirical literature, whether examining game day attendance2 or aggregate season attendance,3 has also generally confirmed a relationship between uncertainty of outcome or competitive balance and demand for tickets to sporting events.
Decision makers in the professional sports industry have not needed economists to understand this basic relationship. Virtually from the inception of organized sports in North America, leagues have enacted various institutions to promote competitive balance.4 Such institutions include the reserve clause, the rookie draft, payroll caps, salary caps, revenue sharing, and luxury taxes. Despite the similarity of effort, professional team sports leagues continue to have varying degrees of competitive balance.
The variability of competitive balance across professional team sports was illustrated by Quirk and Fort (1992). One of the findings of this seminal work, extended by Berri and Vicente-Mayoral (2001) and Berri (in press), was the relative lack of competitive balance in the National Basketball Association (NBA). The relative imbalance continued in spite of the NBA’s institution of a rookie draft, payroll caps, revenue sharing, free agency, and, at times, a reserve clause. By virtually any measure, the NBA has been unable to achieve the level of competitive balance observed in the other North American professional sports leagues.
The purpose of this article is not to examine why the NBA is competitively imbalanced but rather to examine the impact competitive imbalance has on consumer demand for the NBA product. The works of Knowles, Sherony, and Haupert (1992) and Rascher (1999) found that Major League Baseball attendance was maximized when the probability of the home team winning was approximately .6.5 These studies suggest that consumers prefer to see the home team win but do not wish to be completely certain this will occur prior to the game being played. For fans of NBA teams located near the bottom of the league rankings, though, the opposite is often true. Not only is their team not likely to win, but often the fan is quite certain of this negative outcome. The question is therefore “How do these NBA teams still maintain demand in the face of the certainty of an unwelcomed outcome?”
One possible strategy is for teams to shift their focus from the promotion of team performance to the promotion of individual stars. Hausman and Leonard (1997) found the presence of stars had a substantial affect on television ratings, even after controlling for team quality. Although this work also considered the effect stars had on team attendance, the inquiry into team attendance was “less formal” (p. 609). In essence, these authors only looked at how attendance changed when a team either added or played one of the stars these authors identified.
An objective of the present work is to extend the work of Hausman and Leonard (1997) in a more comprehensive study of the relationship between team attendance and both team performance and the team’s employment of star players. The structure of the study is as follows: The following section details the empirical model we will utilize to examine the demand for professional basketball. This discussion is followed by a review of the econometric estimation of the aforementioned model. The final section offers concluding observations.
THE DATA TO BE EMPLOYED
Given rudimentary consumer theory, demand is primarily determined by three factors: team performance, franchise characteristics, and market characteristics. The literature on attendance in professional sports has turned to a variety of factors designed to capture these primary determinants of demand. Table 11 lists our choice of dependent and independent variables. In addition to listing the variables and the nomenclature we employ, we report the hypothesized effect of the independent variables and corresponding descriptive statistics. We follow with a brief review of the theoretical reasoning behind this chosen list of factors.
Consumer Demand
The data utilized to tabulate the variables listed in Table 11 comes from four seasons, beginning with the 1992–1993 campaign and concluding with the 1995–1996 season.6 A common practice within the professional team sports literature is to utilize aggregate attendance data as the dependent variable in a study of consumer demand. Over the period our study highlights, though, such a choice is problematic. Specifically, if one compares the reported attendance figures to the maximum attendance the stadium capacity of these teams would allow, one would note that of the 108 teams considered, 43 teams, or 40%, sold out every single home game. Given the divergence between attendance and demand, we employ gate revenue7 as a proxy for the level of consumer attraction to professional basketball.8 The use of gate revenue incorporates price adjustments and therefore allows for full variation in the dependent variable.9
Team Performance
The most common measure of team performance is regular season wins. Team performance can also be captured via playoff wins, lagged values of both regular season and playoff victories, and past championships won. Following Berri and Brook (1999), the effect of past championships is estimated via… calculation involved assigning a value to a team for each championship won in the past 20 years. This value was 20 if the team captured a championship during the prior season, 19 if the championship was won two seasons past, and so forth.10
In addition to these measures, we also consider the impact of a team’s star attractions. The relationship between demand and stars has been considered by Scott, Long, and Sompii (1985), Brown, Spiro, and Keenan (1991), and Burdekin and Idson (1991), as well as the aforementioned work of Hausman and Leonard (1997). Of these studies, only Brown et al. (1991) was able to find a statistically significant relationship between a measure of consumer demand and a team’s star attractions.
Each of these studies employed a different definition of star attraction. Scott et al. (1985) defined a superstar as “a player who has made the All-Pro team five times or, if he has only played a few years, dominates his position” (p. 53). Brown et al. (1991) defined a superstar as “a player who has played in the NBA All-Star Game for at least 50% of his years in the league” (p. 338). Finally, Burdekin and Idson (1991) considered a player a star if he was voted by the media to either the first or second All-NBA teams.
Given our focus on consumer demand, we sought a measure that would directly incorporate fan preference. We therefore introduced All-Star Game votes as our measure. Specifically, the starters for the midseason All-Star Game are chosen via balloting by the fans. We were able to obtain the number of votes received by the top 10 players at guard, forward, and center.11 For each team, we summed the number of votes received by the players employed. In addition, following Hausman and Leonard (1997), we also considered dummy variables for four superstars: Michael Jordan, Shaquille O’Neal, Grant Hill, and Charles Barkley. Each of these players was either explicitly noted by Hausman and Leonard (Jordan, O’Neal) or led the league in All-Star votes received in one of the years examined in the study (Jordan, Barkley, Hill).
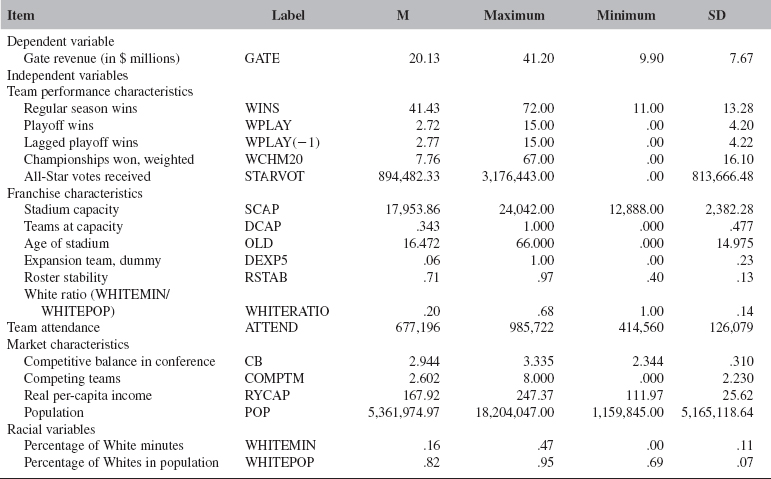
Source: Journal of Sports Economics. Used with permission.
Franchise Characteristics
In general, the variables utilized to capture the characteristics of the franchise follow convention. Both stadium capacity and being an expansion team are expected to have a positive affect on both team attendance and team revenue. Along similar lines, the age of a stadium is expected to decrease demand….
As noted, the data set contains a number of teams that consistently sell out their venue. Shmanske (1998), in a study of golf courses, noted that an increase in demand would elicit different responses from courses at capacity relative to those that still were capable of serving additional customers. Specifically, a course with excess capacity could increase both quantity and price in response to an increase in demand. Courses at capacity, though, could only increase price. Therefore, as Shmanske argued, the estimated parameters in the demand function may differ depending on whether an organization is at capacity….
In addition to these factors, we consider a factor suggested by Blass (1992) and Kahane and Shmanske (1997). Each of these authors considered the effect that roster stability or, conversely, turnover has on team attendance. Although Blass failed to find a relationship between team attendance and player tenure with the team, Kahane and Shmanske presented evidence that a negative relationship existed between roster turnover and team attendance. In other words, the more stability a roster exhibits from year to year, the greater the level of consumer demand. To the best of our knowledge, this study is the first to consider the affect of this variable on consumer demand in the NBA. Roster stability was measured by examining the minutes played by returning players over both the current and prior seasons. We then averaged the percentage of minutes played by these players for both of these campaigns.14.
This exposition began by noting the lack of competitive balance in the NBA. Previously, Schmidt and Berri (2001) found that the level of competitive balance affected consumer demand in Major League Baseball. To ascertain if such a relationship exists for the NBA, a measure of competitive balance is required. Following the lead of Quirk and Fort (1992), who in turn built on the writings of Noll (1988) and Scully (1989), competitive balance can be measured by comparing
the actual performance of a league to the performance that would have occurred if the league had the maximum degree of competitive balance in the sense that all teams were equal in playing strengths. The less the deviation of actual league performance from that of the ideal league, the greater is the degree of competitive balance. (Quirk & Fort, 1992, p. 244)
….
As noted by Quirk and Fort (1992), the idealized standard deviation represents the standard deviation of winning percentage if each team in a league has an equal probability to win each game. The greater the actual standard deviation is relative to the ideal, the less balance exists within the professional sports league. The measure of competitive balance … was calculated for each conference, Eastern and Western, and each year, examined by this study.
The remaining market characteristics utilized follow the standard list employed in the literature. The number of competing teams is simply the number of teams from each of the four major North American professional team sports located in each franchise’s city. This is expected to have a negative effect on consumer demand. In contrast, population and per-capita income should each increase team revenue. Population is measured for each team’s standard metropolitan area. We also consider per-capita income in real terms, which we ascertained by adjusting nominal income for each city’s cost of living.15
The final independent variables listed in Table 11 are associated with measuring the effect the racial composition of the team has on NBA demand. Following the lead of Hoang and Rascher (1999), we employed the ratio of the percentage of minutes on the team allocated to White players (WHITEMIN) to the percentage of White persons in the population of the city (WHITEPOP). If this variable increases in size, the racial match between the team and the city improves. Consequently, we would expect WHITE-RATIO to have a positive sign if people within the market prefer a team that represents the racial mix of the city.16
….
Econometric Issues and Estimation
….
The Estimation of the Model
….
The stated focus of this article is the effect two measures of team performance, wins and the star attraction, have on team revenue. The choice of functional form does not appear to dramatically effect the estimation of the relationship between measures of team wins and revenue. With respect to either functional form, a statistically significant relationship for regular season wins, playoff wins, and championships won is found. Furthermore, the reported relationships conform to the expected signs. The effect of star votes, though, does differ substantially across the two models. According to the linear model, the functional form frequently utilized in the literature, no relationship exists between a team’s accumulation of star votes and gate revenue.
….
Consistency in results was found with respect to the other variables considered. For example, all of the other variables designed to capture team performance were statistically significant. In addition, stadium capacity was found to have a significantly positive affect on gate revenue. In other words, with respect to a team’s arena, bigger does appear to be better. Finally, of the specific players we examined, only DHILL was found to be statistically significant. The sign, though, was negative, indicating that the presence of Grant Hill actually diminished gate revenues in Detroit. Given the failure of the Pistons to win a playoff game in Hill’s first two seasons, though, a more plausible explanation is that the Pistons’ failures on the floor led to declines at the gate that the star power of Hill could not overcome. Unlike Hausman and Leonard (1997), none of the other players we examined were found to have a statistically significant effect on gate revenue. Such a result suggests that individual players do not have a significant effect on revenue beyond their contribution to team wins.23
In addition… a number of variables were found to not statistically affect gate revenue. This list includes the level of roster stability on the team, per-capita income in the market, the measure of racial matching, and the level of competitive balance in the conference. The latter result is inconsistent with the work of Schmidt and Berri (2001), who found competitive balance to significantly affect Major League Baseball attendance. One should note that the previous work of Schmidt and Berri considered a much longer time period than that which was considered for this study. However, such results do suggest that NBA fans do not respond as baseball fans do to the level of competitive balance in the sport.
The Effect of Wins and the Star Attractions
With the choice of models made and subsequently estimated, what is the answer to the question posed by this inquiry? To answer this question, we turn to an examination of the economic significance of both wins and star votes.
….
In terms of elasticities, revenue is the least responsive to the star attraction. The relative effect of wins and star power is also revealed in an examination of the marginal values. An additional win produces $83,037 in GATE revenue, on average. Given that one All-Star vote generates, on average, $.22, the players on a team would need to receive nearly 370,000 votes to generate the revenue a team receives from one win. To equal the revenue generated by 41 wins, or the average number of regular season victories, a team would need to receive approximately 15.1 million votes. Such a total represents nearly 5 times the maximum number of votes any team received in the sample. These results suggest that it is performance on the court, not star power, that attracts the fans in the NBA.
How does the value of a win differ between large- and small-market teams? … one can see that increases in population will increase gate revenue. Specifically, one additional person is worth, on average, $.40. Given this result, moving to a city with an additional million persons is worth $399,503. Such an increase in revenue would increase the value of a win by $1,648. Again, consistent with the work of Rottenberg (1956), additional persons in the population enhance the monetary value of on-court performance.
One final extension is the issue of pricing strategies of NBA teams.24 Past studies (see Burdekin & Idson, 1991; Demmert, 1973; Fort, in press; Fort & Quirk, 1995, 1996; Heilmann & Wendling, 1976; Jennett, 1984; Medoff, 1986; Noll, 1974; Scully, 1989) have presented both empirical evidence and theoretical arguments that teams in professional sports may price in the inelastic portion of the demand curve. We therefore included attendance as an additional regressor. If the coefficient on attendance is negative, one may infer that the teams are posting inelastic prices.
… Such results suggest that NBA teams do not set prices in the inelastic range. Given the capacity constraints noted above, such a finding should not surprise. One caveat to this result is that NBA teams may benefit from additional revenue from parking and concessions by lowering prices and hence attracting additional fans. The size of NBA facilities, though, limits this strategy option. These results are available from the authors on request.
CONCLUDING OBSERVATIONS
The lack of competitive balance in professional basketball leads one to question how one can best generate demand for this sport. Hausman and Leonard (1997) suggested that it is star power, rather than on-court productivity, that attracts the fans. Although star power was found to be statistically significant in this present study, the ability of a team to generate wins appears to be the engine that drives consumer demand.
The propensity of NBA teams to sell out each and every contest shifted the focus of this study from attendance to gate revenue….
One final question remains: Do the reported results suggest that stars are not important in the NBA? The true power of star power may lie in the revenue received by the star’s opponent.25 In other words, the true power of the star may lie in his ability to enhance attendance on the road….
Notes
1. See Rottenberg (1956), Neale (1964), El-Hodiri and Quirk (1971), and Quirk and Fort (1992).
2. See Jennett (1984), Peel and Thomas (1988), Borland and Lye (1992), Knowles et al. (1992), and Rascher (1999).
3. See Schmidt and Berri (2001).
4. We are focusing on the stated objective of these institutions. As noted first by Rottenberg (1956), if transaction costs are low, the reserve clause would not likely affect competitive balance. Rather, its primary affect would be on the profit potential of the individual teams. A similar story could be told with respect to the rookie draft.
5. Knowles et al. (1992), in their study of the 1988 Major League Baseball season, found that balance is achieved (i.e., attendance is maximized) when the probability of the home team winning was .6. Rascher (1999) offered an examination of the 1996 Major League Baseball season that examined a larger sample of games and a greater number of independent variables.
Rascher’s study demonstrated that fans prefer to see the home team win, and consistent with the work of Knowles et al., fan attendance is maximized when the home team’s probability of winning equals .66. Each of these studies suggested that a home team with a high probability of winning the contest will see a decline in fan attendance, indicating that uncertainty of outcome is a significant determinant of demand.
6. For the first 3 years considered, the population of NBA teams equaled 27. For the 1995–1996 season, 2 teams were added in Vancouver and Toronto. The model we employ, though, utilizes lagged values of several independent variables. Consequently, data from these 2 teams could not be utilized, and the final number of observations employed was 108.
7. Data on gate revenue were reported in various issues of Financial World (Atre et al., 1996; Badenhausen, Nikolov, Alkin, & Ozanian, 1997; Ozanian, Atre et al., 1995; Ozanian, Fink, et al., 1994). The last season this periodical reported such information was the 1995–1996 campaign. To the best of our knowledge, such information was not reported for the 1996–1997 campaign. Data on revenue are reported for more recent years by Forbes magazine, although Forbes does not report data specifically on gate revenue. Rather, a team’s media revenues, stadium revenues, and gate are aggregated and simply reported as total revenue in Forbes. This change in reporting prevents us from examining seasons after 1995–1996.
8. The examination of team revenue was initially conducted by Scully (1974) in his seminal examination of marginal revenue product. A list of additional studies that have examined revenue would include Medoff (1976), Scott et al. (1985), Zimbalist (1992), and Berri and Brook (1999).
9. We would like to thank an anonymous referee for noting the potential link between gate revenue and other revenue streams. For example, if stadium revenues (concessions, parking, and so forth) are high, the firm has an incentive to lower ticket prices so that more people are admitted to take advantage of this revenue stream. In addition, one might expect a link between gate and media revenues. Again, as the referee notes, a sold-out stadium may enhance TV ratings, hence enhancing media revenues. One possible solution is to include stadium and media revenues as additional regressors in the model. However, because such revenue streams would be related independent of causal factors, such a solution is not attractive econometrically. Indeed, when such a model was estimated, both stadium and media revenues were found to be positively related to gate revenue. Furthermore, the remaining regressors are largely unaffected by the inclusion of these two variables. Therefore, we have chosen to omit the results with these two regressors. Such results are available from the authors on request.
10. Data on regular season wins, playoff wins, and championships won were obtained from various issues of The Sporting News: Official NBA Guide (1993–1996).
11. These data were obtained from various daily newspapers. The top finishers at each position are chosen as starters for the midseason classic. In addition, the guard and forward receiving the second most votes at these positions are also named as starters. Because only one center is chosen, the above analysis only considered the top five recipients of votes at this position.
….
14. An example may help illustrate the method employed to measure roster stability. During the 1994–1995 season, George McCloud’s NBA career was resurrected by the Dallas Mavericks, who employed him for 802 minutes. The following year, McCloud’s minutes increased more than threefold to 2,846. If we only consider McCloud’s minutes during the 1995–1996 season, we would be overstating the level of roster stability because McCloud was not an integral part of the Mavericks in 1994–1995. Consequently, in measuring roster stability, we consider more than just how many minutes a player played during the current season but also the number of minutes the team allocated to the player during the prior campaign. We wish to acknowledge the assistance of Dean Oliver, who argued that a better label for this measure is roster stability, as opposed to roster turnover. Data on minutes played, utilized to construct the roster stability variable, were obtained from various issues of The Sporting News: Official NBA Guide (1993–1996).
15. Data on metropolitan statistics area (MSA) population was taken from Missouri State Census Data Center (2001). Personal income came from U.S. Bureau of Economic Analysis (1992–1996), whereas MSA Consumer Price Indexes came from U.S. Bureau of Labor Statistics (1992–1996).
16. An anonymous referee noted that WHITERATIO only implies an improvement in racial match if it does not exceed 1. If the value of the ratio exceeds 1, then further increases actually imply a worsening of the racial match. Although this is true theoretically, in the sample, the value of this variable was below1 for every team. Data on the size of the White population in each city was obtained from Missouri State Census Data Center (2001). For the racial mix of the team, we consulted both The Sporting News: Official NBA Guide (1993–1996) and the pictures of the players offered in The Sporting News NBA Register (1993–1996).
….
23. In a previous version of this article, we estimated the double-logged model without DCAP, CB, and the year fixed effects. The results with respect to the remaining independent variables were quite similar. The lone exceptions were the star dummy variables. In the previous estimation, DSHAQ was positive and significant, and the remaining dummies were statistically insignificant. As noted, in the current formulation, DSHAQ is now statistically insignificant whereas DHILL has become statistically significant. Such variation in results cast suspicion on the validity of these dummy variables.
24. We wish to thank an anonymous referee for raising this issue.
25. We wish to thank an anonymous referee for raising this issue.
References
….
Berri, D. J. (In press). Is there a short supply of tall people in the college game. In J. Fizel & R. Fort (Eds.), Economics of collegiate sports. New York: Praeger.
Berri, D. J., & Brook, S. L. (1999). Trading players in the NBA: For better or worse. In J. L. Fizel, E. Gustafson, & L. Hadley (Eds.), Sports economics: Current research. New York: Praeger.
Berri, D. J., & Vicente-Mayoral, R. (2001). The short supply of tall people: Explaining competitive imbalance in the National Basketball Association. Unpublished manuscript.
Blass, A. A. (1992). Does the baseball labor market contradict the human capital model of investment? Review of Economics and Statistics, 74, 261–268.
….
Brown, E., Spiro, R., & Keenan, D. (1991, July). Wage and non-wage discrimination in professional basketball: Do fans affect it? American Journal of Economics and Sociology, 50(3), 333–345.
Burdekin, R. C., & Idson, T. L. (1991). Customer preferences, attendance and the racial structure of professional basketball teams. Applied Economics, 23, 179–186.
….
Demmert, H. (1973). The economics of professional team sports. Lexington, MA: Lexington Books.
….
Fort, R. (In press). Inelastic sports pricing. Managerial and Decision Economics.
Fort, R., & Quirk, J. (1995, September). Cross-subsidization, incentives, and outcomes in professional team sports. Journal of Economic Literature, 33, 1265–1299.
Fort, R., & Quirk, J. (1996). Over-stated exploitation: Monopsony versus revenue sharing in sports leagues. In J. Fizel, E. Gustafson, & L. Hadley (Eds.), Baseball economics: Current research. New York: Praeger.
Hausman, J. A., & Leonard, G. K. (1997). Superstars in the National Basketball Association: Economic value and policy. Journal of Labor Economics, 15(4), 586-624.
Heilmann, R. L., & Wendling, W.R. (1976). A note on optimum pricing strategies for sports events. In R. E. Machol, S. P. Ladany, & D. G. Morrison (Eds.), Management science in sports. Amsterdam: North-Holland.
Hoang, H., & Rascher, D. (1999, January). The NBA, exit discrimination, and career earning. Industrial Relations, 38(1), 69–91.
Jennett, N. I. (1984). Attendance, uncertainty of outcome and policy in Scottish League Football. Scottish Journal of Political Economy, 31(2), 176–198.
Kahane, L., & Shmanske, S. (1997, April). Team roster turnover and attendance in Major League Baseball. Applied Economics, 29(4), 425–431.
Knowles, G., Sherony, K., & Haupert, M. (1992, fall). The demand for Major League Baseball: A test of the uncertainty of outcome hypothesis. The American Economist, 36(2), 72–80.
Medoff, M. (1986). Baseball attendance and fan discrimination. Journal of Behavioral Economics, 15, 149–155.
….
Noll, R. (1974). Attendance and price setting. In R. Noll (Ed.), Government and the sports business. Washington, DC: Brookings Institution.
Noll, R. (1988). Professional basketball (Working Paper No. 144). Palo Alto, CA: Stanford University.
….
Quirk, J., & Fort, R. (1992). Pay dirt: The business of professional team sports. Princeton, NJ: Princeton University Press.
Rascher, D. (1999). A test of the optimal positive production network externality in Major League Baseball. In J. Fizel, E. Gustafson, & L. Hadley (Eds.), Sports economics: Current research (pp. 27–45). New York: Praeger.
Rottenberg, S. (1956, June). The baseball player’s labor market. Journal of Political Economy, pp. 242–258.
Schmidt, M. B., & Berri, D. J. (2001). Competition and attendance: The case of Major League Baseball. Journal of Sports Economics, 2(2), 147–167.
Scott, F., Jr., Long, J., & Sompii, K. (1985). Salary vs. marginal revenue product under monopsony and competition: The case of professional basketball. Atlantic Economic Journal, 13(3), 50–59.
Scully, G. (1989). The business of Major League Baseball. Chicago: University of Chicago Press.
Scully, G. W. (1974). Pay and performance in Major League Baseball. American Economic Review, 64, 917–930.
Shmanske, S. (1998, July). Price discrimination at the links. Contemporary Economic Policy, 16, 368–378.
….
VEND IT LIKE BECKHAM: DAVID BECKHAM’S EFFECT ON MLS TICKET SALES
Robert Lawson, Kathleen Sheehan, and E. Frank Stephenson
In January 2007, Major League Soccer (MLS) announced that international soccer sensation David Beckham would be joining the league. Beckham was signed to a large five-year contract with the Los Angeles Galaxy, with both the MLS and LA Galaxy sharing the cost of his contract. Beckham thus became the first player signed under MLS’s new Designated Player Rule, which allows teams to sign one player outside of the salary cap with the league paying $400,000 [Ed. Note: now $335,000] of the player’s contract. Although the exact terms of Beckham’s contract have not been revealed, ESPN.com (2007) and other media sources have reported a figure of around $250 million for the entire five-year package, including various commercial endorsements. Presumably, MLS and its sponsors hope that the addition of Beckham will increase revenues from ticket, merchandise, advertising, and sponsored product sales.
Examining the NBA, Hausman and Leonard (1997), Berri et al. (2004), and Berri and Schmidt (2006) found that star players create positive externalities. When superstars such as Michael Jordan and Larry Bird play on the road, home teams experience an increase in attendance and revenue even though they do not contribute to the cost of the superstar’s contract. Conversely, teams signing superstars do not receive the full marginal revenue product of the superstar. Hence, the MLS Designated Player Rule may be an attempt to better align the costs and benefits of superstars by having the league pay a portion of star players’ salaries. The rule is probably also an acknowledgment that a superstar such as Beckham may be necessary to firmly establish a league that has had mixed success in attracting fans since its inaugural season in 1996.
This paper examines Beckham’s participation in MLS soccer and how it affected ticket sales for the 2007 season. Beckham’s contract start date was July 1, which is about midway through the season. Because of injury, he did not play his first official game for the Galaxy until August 15. Injuries continued to plague him through the remainder of the season, and of the 17 games (out of the 30-game season) for which he was on the roster, Beckham played in just five games (two at home and three on the road). However, fans may have already purchased tickets to the games he had been expected to play. Our analysis captures both the effect of Beckham’s being expected to play and the effect of his actually playing on ticket sales. This paper also allows for the possibility of other star players increasing attendance by including United States men’s national team players as an explanatory variable.
DATA AND EMPIRICAL MODEL
An informal look at the data shows that David Beckham did indeed increase ticket sales. Average sales for all MLS games during the 2007 season were 16,758. Average ticket sales for games for which Beckham was on the roster were 29,694, a dramatic increase. For games in which Beckham actually played, ticket sales more than doubled to an average of 37,659. These findings show that Beckham did appear to increase attendance. However, because other influences may affect ticket sales, isolating Beckham’s effect on attendance requires multivariate regression analysis.
The regression analysis uses match level data from the 2007 season. There were 13 teams in the league, and each team played 15 home games; thus there are 195 observations.
Attendance as a percentage of stadium capacity (ATTENDPCT) is the dependent variable. Specifying attendance as a percentage of capacity is necessary because stadiums have different capacities and because capacity constraints are binding for 10 games in our sample (including three of the five Beckham played). Attendance data are obtained from mlsnet.com and, to the best of our knowledge, reflect tickets sold rather than game attendance. Stadium capacity data are obtained from team websites and from team or stadium Wikipedia entries. Capacity varies greatly across teams; some teams play in modern soccer-specific venues seating around 20,000, while other teams play in NFL stadiums seating up to roughly 80,000. Descriptive statistics for ATTENDPCT and other variables can be found in Table 12.
The explanatory variables of interest are BECK-HAMROSTER and BECKHAMPLAYED, dummy variables taking a value of one for games for which David Beckham was on the LA Galaxy’s active roster and games in which David Beckham actually played, respectively. Hence, our specification captures both increases in advance ticket sales and increases in match day sales.
We take two approaches to control for city specific factors affecting attendance. In one approach, following from Jewell and Molina (2005), we include several variables for various attributes of the home team’s market. These include population (in millions), income per capita (in thousands), Hispanics as a share of the population, blacks as a percentage of the local population, home team points from the previous season (more points indicates a better quality team), and dummies for other sports franchises in the same market (NBA, NFL, MLB, NHL, and dummy if a city has a team in all four major sports leagues). In the other approach, we include team specific dummy variables in the model in lieu of these home market variables. (FC Dallas is the omitted team.) Because the home team market variables such as population, income, and the minority population shares do not vary over the season, we cannot use these measures and the city dummies simultaneously without having perfect multicollinearity.
Table 12 Descriptive Statistics
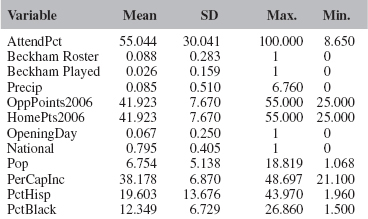
Source: International Journal of Sport Finance. Used with permission from Fitness Information Technology.
As for other right-hand side variables, evidence (Bruggink & Eaton, 1996; Garcia & Rodríguez, 2002; Chupp et al., 2007) indicates that precipitation depresses sporting event attendance, so the number of inches of precipitation on the day of the match is included as a regressor. Our model also includes a dummy variable for each team’s first home match of the season and a dummy variable for matches featuring one or more players who were members of the 2006 U.S. World Cup team. National team players are looked to be the best United States players and the players with the most name recognition, so fans may be excited to see them play. Because fans may be attracted to better quality play, we also include the opposing team’s points from the previous season.
Lastly, we estimate the model both with and without dummy variables for day-of-week effects, month-of-season effects, and matches played on holidays.
We should note two limitations of our model. First, we do not include a price variable, because consistent data on pricing across teams is not available. (Jewell and Molina, 2005, also omit a price variable from their model.) Second, the model does not include a measure of promotions (e.g., giveaways or entertainment acts) as an independent variable. Promotions have been shown to be important in minor league baseball and to have a positive effect on attendance (Hixson, 2005; Chupp et al., 2007). However, information regarding promotions for MLS is not readily available. Moreover, the omission of promotions variables from soccer attendance studies by Garcia and Rodríguez (2002) and Jewell and Molina (2005) suggests that promotions are not commonly used to increase soccer match attendance.
ESTIMATION RESULTS
… The coefficients on both Beckham variables are large and statistically significant; Beckham’s being on the roster increased ticket sales by 32.7 percentage points of stadium capacity and his actually playing increased ticket sales by an additional 24.3 percentage points of stadium capacity. Hence, Beckham’s playing essentially doubled ticket sales, because the typical match for which Beckham was neither playing nor on the roster was played in a half-full stadium (mean = 52%, median = 45%).
All of the home team market variables except for the dummy for cities having franchises in all four major sports leagues are significantly different from zero; however, several of them have signs at odds with a priori expectations. As might be expected because of their nearly identical seasons, teams playing in cities with MLB franchises have lower attendance; sharing a city with an MLB franchise is estimated to reduce attendance by (a surprisingly large) 16 percentage points of stadium capacity. By contrast, teams located in cities with NFL, NBA, or NHL teams are estimated to have higher ticket sales. Given the popularity of soccer in Latin America, it is not surprising that we find a positive relationship between the Hispanic population share and attendance; a one percentage point increase in the Hispanic population share is associated with a 1.75 percentage point increase in tickets. The positive relationship between the Hispanic population share and ticket sales differs from that of Jewell and Molina (2005).
As for the results at odds with prior expectations, population, income, and home team points from 2006 are all found to be negatively related to attendance as a share of stadium capacity, and the black population share has a positive effect. These findings, however, may be artifacts of some teams playing in stadiums with large capacities and having, ceteris paribus, lower attendance as a share of capacity. For example, Washington is a relatively wealthy city and has the largest black population share; DC United plays in the 56,000 seat RFK Stadium. The New England Revolution plays in 60,000-seat Gillette Stadium; Boston is also a wealthy city with a large population. Moreover, DC and New England had the highest point totals in 2006.
As for the other explanatory variables, opening day attendance is estimated to be about seven percentage points higher than other games and is statistically significant. Rain dampens attendance somewhat (one inch reduces ticket sales by three percentage points) but is not statistically significant. Neither national team players nor opponent points in 2006 are meaningful in magnitude or statistical significance.
….
As before, the Beckham effects are large and statistically significant; Beckham is estimated to increase attendance by approximately 55 percentage points of stadium capacity. As for the other regressors, the signs on precipitation, opposing team points, and national team players are consistent with a priori expectations; however, their marginal effects are modest in magnitude and are not statistically significant…. the inclusion of the day, month, and holiday variables has little effect on the other variables…
The estimated coefficients on the team dummy variables are consistent with the previous discussion of the negative findings for population and income per capita … in columns (1) and (2). Teams such as Kansas City, New England, New York, and Washington that play in large capacity stadiums all have large negative coefficients. Although estimating the relationship between city attributes such as population and income may be difficult using a single season of data, the important finding for our purposes is the consistency of Beckham’s estimated effect regardless of specification. It should also be noted that, to the extent that teams required fans wanting to see Beckham play to purchase multi-game ticket packages or season tickets, the estimated effect of Beckham on ticket sales is understated.
CONCLUSION
As with the findings of superstar externalities associated with NBA players such as Michael Jordan and Larry Bird, we find that David Beckham has a large effect on MLS attendance. Our estimates also allow us to make a rough assessment about whether the additional ticket sales from signing Beckham cover the $400,000 league contribution to his salary. The median MLS stadium seats 27,000 fans, so … a 55 percentage point increase in attendance as a share of stadium capacity implies an additional 14,850 tickets sold. If each additional ticket sold generates an additional $27 in revenue, a conservative assumption based on MLS prices for 2007, then Beckham generates enough additional revenue in each game played to cover the entire $400,000 league contribution to his salary (14,850 × $27 = $400,950). Because each team plays 15 road games, our estimate of the Beckham effect implies that the MLS’s Designated Player Rule should allow the league to pay up to $6,000,000 (= $400,000 × 15) of Beckham’s salary in order to fully internalize the superstar externality.
Turning to Beckham’s value to the LA Galaxy, Mc-Nulty (2007) reported that the Galaxy pays Beckham approximately $9.6 million per year. (This figure implies that about $40 million per year of Beckham’s contract would come from commercial endorsements.) If this report is correct, then our estimates suggest that signing Beckham looks to have been a shrewd deal for the Galaxy. If each ticket sold because of Beckham yields $100 of revenue—a distinct possibility since the Galaxy are selling (in 2008) one zone of tickets for $275 and another section for $150—signing Beckham would mean more than $20 million of additional revenue per year for the team. This would make Beckham’s marginal revenue product for the team at least twice as large as his annual salary.
References
Berri, D. J., Schmidt, M. B., & Brook, S. L. (2004). Stars at the gate: The impact of star power on NBA gate revenues. Journal of Sports Economics, 5(1), 33–50.
Berri, D. J., & Schmidt, M. B. (2006). On the road with the National Basketball Association’s superstar externality. Journal of Sports Economics, 7(4), 347–358.
Bruggink, T. H., & Eaton, J. W. (1996). Rebuilding attendance in Major League Baseball: The demand for individual games. In J. Fizel, E. Gustafson, & L. Hadley (Eds.), Baseball economics: Current research (pp. 9–31). Westport, CT: Prague.
Campbell, M. (2007). Vend it like Beckham. Toronto Star, January 12, D1.
Chupp, A., Stephenson, E. F., & Taylor, R. (2007). Stadium alcohol availability and baseball attendance: Evidence from a natural experiment. International Journal of Sport Finance, 2(1), 36–44.
ESPN.com (2007, January 11). Coming to America: Beckham to sign with Galaxy. Retrieved March 10, 2008, from http://soccernet.espn.go.com/news/story?id=399465&cc=5901
Garcia, J., & Rodríguez, P. (2002). The determinants of football match attendance revisited: Empirical evidence from the Spanish Football League. Journal of Sports Economics, 3(1), 18–38.
Hausman, J. A., & Leonard, G. K. (1997) Superstars in the National Basketball Association: Economic value and policy. Journal of Labor Economics, 15(4), 586–624.
Hixson, T. K. (2005) Price and non-price promotions in minor league baseball and the watering down effect. The Sport Journal, 8(4).
Jewell, R. T., & Molina, D. J. (2005) An evaluation of the relationship between Hispanics and Major League Soccer. Journal of Sports Economics, 6(2), 160–177.
McNulty, D. (2007, April 13) For MLS, Becks is worth the bucks. Toronto Sun, S11.
TICKET PRICING
TICKET PRICES, CONCESSIONS AND ATTENDANCE AT PROFESSIONAL SPORTING EVENTS
Dennis Coates and Brad R. Humphreys
INTRODUCTION AND MOTIVATION
The demand for attendance at major league sporting events has been the subject of a great deal of empirical research over the years. An important barrier to much of this research has been the lack of a long time series of ticket price data, especially for professional football and basketball. Since the early 1990s, Team Marketing Report has published a Fan Cost Index. As part of this index, they collect data on tickets, but also on concessions and parking so that the index measures the full dollar cost of attending a game. The index and its components are available for each of the NFL, NBA, and MLB franchises over the period.
These data make it possible to estimate empirical demand models for the NFL, NBA, and MLB, something that has been difficult since Noll’s (1974) seminal paper. Moreover, the Fan Cost Index data makes it possible to assess the effect of the prices of complementary goods like concessions, parking, and programs on attendance. The Fan Cost Index attempts to paint a complete picture of the cost of attending a sporting event. The addition of the prices of the ancillary purchases related to attendance enables researchers to assess the role of these other prices in the determination of attendance.
Knowing the effects of these other prices is quite important for public policy reasons. Fort (2004) has argued that many researchers find inelastic demand for attendance in professional baseball, despite franchise monopolies, because multiple products—most notably, local TV broad-casts—are being sold. Once the multiple product nature of the franchises is correctly addressed through fuller specification of the revenue functions, then inelastic ticket pricing is implied by profit maximization.
The problem for empirical work is that time-series data sets of local television contract revenues covering many years is not available in any of the sports. Indeed, for the NFL, teams are not able to individually negotiate television contracts. However, with the Fan Cost Index data on concession, parking, and program prices, the analysis of demand can occur while accounting for greater richness in the revenue function of the franchises in all three sports.
This paper uses the Fan Cost Index, and the ticket price component of this index, to estimate the demand for attendance at professional baseball, basketball, and football games from 1991 through 2001. We analyze demand in each of these sports at the franchise level using a time series cross section data set. Price and income elasticities are estimated for each sport, controlling for demand shifters such as the age of the facility in which the franchise plays, the length of time the franchise has been in the city, the size of the city, and the success of the franchise on the field….
The results confirm findings in the literature that demand for tickets is inelastic with respect to price. However, there are differences between sports. For example, while demand is inelastic in both the NBA and MLB, the ticket price elasticities are not generally the same size. The evidence here is that demand for tickets to NFL games is quite unlike demand for tickets to baseball or basketball games. The instruments used to identify the endogenous variables in the MLB and NBA demand equations are not found to be valid in the NFL equations. Coefficient estimates from the NFL equations are, generally, much less likely to accord with demand theory than are the estimates from the MLB and NBA equations. This can be partially attributed to differences in the likelihood of a contest selling out all the seats in the stadium. Sellouts are much less frequent in baseball and basketball than in football.
Using the Fan Cost Index, which includes prices of concessions and other ancillaries like parking, the analysis also provides some insight into the profit-maximizing behavior of the franchises. For example, based on a simple model of revenue maximization presented below, we show that the difference in the ticket price elasticity and the Fan Cost Index elasticity is consistent with concession price being set at the concession-revenue maximizing level. The finding that attendance is in the inelastic portion of the demand is, according to the theory, consistent with concession demand falling as ticket prices rise. This also supports the implication that franchises set ticket prices to maximize concessions’ revenues.
THE ATTENDANCE DEMAND LITERATURE
….
A general finding in these studies is that attendance demand is price inelastic. Fort (2004) shows that this is not inconsistent with the idea that professional sports franchises are monopolies, so long as the franchises have other sources of revenue….
Finally, some recent literature examines the relationship between concessions and attendance at professional sports. Krautmann and Berri (2007) develop a model of ticket pricing, concession pricing, broadcasting revenue, and revenue sharing in a professional sports league. They use this model to motivate an unconditional analysis of ticket and concession prices that supports the idea that revenue maximizing teams price tickets in the inelastic portion of the demand curve in order to maximize total revenues by increasing revenues from other sources like concessions.
….
A MODEL OF MONOPOLY PRICE DETERMINATION
Consider a monopoly sports franchise that is able to set prices for tickets and ancillary goods and services like concessions and parking. Suppose that costs to the franchise are independent of attendance and sales of these ancillaries. In these circumstances the objective of the franchises is to set ticket and concession prices to maximize revenues, given the constraint that attendance is limited by the seating capacity of the stadium or arena. Subject to these circumstances, this section derives implications for the attendance demand equation.
….
Above, we suggested that the cross-price elasticities between concession prices and ticket demand would likely be negative, indicating that concessions and tickets are gross complements. If tickets and concessions are, in fact, complements, then the model predicts that a revenue maximizing franchise with monopoly power will set both ticket and concession prices in the inelastic portion of the respective demand curves…. Additionally, note that the stronger the degree of complementarity between concessions and tickets, the lower the own-price elasticity of demand for tickets…. In other words, if high ticket prices have a strong negative effect on concessions purchases, a revenue maximizing franchise will price tickets in the inelastic portion of the demand curve—and forego some revenue from ticket sales—but make up for it in increased revenues from concession sales.
… In other words, the model predicts that franchises set concessions prices at their revenue maximizing levels—in the elastic portion of the demand curve—when facilities have excess capacity.
….
Consider the situation when the capacity constraint is binding with no excess demand for tickets. In this case, in order to raise revenues by selling an additional ticket, and assuming capacity expands, the ticket price must be reduced. This is because we have assumed that at the existing price, the tickets demanded exactly equal the stadium capacity; if there were an additional seat, it would not sell at the current price…..
… However, with the stadium sold out, a stronger relationship between concession prices and ticket demand may still be nearly consistent with revenue maximizing prices of concessions…. In other words, concession prices may be set near to the revenue maximizing level despite the dampening effect of those prices on ticket demand.
The model of price determination by a monopoly sports franchise developed in this section contains a number of empirically testable predictions about the own- and cross-price elasticities of ticket demand. First, if the attendance demand is inelastic with respect to ticket prices, then an increase in ticket prices reduces demand for concessions. Second, concession prices that do not affect ticket demand imply concession prices are set at revenue maximizing levels. Third, clubs whose attendance is constrained by stadium capacity or that have waiting lists for tickets may be able to approximate the concessions’ revenue maximizing prices even if increased concession prices reduce attendance.
[Ed. Note: Authors’ discussion of the empirical approach is omitted.]
….
DATA DESCRIPTION
….
The mean values are what one would expect for these three sports. Average attendance is largest at NFL games, and smallest at NBA games. The FCI is highest for NFL games and lowest for MLB games. More NBA teams make the playoffs than do NFL or MLB teams. NFL franchises are located in smaller cities, on average, while NBA and MLB franchises are located in larger cities. The stadium and franchise age variable means are also as expected. MLB teams are older and play in older stadiums. NBA teams play in newer facilities. MLB teams play in cities with higher income per capita. NFL teams, because of the greater revenue sharing and revenues from national television broadcasting contracts in that league, play in smaller cities and in cities with lower income per capita.
EMPIRICAL RESULTS
….
The ticket price variable is significant for both the NBA and MLB; the Fan Cost Index variable is significant in the NBA and nearly significant in MLB. The signs on these variables are negative, as expected, indicating that higher prices are associated with lower attendance, all else equal…. the evidence suggests that teams set prices in the inelastic portion of the demand curves in the NBA and MLB.
In both baseball and basketball, the ticket price elasticity is smaller than the Fan Cost Index price elasticity. The Fan Cost Index contains ticket, concession, and other related good prices. Because the FCI elasticity is higher than the ticket price elasticity, the elasticity of the nonticket components of the FCI may be larger than the ticket price elasticity. This result is consistent with the prediction that emerges from the model developed above, when attendance is less than capacity. It implies that revenue maximizing teams price concessions and other goods closer to the revenue maximizing elastic portion of the demand curve and trade off these revenues by pricing tickets in the inelastic portion of the demand curve. This result is consistent with the unconditional results reported by Krautmann and Berri (2007).
The team’s winning percentage and the previous year’s attendance in the metropolitan area in which the team plays are both significant at the 5% level and correctly signed in all model specifications. The population of the metropolitan area is significant and positive for MLB and NBA teams, but not for the NFL. All specifications explain between 70% and 80% of the observed variation in attendance in the sample. In the NBA, aging arenas reduce attendance, perhaps explaining why NBA teams replace their facilities so frequently. Each 10% increase in the age of a basketball arena reduces attendance by about 0.5%, based on these estimates.
The results for the National Football League are quite different from those for MLB and the NBA. The price and Fan Cost Index variables are not significant, suggesting that attendance at NFL games is not very sensitive to changes in the FCI or the ticket price. Of the other explanatory variables, only the lagged attendance and current winning percentage variables are significant in the NFL models. Average attendance at NFL games is typically much closer to the capacity of the facility than in MLB or the NBA. Many NFL teams have average attendance near stadium capacity in every season. This result is also consistent with the predictions of the revenue maximization model developed above, when the capacity constraint is binding.
….
If one splits the Fan Cost Index into its components, it is possible to estimate the attendance demand equations including the prices of other goods…. We estimated attendance equations for each league using the ticket price as well as the prices of hot dogs, beers, sodas, programs, and parking….
The weakness of these results makes drawing inferences from them suspect. Nonetheless, the lack of significance of concessions prices in the attendance demand equation strikes us as intuitively plausible. More interesting is the lack of significance these prices have in determining attendance, which is consistent with the implications … that hold concession prices are set to maximize concessions’ revenue.
DISCUSSION AND CONCLUSIONS
The evidence here suggests that demand for attendance at professional sporting events is quite inelastic with respect to the ticket price. This evidence appears to be at odds with the common idea that professional sports franchises are monopolists whose pricing behavior should be to set prices in the elastic portion of the demand. Following Fort (2004), who built on earlier analysis, we devise a simple model of a multiproduct sports franchise and derive implications for the pricing of each of the products of the team. The precise predictions depend upon whether the team sells out its entire stadium or whether there is excess capacity. In the latter case, the profit maximization conditions imply that when concessions prices do not affect ticket demand, concession prices are set to maximize concessions’ revenue. We find weak evidence that this is the case.
The results also indicate that demand for professional football differs fundamentally from that of basketball and baseball. Football far more frequently sells out its games, and the theory section shows that the comparative static effects of sell outs are more complicated than those of non-sell outs. Moreover, the football equations are not well-estimated in that they reject the validity of the instruments and few coefficients are significantly different from 0. Indeed, the price variable frequently has the wrong sign for the NFL, although the estimated parameters are not different from 0. Because the capacity constraint may be binding for the NFL, while it clearly does not bind for MLB and the NBA, the pattern of estimated parameters for the NFL may reflect this constraint.
The results in this paper support the idea that ticket price elasticities in the inelastic portion of the demand curve reported in the literature are due to the inter-related pricing decision on tickets, concessions, and other related goods made by revenue maximizing monopolists in the NBA and MLB…. We also find that the determinants of demand for NFL tickets differ significantly from the determinants of NBA and MLB tickets.
….
References
….
Fort, R. (2004). Inelastic sports pricing. Managerial and Decision Economics 25, 87–94.
….
Krautmann, A. C., & Berri, S. B. (2007). Can we find it at the concessions? Understanding price elasticity in professional sports. Journal of Sports Economics, 8(2), 183–191.
Noll, R. G. (1974). Attendance and price setting, in government and the sports business. Washington, DC: The Brookings Institution.
Noll, R. G. (1974). Government and the sports business. Washington, DC:
The Brookings Institution.
….
VARIABLE TICKET PRICING IN MAJOR LEAGUE BASEBALL
Daniel A. Rascher, Chad D. McEvoy, Mark S. Nagel, and Matthew T. Brown
Variable ticket pricing (VTP) has recently been a much-discussed topic in the business of sport, especially as it relates to professional baseball, professional hockey, and college football (King, 2003; Rovell, 2002a). VTP refers to changing the price of a sporting-event ticket based on the expected demand for that event. For example, Major League Baseball’s (MLB) Colorado Rockies had four different price levels for the same seat throughout the season (Cameron, 2002). The different price levels were based primarily on the time of the year (summer versus spring or fall), day of the week (weekends versus weekdays), holidays (Memorial Day, Independence Day, etc.), the quality of the Rockies’ opponent, or their opponents’ star players (e.g., Barry Bonds). The same seat in the outfield pavilion section of Coors Field, the Rockies’ home stadium, ranged in price in 2004 from a high of $21 for what the Rockies labeled as “marquee” games to a low of $11 for what were considered “value” games. MLB teams who used VTP in 2004 are detailed in Table 13. Other sport organizations besides MLB franchises use VTP, as well. Several National Hockey League (NHL) teams use VTP strategies, as do a number of intercollegiate athletics programs (Rooney, 2003; Rovell, 2002a).
Some MLB teams have concluded that their 81 home games are not 81 units of the same product, but rather, based on the aforementioned characteristics such as the day of the week and quality of the opponent, are 81 unique products. As such, the 81 unique products should each be priced according to their own characteristics that make them more or less attractive to the potential consumer. MLB attendance studies support this notion. For example, in a study including more than 50 independent variables in explaining MLB game attendance, McDonald and Rascher (2000) found variables such as day of the week, home and visiting teams’ winning percentages, and weather, among many others, to be statistically significant predictors of game attendance. Clearly, a variety of factors make some games more appealing and others less appealing to consumers. It seems quite logical to price tickets to these games at different levels, especially with teams constantly searching for revenue sources to compete with their opponents for players (Howard & Crompton, 2004; Zimbalist, 2003).
Table 13 MLB Variable Ticket Pricing Programs
| Team | Number of Levels | Levels (price for typical outfield bleacher seats) |
Arizona Diamondbacks | 3 | premier ($18), weekend ($15), weekday ($13) |
Atlanta Braves | 2 | premium ($21), regular ($18) |
Chicago Cubs | 3 | prime ($35), regular ($26), value ($15) |
Chicago White Sox | 2 | weekend ($26), weekday ($22) |
Colorado Rockies | 4 | marquee ($21), classic ($19), premium ($17), value ($11) |
New York Mets | 4 | gold ($16), silver ($14), bronze ($12), value ($5) |
San Francisco Giants | 2 | Friday–Sunday ($21), Monday–Thursday ($16) |
Tampa Bay Devil Rays | 3 | prime ($20), regular ($17), value ($10) |
Toronto Blue Jays | 3 | premium ($26), regular ($23), value ($15) |
Source: Journal of Sport Management. Used with permission.
Note: Different seating configurations of each stadium make comparing like seats difficult; however, this attempt was made to provide the reader with an idea of the range of price levels used by each team for similar seats.
The varying quality of games throughout a season often creates a secondary market because demand for the most popular games might exceed available supply. Independent ticket agents, or scalpers, broker tickets obtained from various sources to fans unable or unwilling to purchase tickets from a team’s ticket office or licensed ticket agency (Caple 2001; Reese, 2004). Ticket scalpers respond to market demands (often in violation of city ordinances or state laws), but the team initially selling the ticket does not realize any increased revenue during a scalper’s transaction (“History of Ticket Scalping,” n.d.). For this reason, the Chicago Cubs have recently permitted ticket holders to auction their Wrigley Field tickets on a Cubs affiliated Web site, with a fee being paid to the Cubs for this service (Rovell, 2002b; see also www.buycubstickets.com). It is believed that instituting a comprehensive VTP policy would diminish the influence of scalpers and permit greater revenue to be generated by the team for games in high demand.
Many industries have previously embraced the variable pricing concept as a method for increasing revenue and providing more efficient service to consumers (Bruel, 2003; Rovell, 2002a). Airline flights are typically more expensive for selected days of the week (Monday, Friday), times of the day (morning, late afternoon), and days of the year (holidays) when travel demand is higher. The airlines also use variable pricing to encourage passengers to book their flights early (typically a purchase at least 10–14 days in advance results in a lower fare) or, in some cases, at the last minute (“Travel Tips,” 2004). Hotel pricing characteristically reflects expected demand, even though the actual physical product does not change, because rooms for weekends or holidays are usually priced higher than for weekdays or off-season visits. In fact, sometimes variable pricing even relates to major sporting events like the Super Bowl. Many hotels substantially raise room rates during Super Bowl week (Baade & Matheson, n.d.). Other industries such as transportation use variable pricing; some toll roads now charge higher toll rates during peak times and lower rates during off-peak times (“Group Commends,” 2001). The arts use variable pricing; matinee movie pricing is one example (Riley, 2002).
Sports franchises are moving forward with VTP strategies before sufficient research has been done to empirically evaluate its specific merits to the industry. This article provides a straightforward assessment of optimal VTP. First, a review of the literature reveals difficulties in estimating the nature of demand functions in sports. Specifically, optimal pricing is partially determined by price elasticities of demand, yet it is difficult to estimate ticket-price elasticities that are consistent over time. Next, a theory of complementary demand is explained that will account for nonticket products and services and the effect that ticket prices have on the demand for these products and services. Then, using individual game data from the 1996 MLB season, ticket prices and corresponding quantities are estimated that would have maximized ticket revenue. These are compared with actual prices and revenue to determine the yield from initiating a VTP policy. The final section contains a discussion of the implications of the results. In summary, this article shows that there are financial benefits to be gained from implementing VTP, details how much can be gained from a general VTP policy, and provides strategies for implementing VTP.
….
TICKET PRICING ISSUES
It has been difficult for researchers to show profit-maximizing ticket pricing by sports teams. There are a number of reasons for this besides the inclusion of other revenue streams. First, most pricing data is a simple average of prices that are available for various seats for each team each season. Currently, Team Marketing Report (TMR) collects pricing data that some researchers have used (e.g., Rishe & Mondello, 2004; Rascher, 1999). Although it is likely an improvement over previously collected pricing data, it has lacked consistency across teams and over time. Numerous discussions by the authors and TMR have revealed that TMR is able to separate out the luxury-suite ticket prices. TMR has also separated out club-seating prices for some, but not all, teams. Furthermore, this varies across seasons. TMR relies on the teams to self-report. Because of the prominence of the TMR Fan Cost Index, some teams potentially manipulate their reported prices to appear relatively inexpensive. Moreover, the number of seats available at each price level does not typically weight these prices. In addition, the number of seats sold is generally known in aggregate, not separated by seat price. Second, Demmert (1973) noted that there is a correlation between population and ticket price across many seasons (likely based on the connection to income in which more highly populated areas are associated with higher incomes, increasing demand and, therefore, prices). This multicollinearity can cloud the interpretation of coefficients on price. Third, as Salant (1992) pointed out, the long-term price of tickets might be optimal (adjusting for risk), but in the short term a team might be over- or underpricing in order to maintain consistency. This is a form of insurance in which the team bears the risk. Fourth, similar to Fort’s (2004) findings, ticket prices might be kept relatively low in order to increase the number of attendees at an event who are likely to spend more money on parking, concessions, and merchandise and who will drive up sponsorship revenue for the team, thus maximizing overall revenues, rather than simply ticket revenues.
DeSerpa (1994) discussed the rationality of apparently low season-ticket prices. Even though many games sell out in the National Basketball Association and National Football League (focal sports in his study), it is rational for the seller to price below the myopic short-term demand price in order to give a fan a reason to purchase season tickets. In fact, DeSerpa discussed the possibility, but unlikeliness, of charging different prices for each event based on its demand. He surmised that it was administratively expensive and subject to potential negative fan reaction.
DeSerpa (1994) also noted that it is optimal to under-price season tickets if fans will likely want to attend only some of the games and resell the tickets for the remaining contests. The season ticket must be priced low enough for holders to be able to at least recoup their initial investment after assuming the transaction costs of resale (e.g., time, effort, search costs, and actual costs such as postage and advertising). Lower priced season tickets also potentially created a home-field advantage for teams. Each argument or concern DeSerpa proffered can be addressed in a VTP system.
….
THEORETICAL FOUNDATIONS
The demand for baseball games changes from game to game, partly because of the varying quality and perception of quality of the home and visiting teams and partly because of nonperformance factors such as day of the week or month. For a given price, Table 14 (columns 2 and 3) shows that attendance varies greatly across games. The average deviation from the mean is nearly 23%….
In general, many organizations are trying to minimize the effect of team performance, which is one of the key factors in the changing demand from game to game (Brockinton, 2003; George, 2003). As shown in the literature, team performance is one of the most significant demand factors that can be affected by an owner. For example, Bruggink and Eaton (1996) and Rascher (1999) analyzed game-by-game attendance and the importance of team performance. Using annual data, Alexander (2001) showed that the variable with the highest statistical significance is the number of games behind the leader, a measure of team performance. Teams are building new stadiums, improving concessions and restaurants, and creating areas where kids and adults can enjoy themselves but not necessarily watch the game (George, 2003). These improvements not only increase demand but also lessen the importance that team performance uncertainty has on expected revenues.
Table 14 Summary of Effects of Variable Ticket Pricing (No Capacity or Nonticket-Revenue Adjustment)
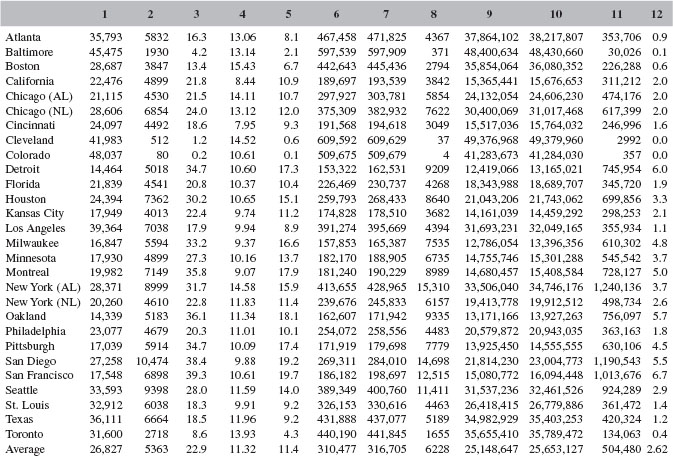
Source: Journal of Sport Management. Used with permission.
Note: The total change in ticket revenue accounting for variable ticket pricing across Major League Baseball is $14.1 million. 1 = average attendance; 2 = average absolute change; 3 = average deviation from the mean (%); 4 = average ticket price ($); 5 = average absolute change in price (%); 6 = average actual ticket revenue ($); 7 = average variation-pricing ticket revenue ($); 8 = average change in ticket revenue ($); 9 = total actual ticket revenue ($); 10 = total variation-pricing ticket revenue ($); 11 = total change in ticket revenue ($); 12 = change in revenue (%).
At the same time, teams are beginning to use variable pricing in an attempt to manage shifting demand from game to game, given that they are unable to completely remove the variation. The theory on which this analysis is based is simply short-term revenue maximization with two goods that are complementary. Tickets and concessions are complementary goods. The demand for tickets is higher if concessions prices are lower because the overall cost of enjoying the game would be lower (Marburger, 1997; Fort, 2004). Similarly, the demand for concessions is higher if ticket prices are lower. The model consists of demand for tickets and a separate aggregate demand for nonticket products and services (hereafter referred to as concessions) that is affected by ticket price. This is where the complementarity between the two demand functions occurs.
….
To be clear, these models do not assume profit maximization, win maximization, or something else; they only assume that a team’s objectives are consistent throughout the season. For example, if a team is focused primarily on profits, it will set ticket and concessions prices in order to maximize the sum of both revenues. In a similar way, if a team is attempting to maximize wins, it will still want to price as a profit maximizer because its relevant costs are not variable. Such a team would likely spend more on players in order to improve winning than a profit-maximizing team would. The team would still want to set prices in order to maximize revenues from tickets and concessions, however, just as a profit-maximizing team would. An exception to this argument is if a win-maximizing owner chose to price below profit-maximizing levels in order to raise attendance (even though it is lowering revenues) to increase the impact of home-field advantage, which would increase the likelihood of winning more games and, therefore, satisfy his or her objectives.
The models also do not need to assume linear demand functions. Linear demand is chosen for simplicity. As described in the next section, nonlinear demand changes the magnitudes of the findings. Using linear demand generates more conservative findings—the gains from variable pricing are lower. The empirical analysis operationalizes this by noting that regardless of an owner’s objectives (winning, profits, or a combination of the two), it is assumed that prices are set to maximize those objectives. For a particular game it might be that prices are too low or too high given demand, but because one price is charged for the entire season, it is objective maximizing on average.
One hypothesis stemming from these models is that adoption of VTP would improve revenues for MLB teams. Another hypothesis is that for those teams who are adjusting prices, the amount of adjustment is correct. For instance, the Cardinals had only raised their prices for VTP games by $2 for 2002. In contrast, the Rockies have had prices for particular seats that varied by as much as $6 (Rovell, 2002b). This analysis will provide a benchmark for how much teams should be adjusting their prices.
It is important to note that there are public relations issues that play a role in VTP. For example, the Nashville Predators have been thinking about incorporating VTP but fear a negative fan backlash at a time when they are trying to build a loyal fan base (Cameron, 2002). A team might therefore opt to raise its prices only nominally to see if there is a backlash in which fans react with an emotional response that actually shifts demand (not slides along demand, as price changes are expected to do). This analysis ignores any public relations issues.
[Ed. Note: Authors’ discussion of method is omitted.]
….
RESULTS
….
Variable pricing would have yielded an average of approximately $504,000 per year in additional revenue for each MLB team, ceteris paribus, or over $14 million for the league as a whole. This amounts to only about a 2.6% increase above what occurs when prices are not varied, as shown in Table 14. The amount of variation in ticket prices is just over 11% on average. The fact that such a large price swing only yields a revenue swing four times smaller is simply based on the large change in attendance that occurs when prices are varied. This occurs with all downward sloping demand curves and is not unique to baseball. For the 1996 season, the largest revenue gain would have been for the New York Yankees, which would have generated an extra $1.24 million in ticket revenue, or a 3.7% increase. The largest percentage revenue gain would have been for the San Francisco Giants. The Giants would have seen an estimated 6.7% increase in revenue, or $1.01 million, if they had used optimal VTP. The smallest amount of impact would have been for the Colorado Rockies, which averaged only plus or minus 80 patrons in absolute deviation from the mean attendance per game throughout the 1996 season. In fact, teams with the lowest average attendance benefit the most from variable pricing. This is not surprising because those teams tend to have the highest variation in attendance, allowing them to gain from dynamic pricing.
The Rockies would gain the least from VTP because they had many sellouts in 1996. As described in the Method section, a censored regression is carried out in order to forecast the true demand above the capacity constraint. Although there are many more factors that affect game-by-game attendance than those used here, this analysis used only those factors known before ticket-price setting occurred. Thus, only factors known before the beginning of the season are used in order to be consistent with what would be known by team management when setting prices…. As explained, performance-specific factors that are only known to price setters once the season has begun, such as the home pitcher’s earned-run average at that point in the season, were omitted….
Overall, adjusting for demand beyond stadium capacity raises the increased revenue from VTP policies from $14.1 million to $16.5 million for the league as a whole.
The final analysis addressed … accounting for non-ticket revenues such as concessions, merchandise, and parking…. the average team would have gained $911,000 in ticket and nonticket revenue by adopting a VTP policy while accounting for nonticket prices. The league overall would have gained $25.5 million. The Cleveland Indians would have earned the most, over $2.2 million, from such a policy.
DISCUSSION
This analysis has shown that MLB could have increased ticket revenues by approximately 2.8%, or $16.5 million, and total stadium revenues by about $25.5 million for the 1996 season if teams used VTP. Total revenues in MLB are estimated to have grown from $1.78 billion in 1996 to approximately $4.3 billion in 2003, or 250%. Similar changes in the effect of VTP strategies, as discovered in this study, would yield nearly $40 million in ticket revenue and over $60 million in ticket plus nonticket revenue for MLB. Therefore, it behooves team owners and the league office to consider and implement VTP strategies, especially because teams and the league are constantly searching for ways to increase revenues.
The San Francisco Giants would have seen an estimated 6.7% increase in ticket revenue, or $1.01 million, if they had used optimal VTP in 1996. It is interesting that the Giants had considered using VTP since the 1996 season because they had noticed a huge variation in attendance patterns at Candlestick Park, the team’s then-home facility (King, 2002a). In addition to weather issues (pleasant for day games but frigid for night) in their facility, the Giants of the mid-1990s occasionally fielded teams of lower quality. The results of this study would strongly suggest that teams in similar facility or on-the-field talent situations maximize their revenues through VTP.
The results of this study support the use of VTP both to increase and decrease prices from average seasonal levels. The data showed fewer games with excess demand than those with diminished demand. The selected games with excess demand deviated, however, from the mean at a greater rate than those with decreased demand. Currently, most MLB teams have focused their VTP strategies on the revenue potential of increased prices from highly demanded games (King, 2002a). It appears that some teams, however, have begun to realize the potential benefit of attracting fans to less desirable contests by lowering prices (King, 2002b). The New York Yankees sold $5 tickets in certain sections of Yankee Stadium on Mondays, Tuesdays, and Thursdays in 2003 (King, 2003).
Lowering ticket prices for less desirable games would potentially create more positive relationships between teams and local municipalities. MLB teams have often been chastised for seeking subsidies for new revenue generating facilities that are financially inaccessible to many taxpayers (Pappas, 2002; O’Keefe, 2004). Given the number of games in a typical season for which demand is below the yearly average …, lowering prices creates an opportunity for teams to potentially attract new or disenfranchised fans and presents local governments with a more favorable reaction to their public-policy decisions supporting the local franchise. Marketing less desirable games with lower ticket prices as “value” games, as the Chicago Cubs, Colorado Rockies, New York Mets, Tampa Bay Devil Rays, and Toronto Blue Jays did in 2004, allows teams to reach market segments perhaps otherwise unreachable because of pricing/income issues, in addition to the aforementioned public relations benefits.
Currently, teams might not want to implement multiple price points for each game…. As discussed by Levy, Dutta, Bergen, and Venable (1997), menu costs affect the frequency and desire to change prices to reflect changes in demand or supply. Menu costs are costs associated with physically changing prices on products, having to look up prices to tell a customer the price for a particular game, or, more generally, any costs associated with having more than one price for a product or service. In addition, asymmetric information, search costs, and simple confusion for customers regarding the price for different games might cause franchises to have fewer prices for a particular seat throughout the season than variable pricing predicts. For this reason, many teams have only used a minimal number of ticket-pricing tiers, usually two to four, in their VTP system (Rovell, 2002b).
Confusion and the additional costs associated with changing ticket prices might already be in the process of being eliminated. Kevin Fenton, Colorado Rockies senior director of ticket operations, noted that once the initial confusion regarding multiple price points for games is overcome, patrons realize that tickets can be priced like other industries (Rovell, 2002b). In the near future, the negative fan reaction to changing ticket price will likely be alleviated if not eliminated (Adams, 2003). Ticket offices are also now better equipped to handle menu costs issues. Although ticket offices were not prepared to handle extensive VTP in the 1990s, recent technological advances have allowed most American professional sport teams to implement new ticket policies such as bar-coded and print-at-home tickets to prepare for extensive VTP in the future (Zoltak, 2002).
An initial VTP recommendation is that for every 10% increase in attendance (or specifically, expected attendance) above the average, teams should raise ticket prices by 5% and receive a gain of 1.2% in ticket revenue. The practical use of variable pricing, however, would entail creating, at most, five different prices for each seat in a stadium throughout the season, not a different price for each game. High-demand games or series should be priced accordingly, but teams should not forget the potential benefits of lowering prices for less desired games. The present findings reinforce previous research identifying factors such as day of the week or a rivalry game as affecting demand for MLB tickets.
….
The hypothesis that the few teams administering VTP are doing so properly is consistent with the findings. In fact, the present analysis shows that optimal VTP is managed by small changes in ticket prices. The Giants expected to gain an additional $1 million from VTP in 2002 (Isidore, 2002; Rovell, 2002b). The Giants VTP strategy in 2002 affected only 39 of their 81 home games (all weekend dates). The present analysis shows a gain of about $1 million for the 1996 season if optimal pricing were used by the Giants.
….
References
Adams, R. (2003, January 6). Variable price ticket policy wins converts. Sports Business Journal, p. 14.
Alexander, D.L. (2001). Major League Baseball: Monopoly pricing and profit-maximizing behavior. Journal of Sports Economics, 2, 341–355.
Baade, R., & Matheson, V. (n.d.). Super Bowl or super (hyper)bole? The economic impact of the Super Bowl on host communities. Unpublished manuscript.
….
Brockinton, L. (2003, May 26). New NFL digs offer more revenue possibilities. Sports Business Journal, p. 25.
Bruel, J.S. (2003, January 27). Finding hidden revenue under the seat cushions. Sports Business Journal, p. 23.
Bruggink, T.H., & Eaton, J.W. (1996). Rebuilding attendance in Major League Baseball: The demand for individual games. In J. Fizel, E. Gustafson, & L. Hadley (Eds.), Baseball economics: Current research (pp. 9–31). Westport, CT: Praeger.
Cameron, S. (2002, May 27). Bruins to set prices hourly. Sports Business Journal, pp. 1, 50.
Caple, J. (2001, August 21). All hail ticket scalpers! ESPN Page 2. Retrieved April 16, 2003, from http://espn.go.com/page2/s/caple/010821.html
….
Demmert, H.G. (1973). The economics of professional team sports. Lexington, MA: Lexington Books.
DeSerpa, A.C. (1994). To err is rational: A theory of excess demand for tickets. Managerial and Decision Economics, 15, 511–518.
Fort, R.D. (2004). Inelastic sports pricing. Managerial and Decision Economics, 25, 87–94.
George, J. (2003, May 26). Phillies go big with entertaining Ashburn Alley. Sports Business Journal, p. 24.
Group commends port authority for variably priced tolls. (2001). Retrieved July 19, 2004, from http://www.tstc.org/press/322_PAtolls.html
….
History of ticket scalping. (n.d.). Retrieved July 16, 2004, from http://metg.fateback.com/metghistory.html
Howard, D.R., & Crompton, J.L. (2004). Financing sport (2nd ed.). Morgantown, WV: Fitness Information Technologies.
Isidore, C. (2002, December 27). Fans to pay the price(s). CNN/Money. Retrieved July 23, 2004, from http://money.cnn.com/2002/12/27/commentary/column_sportsbiz/ticket_prices/
King, B. (2002a, April 1). Baseball tries variable pricing. Sports Business Journal, pp. 1, 49.
King, B. (2002b, December 9). MLB varied ticket pricing a boon. Sports Business Journal, p. 23.
King, B. (2003, December 1). More teams catch on to variable ticket pricing. Sports Business Journal, p. 16.
Levy, D., Dutta, S., Bergen, M., & Venable, R. (1997). The magnitude of menu costs: Direct evidence from large U.S. supermarket chains. Quarterly Journal of Economics, 112, 791–825.
Marburger, D.R. (1997). Optimal ticket pricing for performance goods. Managerial and Decision Economics, 18, 375–381.
McDonald, M., & Rascher, D.A. (2000). Does bat day make sense?: The effect of promotions on the demand for Major League Baseball. Journal of Sport Management, 14, 8–27.
….
O’Keefe, B. (2004, March 29). Pro baseball franchise hit with unusual state audit. Stateline.org. Retrieved July 24, 2004, from www.stateline.org/stateline/?pa=story&sa=showStoryInfo&print=1&id=360450
Pappas, D. (2002). The numbers (part three; part five). Baseball prospectus. Retrieved June 20, 2004, from www.baseballprospectus.com/article.php?articleid=1305
Rascher, D.A. (1999). The optimal distribution of talent in Major League Baseball. In L. Hadley, E. Gustafson, & J. Fizel (Eds.), Sports economics: Current research (pp. 27–45). Westport, CT: Praeger.
Reese, J.T. (2004). Ticket operations. In U. McMahon-Beattie & I. Yeoman (Eds.), Sport and leisure operations management (pp. 167–179). London: Continuum.
Riley, D.F. (2002). Ticket pricing: Concepts, methods, practices, and guidelines for performing arts events. Culture Work, 2(6). Retrieved July 19, 2004, from http://aad.uoregon.edu/culturework/culturework20.html
Rishe, P., & Mondello, M. (2004). Ticket price determination in professional sports: An empirical analysis of the NBA, NFL, NHL, and Major League Baseball. Sport Marketing Quarterly, 13, 104–112.
Rooney, T. (2003, January). The pros and cons of variable ticket pricing. Paper presented at the 2003 National Sports Forum, Pittsburgh, PA.
Rovell, D. (2002a, December 31). Forecasting the sport business future. ESPN.com. Retrieved July 12, 2004, from http://espn.go.com/sportsbusiness/s/2002/1230/1484284.html
Rovell, D. (2002b, June 21). Sports fans feel pinch in seat (prices). ESPN. com. Retrieved July 20, 2004, from http://espn.go.com/sportsbusiness/s/2002/0621/1397693.html
Salant, D. (1992). Price setting in professional team sports. In P. Sommers (Ed.), Diamonds are forever (pp. 77–90). Washington, DC: The Brookings Institution.
….
Travel tips. (2004). Retrieved July 20, 2004, from http://clarkhoward.com/travel/tips/todays_tip.html
Whitney, J.D. (1988). Winning games versus winning championships: The economics of fan interest and team performance. Economic Inquiry, 26, 703–724.
Zimbalist, A. (2003). May the best team win: Baseball economics and public policy. Washington DC: The Brookings Institution.
Zoltak, J. (2002, July). Tickets and technology: Perfect together. Venues Today, pp. 1, 20.
MICROPERSPECTIVES
GLOBALISATION AND SPORTS BRANDING: THE CASE OF MANCHESTER UNITED
John S. Hill and John Vincent
INTRODUCTION
May 2005 will go down as a watershed moment in the storied history of Manchester United, when US businessman Malcolm Glazer bought financial control of the fabled English football club. While it is not the intention of this article to argue the pros and cons of this move, it is noteworthy that Glazer’s move was premised on Manchester United’s position as one of the most prominent global brands in a sport that has proven worldwide appeal.
In this article we examine how Manchester United evolved out of its position as one of two provincial football teams in the city of Manchester to its current status among the best known brands in sport. Our conceptual centrepiece is Aaker’s (1996) brand identity model that culls the major resource factors that contribute to strong marketplace brands. Complementing this model, to add depth and a more complete analysis, we evaluate two structural factors relevant to corporate strategy-making—global and industry environments. This follows Gerrard’s (2003) assertion that strategic analyses in the sports arena should include both structural and resource-based factors for a balanced view.
….
STRUCTURAL FACTORS: GLOBALISATION, GLOBAL SPORTS AND GLOBAL BRANDING
Effective strategies take account of marketplace developments, and as the 21st century got underway, the trend of globalisation was very much apparent in the world economy. Defined by Aninat (2002, p.4) as “the process through which an increasingly free flow of ideas, peoples, goods and services and capital leads to the integration of economies and societies”, globalisation has resulted in nation states forging links through trade, investments and the activities of international companies participating in the world economy…. The end of the Cold War in the late 1980s and early 1990s decreased world political tensions, and the meteoric rise of the internet and of global communications caused an unprecedented acceleration in commercial activities outside domestic markets, increasing the variety of goods and services available in the world marketplace (Hill & Holloway, 2001). The integration of world economies has led to increasing competition in many industries (Porter, 1986). In the field of sport, globalisation has added impetus to international rivalries that date in the modern era from the 1896 Olympic Games. Since that time, many sports have benefited as their international media exposure has increased from quadrennial appearances in the Olympics. Sports such as tennis and golf have been global for decades; as have the British and colonies-based sports of cricket, rugby, squash and badminton. Equestrian, motorsport, table tennis (ping-pong), boxing, hockey, ice hockey and lacrosse have all benefited from international exposure. US sports such as basketball, American football and baseball have established footholds in foreign markets as global media has broadened their appeal beyond domestic markets. But no single sport has benefited from its global exposures as much as soccer (Giulianotti, 2002). Since its first appearance in the 1908 Olympics, the sport has attracted increasing international attention. The first World Cup was organised in 1930 by Jules Rimet in Uruguay. Since then, soccer has consistently drawn more support worldwide than any other pastime. As globalisation trends accelerated after the 1980s, increasing numbers of professional soccer clubs sought to capitalise on the sport’s global appeal, but only two clubs, Manchester United and Real Madrid, emerged as global brands. Although Real Madrid has a very high global awareness and recently overtook Manchester United as the club with the highest turnover, many observers consider that Manchester United’s innovative branding and marketing strategies were at the leading edge of the contemporary trend in sport globalisation….
The club’s pre-eminent position was noted in its 2003 annual report (p. iii): “Manchester United is one of the leading clubs in world football, with a global brand and following that embodies the passion and excitement of the world’s most popular sport.” The report reaffirmed the need to convert more of its 75 million global fans into paying customers. In implementing its international strategy, Manchester United has been the pathfinder for many other sports and clubs seeking to establish global identities in the international marketplace.
STRUCTURAL FACTORS: INDUSTRY ENVIRONMENT
The forming of the English Premier League (EPL—also known as The Premiership) in 1992–93 signaled an era of heightened competitiveness. We analysed additional pressures o n soccer using frameworks developed by Porter (1980) and Lonsdale (2004).
Upstream Pressures—Player Scarcity Effects
The forming of the EPL in 1992 added pressures to clubs as they competed among a limited supply of talented players. This competition for players intensified further following the Bosman Ruling, instituted in 1995 by the European Court of Justice that decreed that professional soccer players could become free agents following expiry of their contracts. The ruling also removed the ‘maximum of three foreigners rule’ observed in British soccer clubs. Together, these changes gave European-born players the right to move freely to any club within the European Union (Boyle & Haynes, 2000). As competition for talent escalated, club costs rocketed under the impetus of player salary increases, while attendance receipts and existing television deals were levelling out (Crispin, 2004a). Both the Football Association and individual clubs looked for additional revenue streams to bolster finances and attract star players in inflation-affected transfer markets. These were realised in the widening of soccer’s downstream appeal to spectators, sponsors, sports merchandisers and television viewers, both domestic and global.
Downstream Pressures—Broadening Spectator Appeal
Recognising the need for increased gate receipts, in 2004 the English Football League set a goal to increase game attendances from 16 to 21 million by 2010 (Sweney, 2004). This was deemed feasible given a League directive that stadia were to be all-seater, following the 1989 Hillsborough disaster, where 95 people were killed in an FA Cup semi-final between Liverpool and Nottingham Forest, played at Hillsborough, Sheffield (Lonsdale, 2004). Although the mandated trend towards creating all-seater stadia initially reduced stadium capacity for some clubs, many made significant investments to expand their stadia capacity. All seater stadia also became more family-friendly, which broadened the game’s appeal among the middle classes (Miller, 2004).
Manchester United followed this trend. The current Old Trafford stadium is the largest club facility in England, and is being expanded by a further 7900 seats to give it a capacity of nearly 76,000 by the 2006–07 season. [Ed. Note: This expansion has been completed.] Included in the plans are executive suites to accommodate a further 2400 corporate customers. The club’s emphasis on heightening the matchday experience includes the Old Trafford Chef’s Table dining facility, in-stadium and online betting (courtesy of platinum sponsor Ladbrokes), the club museum (and tour), the Red Cafe, a megastore and LED perimeter advertising displays. The stadium also houses the MU Finance Advisory Centre and MUTV studios (Manchester United Annual Report, 2004).
….
Downstream Pressures—Adding Merchandising Deals
Between 10 and 15 years ago, sponsorships and merchandising deals were viewed as minor appendages to club activities (Sport’s Premiers, 2003). Today they are big business….
Downstream Pressures—Competing for TV Viewers
A key event for English soccer occurred as Rupert Murdoch’s media empire sought to enter the UK television market in the late 1980s. Murdoch’s BSkyB satellite channel offered £304 million—five times ITV’s 1988 deal—to broadcast top-tier games. The four-year follow-on contract to 1997 was worth £670 million, and the two follow-on arrangements were both in excess of £1,000 million (Timeline, 2003).
Manchester United supplemented this package when in 1999 it launched its own dedicated television network, MUTV, in conjunction with Granada Media and BSkyB. MUTV had the rights to club games after their airing on the Sky network (Granada, 1999). MUTV also negotiated rights to show archive footage of Manchester United’s UEFA Champions League matches; through its broadband service (MU.tv available through subscription), classic games can be viewed. Under current consideration, and taking advantage of the latest technologies, is the proposal to promote club products and services through MU Interactive, MU Mobile and MU Picture facilities (Manchester United Annual Report, 2004).
Downstream Pressures—Competing for Global Audiences
The BSkyB contract added both benefits and pressures through its international connections as EPL clubs were given global exposure. Murdoch’s ownership of Fox Sports gave the EPL global coverage through its Fox Sports World channel. In the US, Murdoch’s 2004 takeover of DirecTV consolidated this hold in the important North American market, while his agreement with ESPN Star Sports in Asia upped regional audiences of Premiership matches by 150 million households (Crispin, 2004b). Today the EPL reaches an audience of about 1 billion viewers in over 170 countries (Brand Strategy, 2003), giving the league the worldwide marketing platform to reach new fans and to sell its wares to broader consumer bases. These measures—increased ticket, advertising and merchandising revenues—increased turnover for the top 20 English clubs…. They also provided new opportunities for clubs to build their brand profiles and promote themselves to broader audiences; but it was Manchester United that seized the moment to capitalise on its reputation and establish itself as a global brand and sports icon.
BUILDING BRAND IDENTITY
The resource-based view (RBV) of competitive advantage posits that corporate resources—including intangible assets such as brand identities—are key factors in sport (Amis, 2003). A brand identity provides direction, purpose and meaning for the brand—its core values are how it is perceived, what traits it projects and the relationships it engenders (Aaker 1996, p.68). Brand identities comprise the core identity that Aaker defined (p. 85) as “the timeless essence of the brand”—that which makes it unique and valuable. The brand’s extended identity includes those elements that provide “texture and completeness”. In essence, one or more of the extended brand identity characteristics are so dominant that singly, or in concert, they become its core identity. We used Aaker’s brand identity structure concepts to delineate the distinctive features of the Manchester United brand…. Not all components are relevant for individual brands. Our discussion focuses on 10 of the 12 components under four headings: the brand as product, the brand as organisation, the brand as person and the brand as symbol.
….
The Brand as Product
All brands are parts of broader product classes whose characteristics define the parameters within which the brand operates.
Product Scope
Product scope defines the broad industry environment in which the brand operates—in this case, the game of soccer. The global appeal of soccer is based on its history—the fact that many nations and cultures have been playing the sport (or some version of it) for thousands of years.
….
The early organisation of British football established a blueprint that laid the foundation for the sport. The club-based template quickly took root in Europe and through colonisation the organised game spread to Latin America, Africa and Asia.
Product Attributes
In contrast to some sports, soccer has many attractive features that contribute to its current 300-million player following and a fan base that is measured in the billions worldwide (Blatter, 1999). It is action-oriented. It builds stamina and aerobic conditioning. There are few physical size or age limitations. Its rules are relatively simple to understand. It requires minimal equipment (appropriate footwear, shin-guards and uniforms for organised play) and facilities. Soccer is very team-oriented, with many players usually participating in moving the ball up the field. It can be played in many climates; and in contrast to many US sports, on-field strategies are largely player-created.
Quality/Value
For a brand to be successful, it must be part of a product group that is perceived to be quality-laden and that provides value for money. In the automobile industry, for example, Mercedes has this image. In football, Manchester United is part of the EPL, widely touted as the most competitive in the world. The reasons for this reputation are rooted in Porter’s (1990) Competitive Advantage of Nations theory of international competitiveness, which posits that within specific industries, clusters of expertise result from highly competitive national environments. This expertise enables them to become extremely competitive in the global marketplace. The strong rivalries within the British club system, from local leagues all the way up to the Premier League, have resulted in a consistent ratcheting up of performance levels in the modern era.
Over the past decade, on-field performance has been bolstered through a global commitment to excellence—obtaining the best players and managers regardless of national origin…. As a result, to maintain leadership positions, top clubs such as Manchester United must consistently perform to high standards over long periods. This makes them attractive propositions in the international marketplace.
Country of Origin
While the sport of soccer is global, British (and English) football has specific advantages over that of other countries and these have contributed to the global appeal of its clubs. One of these is its history as the home of the modern organised game. International marketers (e.g. Roth & Romeo, 1992) have noted that country-of-origin advantages accrue when countries become associated with specific industries, products or services. French champagne, German engineering and cars (Mercedes, Porsche, BMW), Japanese electronics (Sony, Panasonic) and US computers and software (IBM, Microsoft) have all benefited from being centres of excellence for their specific industry sectors. While the sport of soccer did not originate in Britain, British clubs have benefited from being the birthplace of the modern organised game. Many clubs in the UK have been established for more than 100 years and their solid geographic franchises have resulted in strong local fan bases. Manchester United celebrated its centenary in 2002.
The Brand as Organisation
Brand identities are often associated with the activities of the parent organisation: its people, culture and values; its organisational attributes, such as innovation and quality; and its outlook (local or global).
Organisational Attributes
The Manchester United organisation has garnered a reputation as one of the best organisations in sport and football management, known for:
Traditional Club Values
The arrival of manager Alex Ferguson in 1986 revived the traditional club values established by Matt Busby in the 1950s to 1970. The traditional value of developing the best local talent was continued as the bulk of the side, including Ryan Giggs, Paul Scholes, the Neville brothers and David Beckham, moved up through the club’s youth system. Over the championship-laden 1992-2003 period, Manchester United topped the EPL in starting appearances for home-grown talent (Gerrard, 2004).
The Quest for Soccer Excellence
Increasing competition in the EPL and Ferguson’s perpetual search for the very best talent has resulted in many players being brought in from outside. The current team roster has a number of players bought for substantial sums….
Attacking Soccer
The club’s potent combination of home-grown and imported talent resulted in an attacking style of football that attracts fans worldwide….
Organisational Outlook—Local Versus Global
Manchester United has always been one of the more cosmopolitan teams. In the 1950s it was the first British club to participate in European competition (against the best advice of the English Football League at the time). In 1968, it was the first English club to win the European UEFA club championship (the competition which preceded the Champions League). Scotland’s Celtic had won the trophy the previous season to become the first British winner. As soccer became global during the 1990s, the club toured frequently in Asia and North America, as well as being a frequent competitor in Europe. In recent years, the club has signed players from Latin America, Africa, the US and Asia, as well as Europe.
The Brand as Person
Brands, like people, take on personal attributes that distinguish them from key competitors. These include personality attributes such as:
Youthfulness
Matt Busby started Manchester United’s youth orientation in 1953, when he fielded a side with seven teenagers against Huddersfield (Wagg, 2004). This policy was continued over the years, especially during the 1990s, when many of the club’s star players (Ryan Giggs, Gary and Phillip Neville, Paul Scholes, Nicky Butt and David Beckham) emerged from the youth side to play key roles in the club’s phenomenal success. Seven of the 2004–05 first team squad were products of the club’s highly successful youth academy, and the youth orientation was maintained with the signings of Christiano Ronaldo and Wayne Rooney. The club has augmented its youth talent pipeline through alliances with other European clubs—Bromma, Shelbourne, Nantes, Royal Antwerp and Sporting Lisbon (Manchester United Annual Report, 2004).
Excitement
While the Manchester United tradition of playing stylish, attacking football has brought in many new fans worldwide, its players have also generated excitement off the field. Just as individual brands add sparks to corporate brand lines [e.g. the ‘silver bullet’ effect of the Mazda RX7 on Mazda’s corporate image (Aaker 1996, Barwise & Robertson, 1992)], so player personalities add excitement to club images. In the 1950s it was teenager Duncan Edwards; in the 1960s, George Best, ably supported by Bobby Charlton and Denis Law, generated on- and off-the-field media coverage to maintain Manchester United’s high news profile. In the 1990s, the charismatic Eric Cantona provided headline sports news, until the crop of more recent stars, including media celebrity icon David Beckham, came on stream. Such talents exemplified and magnified the aura of the club.
Competence
Delivering on-field success over long periods is a challenge for any team. In this area, Manchester United has few equals.
In the modern era, …[t]his consistency in excellence has earned Manchester United a coveted place in English and European football annals, matched perhaps only by Spanish club Real Madrid.
Building Customer Relationships
Manchester United has been an active relationship-builder throughout much of the post-1945 era. Today, the club maintains a fan base of nearly 200,000 with its One United Membership Scheme in the UK and up to 75 million fans worldwide.
Ironically, it was a tragedy that first triggered emotional ties among football fans toward the club. In 1958, eight players were killed in Munich, Germany, as the team aeroplane crashed. A surviving player, Bobby Charlton, noted (Dunphy, 1991, p. 249): “Before Munich, it was Manchester’s club, afterwards, everyone felt they owned a little bit of it.” Since that time, the club has devoted considerable time and expense to nurturing and developing its fan base, both in the UK and outside.
Commercial Relationships with Fans
Manchester United was among the first football clubs to track fan needs through research and cement ties through opportunities to purchase club-branded products and services. As the Premiership got underway in the early 1990s, Manchester United capitalised on its success to launch a stream of non-football-related products and services. Its Champs Cola was launched in 1993 (Manchester United aims to score, 1993). In the mid-1990s, Manchester United added branded wines, lagers and a champagne to the list (Manchester United tries branded champagne, 1997). Financial services (insurance, loans, credit cards) were added under the MU Finance brand. The club joined with Vodafone to launch MU Mobile, and with Travelcare to provide travel services under the MU Travel brand. In 2003, the Red Cinema Complex was opened in the Salford suburb of Manchester.
….
Building Relationships with Other Global Brands
Being associated with other international brand names lends global auras to brands as they go worldwide. Rossaaen & Amis (2004) noted that both Manchester United and Nike gained in global stature after the announcement of their global tie-in. In recent years Manchester United has formed commercial alliances with a number of global players in other industries: Vodafone, Pepsi, Budweiser and Fuji were all added to the club’s sponsorship list. Under these arrangements the club gains from sponsors’ international reputations and sponsors gain from their association with a marquee sports brand.
Building Relationships with Foreign Fans
In the home market, British clubs can build relationships with fans from being a part of the national local sports scenes over decades and through week-to-week media exposure during the soccer season (August to May). Taking the Manchester United image and brand into foreign markets poses the challenge of building emotional ties with fans less familiar with the club’s history or who have not witnessed at first hand the excitement of the ‘Theatre of Dreams’ atmosphere at the Old Trafford stadium. Televised broadcasts and print exposures are the entrees, but the all-important follow-ups are where club–fan relationships are built and fans are converted into consumers.
Building brand relationships with global consumers works best when not done through conventional mass media. Joachimsthaler & Aaker (1997) noted that the most successful brands are built through experiences in unconventional settings—sponsorships (such as Hugo Boss with Formula One racing, art exhibitions, golf); publicity (Benetton’s controversial non-product-related AIDS campaigns); or the Cadbury’s Chocolate theme park, Cadbury World, in Bournville, UK. All have one thing in common: customer involvement in the brand-building experience. The involvement factor has been critical to Manchester United’s brand-building efforts in Asia and North America.
The Asian Strategy
Manchester United estimates that it has about 40 million fans in Asia. Much of this support has resulted from the increased popularity of the sport within the region. While soccer has been around in Asia for a long time, demand for the sport has been revitalised through: (a) English teams that have periodically visited the region since the 1980s; (b) China qualifying for the 2002 World Cup that was hosted in South Korea and Japan; (c) Asian players signed by Manchester United (Dong Fangzhou and Park Ji-sung), Everton (Li Tie), Crystal Palace (Fan Zhiyi), Manchester City (Sun Jihai) and Tottenham Hotspur (Kazuyuki Toda); (d) live broadcasts through ESS (ESPN Star Sports); and (e) the prospect of Beijing hosting the 2008 Olympic Games (Bowman, 2003; Crispin, 2004b). Manchester United has capitalised on this interest through:
• South-east Asia tour 2001 in which the club played exhibition games in Malaysia, Singapore and Thailand to connect with their Asian fan base and promote their branded products and services. This was followed by a pre-season tour in 2005 comprising four matches in China, Hong Kong and Japan. During this tour, the club signed a sponsorship deal with Malaysia-based budget airline AirAsia, which included plane liveries using Manchester United branding.
• Establishment of foreign outlets—a Theatre of Dreams branded leisure complex in Hong Kong, which houses a museum, interactive games and a cafe, as well as selling club merchandise (Bawden, 1999). In 2004, the club opened a theme restaurant in the Chinese city of Chengdu. Another 100 outlets are planned for Asia (Crispin, 2004b).
• Club merchandise—in 2002, Manchester United granted Thailand’s Central Marketing Group rights to produce sporting casual wear, stationery, bags, car accessories and souvenirs for distribution in department stores, stand-alone outlets and megastores. This arrangement complements similar deals signed in Malaysia, the Philippines and Hong Kong. These producers were to service third-party markets in Asia and Europe (Jitpleecheep, 2002).
• Website promotions—the club, in conjunction with website specialist Lycos, launched a Chinese language website. Sponsored by Vodafone and listed at manunited.com.cn, the website attracts over 25 million page views per month and aids the club’s sponsorship, e-commerce and betting businesses (Manchester United Annual Report, 2003).
• Soccer schools—To further the club’s youth development policy, the first of its Asian soccer academies was opened in 2004 in Hong Kong. In the same year the club opened a soccer school in Disneyland, Paris, and this was followed in 2005 by the opening of a facility in Dubai Sports City in the United Arab Emirates.
The North American Strategy
Manchester United has about 5 million fans in North America, a following enhanced through Rupert Murdoch’s marketing of his Fox Sports World TV channel (now Fox Soccer Channel) in the US.
• In 2002, the club formed an alliance with baseball’s New York Yankees to extend television coverage over the Yankee network and to establish distribution for club merchandise through Yankee outlets.
• In 2004, the club teamed with Master Card International to launch a Manchester United credit card.
• In 2004, the club joined eight other famous European clubs for a series of games to promote the sport throughout the US—a move dubbed the “Manchester United Global Brand Enhancement Tour” (Saporito, 2004). This followed a 2003 tour, sponsored by Budweiser and Pepsi, that attracted over 250,000 fans.
• In 2003, the club piloted summer soccer schools in Seattle, Washington, a move that has since evolved into year-round youth development programmes (Manchester United Annual Report, 2003).
THE BRAND AS SYMBOL
Visual imagery and brand heritage become symbolic when they are uniquely associated with a product or service. Mc-Donald’s Golden Arches and the Levi Strauss storied jean history are testaments to the powers of brand symbolism and heritage. For Manchester United, the Red Devil nickname is well known throughout the soccer world, along with the club crest. But it is the club’s history that has always had popular appeal for soccer fans everywhere.
Brand Heritage, History and Development of a Distinctive Manchester United Culture
The club now known as Manchester United was originally formed in 1878 as the Newton Heath Lancashire and Yorkshire Football Club. Financial problems followed and the club was reformed under its present name in 1902. The club moved to its Old Trafford ground in 1910 (Manchester United official website, 2005b). Its move towards national and international prominence can be traced back to the appointment of Matt Busby as manager in 1945. It was Busby who established the traditional corporate culture that characterises the club today (Rossaaen & Amis, 2004). Wagg (2004) noted that Busby’s soccer philosophy established club precedents in many key areas. He established the youth orientation (the ‘Busby Babes’). Busby’s quest for soccer excellence extended nationally as he scoured the country in search of soccer talent. He promoted individuality and flair on the field but encouraged a club-oriented ‘one for all’ camaraderie off the field. He enhanced team unity by arranging off-the-field perks for all players, including golf memberships, local cinema passes and concessions at resort hotels. In 1956, he took the club into Europe in defiance of the English Football League. The Busby corporate culture legacy imbued Manchester United with a reputation for youth, talent development, attacking football and individual excellence, all within the framework of a club steeped in traditional values and atmosphere.
During the 1960s and 1970s, the club took advantage of the era’s Beatles, James Bond and Anglophile tendencies (including England’s 1966 World Cup win) to enhance its reputation, garnering the European Cup in 1968 with charismatic Irishman George Best being voted European Player of the Year. The club languished during the 1970s and 1980s as first Leeds United and then Nottingham Forest and, most notably, Liverpool superseded them as England’s leading club, although Manchester United was still the best supported (Rossaaen & Amis, 2004).
The hiring of Alex Ferguson in 1986 heralded a return to traditional club values and a revival in the club’s fortunes, with Manchester United dominating English football through the 1990s, winning the League title eight times over 1992–2003, and being crowned European champions in 1999. As Farred (2004, p. 222) noted: “It was a good decade to dominate English football… The Premier League was formed in 1992… a move that saw television revenues skyrocket and it made the clubs and players… wealthier. With the proliferation of satellite, cable and digital TV the beautiful game became… the truly global game.”
DISCUSSION
Key Success Factors for Global Sports Branding
Soccer is a global sport by virtue of its simplicity and its benefits as a player- and team-oriented form of physical exercise. It appeals to both collective and individual instincts that are essential aspects of the human existence (Hofstede, 1980). Its diffusion worldwide can be traced back to European colonial influences of the 19th and 20th centuries. This worldwide appeal is the basis for branding strategies put into motion by a number of European clubs.
English football clubs have capitalised on their national birthrights as organisers of the modern game, and on their first mover advantages in establishing competitive leagues to raise national standards of play. In making these moves, the EPL has attracted much media attention that has broadened its appeal both nationally and internationally as global media developments have taken clubs 100 years old and more into worldwide markets. In particular, the Murdoch media empire tie-ups have been instrumental in taking EPL and European soccer into over 100 national markets. The League’s August to May season has ensured that its activities are rarely out of the public eye.
But why has Manchester United, rather than Liverpool, Real Madrid, or Bayern Munich, become the best known soccer club in the world? All clubs, both in the EPL and worldwide, have been subject to the same industry pressures as Manchester United…. But the timing of its successes in both the 1960s and the 1990s has been critical. They occurred in eras which saw huge developments in the media industry. In 1968 television had only recently become available on a mass basis. In the 1990s, global communications and media came on stream as part of the globalisation push. Manchester United capitalised on an English football heritage that included tragedy (the Munich disaster), a football culture that emphasised youth, talent development and an attacking style of play, and a number of charismatic, talented players who attracted fans as much with their off-the-field activities as their matchday performances.
A Resource-Based Viewpoint (RBV) on Manchester United’s Success
If many other clubs were exposed to the same industry pressures as Manchester United, why was the Old Trafford club the first to translate sporting success first into national brand-building activities and then into a global reputation? The answer is a critical resource: management. Manchester United executives were the first in the industry to build and leverage their brand marketing capabilities. As Real Madrid president Florentino Perez noted in 2004: “In past years, Manchester United has become the best known club in the world because its marketing policies were ten years ahead of their time.” (Liga Futbol, 2004) Key management additions that gave the club its global impetus were Martin Edwards, who became club chairman in 1980, the recruitment of Umbro’s Peter Kenyon as director of international marketing in 1997, and the appointment of Peter Draper, also from Umbro, as director of marketing.
The appropriate organisational structures were created. Kenyon put into place a new affiliate, MU International, in 1998 to replicate the Old Trafford experience in international markets. In 2000, advertising agency Cheetham Bell was charged with the creation of a global brand awareness campaign; and in 2003, One United was launched as the club’s global brand initiative.
Professionalism in soccer club management is not new—Liverpool was renowned for it from the 1970s, when it enjoyed its greatest success (Taylor & Ward, 1997)—but Manchester United was the first to bring a true marketing-oriented focus to football to capitalise on its reputation as one of England’s premier clubs. In this instance, it was an alert management that initiated strategies to take advantage of the club’s ‘first mover’ advantages in the world game and establish itself in the minds of soccer fans worldwide.
Lessons from the Manchester United Model
Few sporting endeavors can become a Manchester United, but there are lessons to be gleaned.
• Creating and maintaining global brands requires constant exposure to maintain a worldwide profile. The EPL’s long season and the north–south hemispheric split are major advantages in sustaining enthusiasm among soccer fans worldwide, and in making club–fan connections worthwhile. This gives merchandise year-long sales appeal. Such advantages accrue less easily to sports such as American football with its four-month season, or baseball with its six-month season.
• Nothing succeeds like success, and success over significant periods has given rise to a Manchester United brand heritage that few can match in commerce or sports. Most of the world’s global brands have been successful for decades—Exxon, Coca-Cola, Marlboro, McDonald’s (Aaker, 1996). Success in the sports arena by comparison can be ephemeral (e.g. Olympic success), especially for individual athletes, who can rarely sustain sporting excellence over long periods. Athletes and their managers must therefore be alert in taking advantage of limited timeframes of opportunity.
• In contrast, sports teams that demonstrate success over long periods tend to be those that have established corporate cultures, with ‘club above all’ mentalities, while encouraging individuality within the team. Sports teams offer superior opportunities for brand development because of their longevity and their abilities to renew the excitement quotient through player development and acquisitions.
• Technology, especially the internet, gives fans and followers access to club and team activities. It is inexpensive. In almost any sport, youth, local and regional clubs can maintain website connections for information and merchandising purposes. Just as Manchester United creates opportunities for faraway fans to participate in the Theatre of Dreams, so sports club enthusiasts can follow their teams no matter where they are in the world. As webcast technologies develop, opportunities exist for sports fans anywhere to follow their favourite teams, be they local, regional, national or international. Such is the power of technology. With these renewals of club–player–fan relationships come opportunities for sales and commercial development.
• A theme evident both on- and off-the-field at Manchester United is the commitment to excellence. While this may be expected for on-the-field performances, the club’s expectations of excellence extend to management in providing resources to support club activities. As Gerrard (2004) noted, while other soccer clubs flinch under the onslaught of player wage inflation, Manchester United has maintained a star-studded roster while having one of the lowest wages to revenues ratios in the EPL. Professional management of the club–fan interface is integral for two reasons. First, it cements relationships with fans who can tangibly demonstrate their loyalties through merchandise sales and TV audience participation. Second, additional revenues allow clubs to make key reinvestments in player resources and fan facilities. Excellence in club reputation and image management has become a cornerstone for future survival and on-field performance.
• Within the academic field, the soccer fan–club interface in particular presents significant potential for research in at least three areas. First, as laid out by Morgan and Hunt (1994), relationship marketing and the forming of major emotional bonds between firms and customers is a fertile area for research. In few industries are the relationships between fans/customers and clubs as deep as in soccer and sports, generally. Belk, Wallendorf & Sherry (1989) have advocated the notion of ‘consumer devotion’ as extreme forms of brand loyalty. Hunt, Bristol & Bashaw (1999) have noted sports fans as logical extensions of the consumer devotion concept. Its further investigation in the sports or soccer arena would appear inevitable. Second, Manchester United already tracks customer needs in ways similar to many major corporations, but as the stakes rise in professional sports, academics and consumer behaviourists in particular have much to probe as soccer’s appeal broadens from its traditional audience to attract broader fan bases. Third, the depth of fan allegiances should be ideal subject matter for consumer psychologists as a baseline for future market segmentation strategies.
• As more athletes and clubs seek to leverage their personal or club reputations in the marketplace, the need is to develop a cadre of professional managers with distinctive expertise in sport. Manchester United is a testament to the difference competent management makes in professional sports. Additionally, with the advent of globalisation, future managers of sports should be fully prepared to deal with the international aspects of their activities. As the Glazer takeover starts a new chapter in the Manchester United history, uncertainty prevails. The club’s success has been founded on solid stakeholder principles, with commitments to players, fans, management and the soccer community generally. Taking the club public in 1991 brought shareholders into the equation. As Glazer pulled the club back into private ownership, there were opportunities to maintain and revitalise the traditional values that made the club famous. Whether this course is taken—or another that places the primary emphasis on profiteering—remains to be seen.
The club also faces uncertainty from an unexpected source. Roman Abramovich’s huge investment in Chelsea means that despite having the largest turnover and profit in English football, Manchester United can no longer guarantee to have the largest transfer and wage funding. In 2004–05 Chelsea broke the Manchester United/Arsenal stranglehold on the English Premiership and Manchester United finished the season without a trophy. In 2005–06 it would appear that Manchester United will have to be content with football’s equivalent of the wooden spoon—the Carling Cup, having failed in the Champions League and FA Cup earlier than its main competitors and seen Chelsea develop a commanding lead in the Premiership.
Similarly, Arsenal’s resurgence on the pitch through the recruitment of promising young players and its move to a new stadium with higher ticket prices than Manchester United could see it compete strongly with Manchester United financially.
On the commercial front, Manchester United has successfully replaced Vodafone as its primary shirt sponsor with United States financial services company AIG. [Ed. Note: In the face of mounting financial losses and a bailout by the United States government, AIG terminated its deal with Manchester United in 2009. The club subsequently announced that it will replace AIG with U.S.–based insurance broker Aon Corp. beginning in the 2010–11 season for a reported $131.2 million over 4 years.] Although this also offers potential in leveraging cash from supporters buying AIG products, it is arguable whether it provides the opportunities Vodafone delivered to develop the club brand. Being a global communications company, Vodafone helped to promote the club to tens of millions of people and was able to offer incremental revenue streams such as selling subscription mobile services and merchandise. On top of its sponsorship fee, these extra benefits have been worth millions to the club.
The success the club has had in recruiting fans on a global basis, however, has so far failed to deliver significant revenue benefits with estimates that only 2% of the club’s earnings are derived from overseas markets. In the Far East, club merchandise has to compete with the well established counterfeit industry, which can undercut official product prices by considerable margins.
The big challenge for the club, therefore, will be to realise its potential through digital media, in particular through subscription media revenues. There are two issues that could stand in the way. First, will the future on-field performance be strong enough to see fans with arguably only loose ties to the club pay large amounts for subscription access to live match footage? Second, the club will have to see the English Premiership break its collective selling of overseas media rights to be able to cash in on this fully. Professional football changed enormously in the 1990s as vast amounts of money flooded into the game from subscription television, gate receipts, merchandise and hospitality. It is set to undergo further massive change as it enters the unpredictable territory of the global digital revolution. The potential for development for a club such as Manchester United is enormous, but as in any period of major change, those at the forefront at the start are not necessarily those that will emerge as winners.
References
Aaker, D.A. (1996) Building strong brands. New York: The Free Press.
Amis, J. (2003) ‘Good things come to those who wait: the strategic management of image and reputation at Guinness’, European Sport Management Quarterly, 3, 189–214.
Aninat, E. (2002) ‘Surmounting the challenges of globalization’, Finance & Development, 39 (1), 4–7.
….
Barwise, P. & Robertson, T. (1992) ‘Brand portfolios’, European Management Journal, 10 (3) 277-286.
Bawden, T. (6 May 1999) ‘Man Utd. aims brand at Asian goal’, Marketing Week, 6.
Belk, R.W., Wallendorf, M. & Sherry, J.F. (1989) ‘The sacred and the profane in consumer behavior: theodicy on the odyssey’, Journal of Consumer Research, 16, 1–38.
Blatter, J. (1999) ‘The global game’, Harvard International Review, 21 (3) 86–89.
Bowman, J. (2003, July 25) ‘ESS rides on China sports interest to make new inroads’, Media, 16.
Boyle, R. & Haynes, R. (2000) Power play: sport, the media and popular culture. Harlow: Pearson Education.
Brand Strategy. (2003) Brand Papers: Sponsorship with a strategy. October p. 32.
….
Crispin, S.W. (2004a, June 9) ‘European soccer rolls over Asia, as Asian investors look to buy in’, Wall Street Journal, 1.
Crispin, S.W. (2004b, June 19) ‘Moving the goalposts’, Far Eastern Economic Review, 50–53.
….
Dunphy, E. (1991) A strange kind of glory—Sir Matt Busby and Manchester United. London: William Heinemann.
Farred, G. (2004) Anfield envy. In D.L. Andrews (ed.), Manchester United: A Thematic Study 222–238, London: Routledge.
….
Gerrard, B. (2003) ‘What does the resource-based view bring to the table in sport management research?’, European Sport Management Quarterly, 3, 139–144.
Gerrard, B. (2004) ‘Why does Manchester United keep on winning on and off the field?’ in Andrews, D.L. (ed.), Manchester United: A thematic study 65–86, London: Routledge.
Giulianotti, R. (2002, July–August) ‘Soccer goes global’, Foreign Policy, 82–83.
Granada to strike MUTV overseas deal. 11 February 1999, Marketing
Week, 14.
Hill, J.S. & Holloway, B.B. (2001) ‘Multi-market branding strategies in the new millennium’, Proceedings 10th World Business Congress, Zagreb Croatia: 252–259.
Hofstede, G. (1980) Culture’s consequences: International differences in work-related values. Beverly Hills, CA: Sage Publications.
Hunt, K.A., Bristol, T. & Bashaw, R.E. (1999) ‘A conceptual approach to classifying sports fans’, Journal of Services Marketing, 13 (6) 439–452.
Jitpleecheep, S. (6 September 2002) ‘Thai company to make Manchester United products’, Knight Ridder Tribune Business News, 1.
Joachimsthaler, E. & Aaker, D.A. (January–February 1997) ‘Building brands without mass media’, Harvard Business Review, 39–50.
….
Liga Futbol (July 19 2004) 1.
Lonsdale, C. (2004) ‘Player power: capturing value in the English football supply network’, Supply Chain Management: An International Journal 9 (5) 383–391. ‘
‘Manchester United aims to score with cola brand’, (September 30 1993) Marketing, 1.
Manchester United official website. (2005a) Retrieved from: http://www.manutd.com/history/default.sps?itype=814&
icustompageid=1029&tea mid=458&compid=7
Manchester United official website. (2005b) Retrieved from: http://www.manutd.com/history/heritage.sps?iType=489&icustompageid=944
Manchester United PLC Annual Report. (2003) Manchester, England: Manchester United plc.
Manchester United PLC Annual Report. (2004) Manchester, England: Manchester United plc.
Manchester United tries branded champagne. (July 10 1997) Marketing Week, 8.
Miller, T. (2004) Manchester USA? In Andrews, D.L. (ed.), Manchester United: A thematic study, 241–264, London: Routledge.
….
Morgan, R.M. & Hunt, S.D. (July 1994) ‘The commitment–trust theory of relationship marketing’, Journal of Marketing, 58 (3) 20–39.
Porter, M.E. (1980) Competitive strategy: Techniques for analyzing industries and competitors. New York: Free Press.
Porter, M.E. (1986) Competition in global industries. Cambridge MA: Harvard Business School Press.
Porter, M.E. (1990) The competitive advantage of nations. New York: Free Press.
Rossaaen, K. & Amis J. (2004) ‘From the Busby Babes to the Theatre of Dreams’, in Andrews, D.L. (ed.), Manchester United: a thematic study, 43–62, London: Routledge.
Roth, M. & Romeo, M.B. (1992) ‘Matching product category and country image perceptions: a framework for managing country-of-origin effects’, Journal of International Business Studies, 23 (3) 477–497.
Saporito, B. (9 August 2004) ‘Will Americans love Glasgow Celtic?’, Time, 22.
Sport’s premiers. (18 September 2003) Marketing Week, 22.
Sweney, M. (4 August 2004) ‘New season, added fizz’, Marketing, 16.
Taylor, R. & Ward, A. (1997, August 7) ‘The people’s game’, People Management, 22–28.
Timeline: ‘A history of TV football rights’, (25 February 2003) The Guardian, 9.
Wagg, S. (2004) ‘The team that wouldn’t die: on the mystique of Matt Busby and Manchester United’, in Andrews, D.L. (ed.), Manchester United: a thematic study, 13–27, London: Routledge.
CONSOLIDATED BALANCE SHEETS AT JUNE 30, 2009 AND 2008, AND CONSOLIDATED STATEMENTS OF OPERATIONS, CONSOLIDATED STATEMENTS OF MEMBERS’ EQUITY (DEFICIT), AND CONSOLIDATED STATEMENTS OF CASH FLOWS FOR THE FISCAL YEARS ENDED JUNE 30, 2009, 2008 AND 2007, INCLUDING THE NOTES THERETO.
Forest City Enterprises, Inc., Nets Sports and Entertainment, LLC and Subsidiaries
Nets Sports and Entertainment, LLC and Subsidiaries Consolidated Balance Sheets
| Assets | June 30, 2009 | 2008 (Unaudited) |
Current assets |
|
|
Cash and cash equivalents | $7,667,350 | $1,371,197 |
Accounts receivable, net | 12,167,573 | 14,213,491 |
Prepaid expenses and other current assets | 2,393,399 | 1,351,451 |
Total current assets | 22,228,322 | 16,936,139 |
Arena land and related costs | 183,858,993 | 137,922,470 |
Intangible assets, net | 165,484,127 | 198,863,261 |
Property and equipment, net | 5,512,121 | 6,565,630 |
Deferred loan costs, net | 1,506,152 | 929,226 |
Investments in NBA-related entities | 7,980,000 | 6,760,333 |
Other assets | 747,046 | 973,542 |
| 365,088,439 | 352,014,462 |
Total assets | 387,316,761 | 368,950,601 |
Liabilities and Members’ Deficit |
|
|
Current liabilities |
|
|
Accounts payable and accrued expenses | 33,053,050 | 16,178,565 |
Due to affiliates | 83,419,347 | 85,326,346 |
Deferred revenue | 4,735,994 | 13,563,560 |
Deferred compensation | 507,952 | 1,007,952 |
Total current liabilities | 121,716,343 | 116,076,423 |
Long-term liabilities |
|
|
Senior notes and credit facility | 207,157,400 | 205,618,400 |
Land loans | 18,617,533 | 20,342,510 |
Member loans | 37,145,448 | 10,884,906 |
Land sale—deposit payable | 85,000,000 | 40,000,000 |
Deferred compensation, long-term | 1,489,531 | 1,657,114 |
Deferred revenue, long-term | 1,301,239 | 1,461,143 |
Total long-term liabilities | 350,711,151 | 279,964,073 |
Total liabilities | 472,427,494 | 396,040,496 |
Commitments and contingencies | — | — |
Members’ deficit |
|
|
Member units |
|
|
Class B-1 | 60,000,000 | 60,000,000 |
Class B-2 | 38,594,984 | 37,124,051 |
Class A and C | 203,235,026 | 183,953,326 |
Accumulated deficit | (386,940,743) | (308,167,272) |
Total members’ deficit | (85,110,733) | (27,089,895) |
Total liabilities and members’ deficit | 387,316,761 | 368,950,601 |
Nets Sports and Entertainment, LLC and Subsidiaries Consolidated Statements of Operations
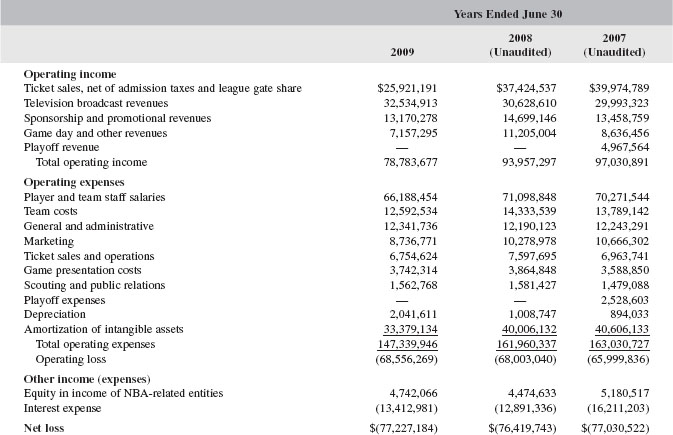
Source: Courtesy of EDGAR and the U.S. Securities and Exchange Commission.
Nets Sports and Entertainment, LLC and Subsidiaries Consolidated Statements of Cash Flows
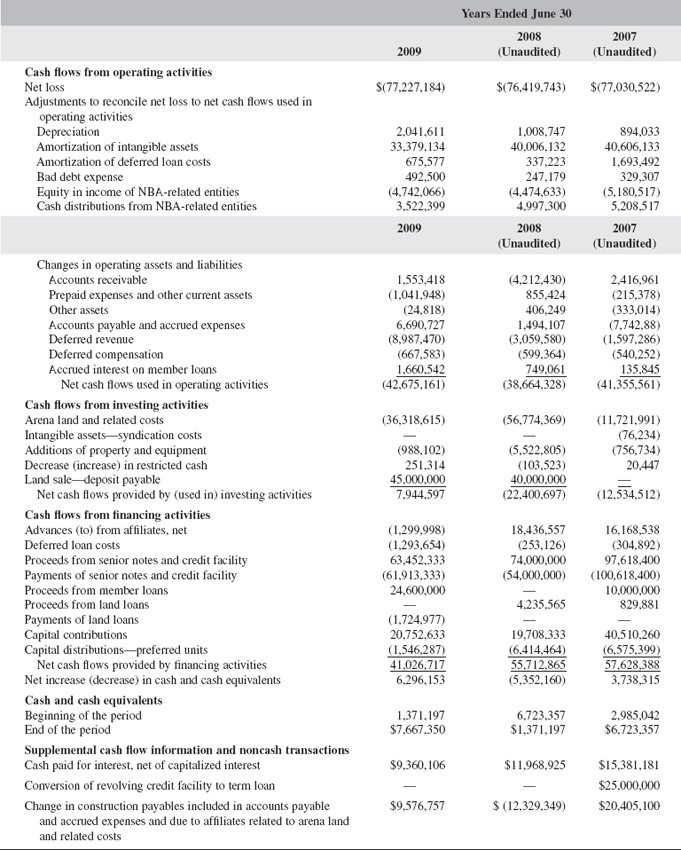
Source: Courtesy of EDGAR and the U.S. Securities and Exchange Commission.
NETS SPORTS AND ENTERTAINMENT, LLC AND SUBSIDIARIES
Notes to Consolidated Financial Statements June 30, 2009, 2008, and 2007
1. NATURE OF THE BUSINESS AND SUMMARY OF SIGNIFICANT ACCOUNTING POLICIES
Nature of the Business
Nets Sports and Entertainment, LLC (“NS&E”), a Delaware limited liability company, was formed for the purpose of acquiring 100% membership interests in Brooklyn Arena, LLC (“Brooklyn Arena”) and Brooklyn Basketball, LLC (“Brooklyn Basketball”).
Brooklyn Arena, a Delaware limited liability company, was formed for the purpose of developing and operating a proposed sports and entertainment arena in Brooklyn, New York (the “Arena”).
Brooklyn Basketball, a Delaware limited liability company, was formed to acquire 100% of the membership interests in New Jersey Basketball, LLC (“Basketball”). Basketball, a New Jersey limited liability company, primarily operates as a professional basketball team in New Jersey under the name of the New Jersey Nets (the “Nets”) and is a member of the National Basketball Association (“NBA”) through its execution of the NBA’s joint venture agreement.
Basis of Presentation
The accompanying financial statements have been prepared on a consolidated basis and include NS&E and its wholly-owned subsidiaries, Brooklyn Arena and Brooklyn Basketball (collectively, the “Company”).
The Company is an equity method investment of Forest City Enterprises, Inc. (“FCE”), a publicly traded company, and was deemed to be a significant subsidiary of FCE for its fiscal year ended January 31, 2009. As a result, audited financial statements for the Company are required to be filed with the Securities and Exchange Commission in accordance with Rule 3-09 of Regulation S-X, as of and for the year ended June 30, 2009.
….
Deferred Loan Costs
Costs incurred in connection with obtaining the revolving credit facility, term loan and senior notes (see Note 6) are capitalized and amortized over the term of the related financing. Costs incurred in connection with obtaining land loans are capitalized as deferred loan costs and the related amortization is capitalized as part of arena land and related costs in the accompanying Consolidated Balance Sheets. Amortization expense, net of capitalized amounts of $675,577, $337,223 and $1,693,492 for the years ended June 30, 2009, 2008 and 2007, respectively, is included in interest expense in the accompanying Consolidated Statements of Operations. The amount for 2009 and 2007 includes $127,898 and $1,271,992, respectively, of previously unamortized loan costs that were written off upon refinancing.
Investments in NBA-Related Entities
Investments in NBA-related entities are reported on the equity method. The Company’s allocable portion of the operating results of the NBA-related entities totaled $4,742,066, $4,474,633 and $5,180,517 for the years ended June 30, 2009, 2008 and 2007, respectively. Losses greater than the Company’s investment are not recorded as the Company is not required to provide funding for the operations of the NBA-related entities. The Company also received distributions of $3,522,399, $4,997,300 and $5,208,517 from the NBA-related entities during the years ended June 30, 2009, 2008 and 2007, respectively.
Membership Units
The capital structure of NS&E is comprised of four classes of membership units (“Units”), each having different priorities in distribution and differing capital funding requirements. The senior preferred units are entitled to distributions payable quarterly at a rate equal to the lesser of six-month London InterBank Offered Rate (“LIBOR”) plus 200 basis points or 6.5%. The junior preferred units are entitled to distributions payable quarterly at a rate of 8% per annum subject to an increase of 15% if distributions are not paid for two consecutive quarters. Undeclared preferred distributions have liquidation priority over common units.
NS&E made distributions on its two preferred classes of Units of $1,546,287, $6,414,464 and $6,575,399 for the years ended June 30, 2009, 2008 and 2007, respectively. No distributions have been declared since September 30, 2008.
Revenue and Expense Recognition
Ticket sales, television broadcasting and sponsorship and promotional revenues are recorded on a game-by-game basis over the playing season. Team expenses, principally player compensation and game expenses, are recorded as expense on the same basis, except for early contract terminations that are expensed upon termination. Accordingly, advance ticket sales for games not played yet are recorded as deferred revenue until the associated game is played or credit is applied for a subsequent game played. General and administrative expenses, as well as advertising and promotional expenses, are charged to operations as incurred. NBA expansion and relocation fees are recognized on an as-received basis as the NBA controls allocation and disposition of these funds until payments are made to the teams.
….
Intangible assets, net consists of the following at June 30, 2009 and 2008 [see Table 15]:
Intangible assets are amortized over their estimated useful lives on a straight-line basis over the playing season each year, with the exception of the franchise asset and syndication costs. Player contracts, arena lease, management contracts, season ticket holder list and sponsorship contracts are amortized on a straight-line basis generally over five, four, three, six and two years, respectively. The franchise asset and syndication costs are not amortized as they have been categorized as indefinite-lived intangible assets. Syndication costs incurred are in connection with the sale of member interests. Amortization of the intangible assets for the years ended June 30, 2009, 2008 and 2007 was $33,379,134, $40,006,132 and $40,606,133, respectively.
6. DEBT
….
Senior Notes
….
Pursuant to rules applicable to all teams participating in the League Wide Credit Facility, mandatory redemption is triggered when Basketball’s current exposure (reflecting, in part, the principal amount outstanding under the Senior Notes) exceeds a percentage of the average NBA membership value or when such exposure exceeds a multiple of its allocated television broadcast revenues, as defined. The maximum available outstanding debt amount for any team participating in the League Wide Credit Facility cannot exceed 60% of the average value of an NBA membership value, as defined. Also, a participating team’s outstanding debt may not exceed 4.5 times the sum of (i) its pro forma annual allocated national television broadcast revenues, as defined, and (ii) certain other pro forma contractually obligated income streams, as defined. Otherwise, on or before the first anniversary of the existence of any such excess, the team is required to offer to prepay its outstanding Senior Notes in an amount equal to such excess.
….
Credit Facility
On September 12, 2006, NS&E entered into a credit facility of $59,618,400 that matures on September 12, 2011. The interest rate on the credit facility is LIBOR (subject to a floor of 2.75%) plus 2.75%, or the alternate base rate, as defined in the credit facility agreement, plus 1.75% per annum and has no prepayment penalties. Borrowings will bear interest at the alternate base rate only when no reasonable means exists to ascertain the LIBOR rate or when the LIBOR rate for such interest period does not accurately reflect the cost to the lenders for maintaining their loans. This facility is subordinate to the below mentioned revolving credit facility and term loan. Interest expense on the credit facility totaled $3,420,274, $4,214,207 and $5,274,543 for the years ended June 30, 2009, 2008 and 2007, respectively.
….
10. LICENSE AGREEMENT
For its home basketball games, Basketball leases its playing facility (“IZOD Center”) from the New Jersey Sports and Exposition Authority (“NJSEA”) under a license agreement, which in November 2006 was extended by amendment to run through the 2012–2013 Nets season. Lease payments for the 2008–2009 Nets season were $51,840 per game. This per-game rent increases 3% per NBA season. The license agreement also defines the arena revenue sharing of sponsorship revenue, parking receipts, concession revenue and suite revenue. Basketball has the right to terminate the license agreement on an annual basis prior to the 2012–13 Nets season, without the payment of a penalty, as specified in the license agreement.
11. SIGNIFICANT MEDIA CONTRACTS
Basketball is entitled to receive future media revenues resulting from contracts it has entered into, as well as from contracts entered into by the NBA. The most significant of these are for national broadcast television and local and national cable television broadcasts. The current NBA national broadcast and national cable contracts took effect beginning with the 2008–2009 NBA season and currently run through the 2015–2016 NBA season. Basketball’s local media rights agreement with Yankees Entertainment and Sports Network, LLC (“YES Network”) began in the 2002–2003 NBA season and runs through the conclusion of the 2021–2022 NBA season, which includes certain market reset provisions and is subject to certain early termination provisions.
Table 15 Amortization of Intangible Assets
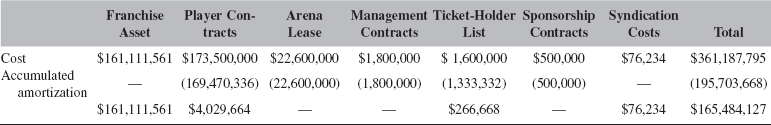
Source: Courtesy of EDGAR and the U.S. Securities and Exchange Commission.
Certain members of the Company have a minority ownership interest in the YES Network. Basketball earned gross broadcast revenue as a result of their contract with YES Network for local cable television broadcasts. These revenues are included in Television broadcast revenues in the accompanying Consolidated Statements of Operations.
In June 1976, the NBA and four teams from the American Basketball Association (“ABA”), including the Nets, the Denver Nuggets, the Indiana Pacers, and the San Antonio Spurs (the “Expansion Teams”) reached an agreement with the NBA to become members of the NBA, but no agreement was reached with the Spirits of St. Louis Basketball Club, L.P. (the “Spirits”), another former ABA team. Instead, a settlement was reached among the Spirits, the Expansion Teams and the NBA (the “1976 Settlement”) calling for the Spirits to receive approximately 1/7th of certain television revenues of Basketball earned by the NBA (calculated on the basis of 28 teams). Accordingly, Basketball receives net, approximately 85% of its share of NBA national television contract distributions.
Basketball’s net share of season television revenue for contracts in effect for the years ended June 30, 2009, 2008 and 2007 are shown in Table 16.
Revenue sharing earned on the NBA’s national television and national cable contracts are prorated by the NBA equally among the NBA’s 30 teams.
….
Table 16 Television Revenues
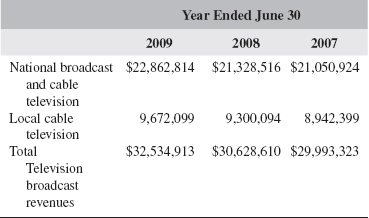
Source: Courtesy of EDGAR and the U.S. Securities and Exchange Commission.
12. RELATED PARTY TRANSACTIONS
Arena Development Agreement
Brooklyn Arena entered into a Development Agreement with an affiliate of a member (the “Developer”), pursuant to which it hired the Developer to plan, develop and oversee construction of the Arena for a fee not to exceed 5% of the total project cost at completion. Through June 30, 2009 and 2008, approximately $28 million and $21 million, respectively, of development fees were incurred.
Arena Land and Related Costs
The Company has borrowed from affiliates for Arena-related costs not financed through land loans. At June 30, 2009 and 2008, approximately $83.4 million and $85.3 million of loans from affiliates were outstanding, respectively and are included in Due to Affiliates in the accompanying Consolidated Balance Sheets. The loans accrue interest at the affiliates’ weighted average cost of capital, as defined, which averaged approximately 8% for the years ended June 30, 2009 and 2008. For the years ended June 30, 2009 and 2008, interest expense totaled $6.2 million and $6.8 million, respectively, and was all capitalized.
Member Loans
NS&E obtained member loans on various dates from January 2007 to June 2009 totaling $34,600,000 and in July and August 2009 obtained additional member loans totaling $24,200,000 to fund the operations of the team for the 2009-2010 season ending June 30, 2010, with the balance, if any, to be funded by the various means available to the Company. The loans mature at various dates from December 2011 to August 2013 and bear interest at various rates ranging from 5.5% to 20%. Member loans including accrued interest totaled $37,145,448 and $10,884,906 for the years ended June 30, 2009 and 2008. Interest expense incurred on loans totaled approximately $2,000,000, $749,000 and $136,000 for the years ended June 30, 2009, 2008 and 2007, respectively.
13. COMMITMENTS, CONTINGENCIES AND LITIGATION
….
NBA Fees
Basketball is required under NBA rules and regulations, among other things, to contribute to the NBA certain amounts, as defined, to be used by the NBA for operating expenses. For the years ended June 30, 2009, 2008 and 2007, Basketball contributed a fixed payment of approximately $28,000, $32,000 and $70,000, respectively, allocable from suite revenue and contributed approximately $1,707,000, $2,389,000 and $5,353,000, respectively, from regular season and playoff ticket sales based on each game’s ticket sales, as defined, according to a formula specified by the NBA. These NBA gate share fees are netted in Ticket sales, net of admission taxes and league gate share in the accompanying Consolidated Statements of Operations.
Pension Plans
Basketball participates in the NBA Players’ Pension Plan, NBA General Managers Pension Plan and the NBA Coaches, Assistant Coaches and Trainers Pension Plan, all of which are multiemployer defined benefit plans administered by the NBA. Contributions charged to pension costs totaled approximately $2,119,000, $1,790,000 and $1,280,000 for the years ended June 30, 2009, 2008 and 2007, respectively, and are included in Team costs in the accompanying Consolidated Statements of Operations. As of June 30, 2009 and 2008, there are accrued pension costs of approximately $1,948,000 and $1,637,000, respectively, which are included in Accounts payable and accrued expenses in the accompanying Consolidated Balance Sheets.
….
Naming Rights
On January 17, 2007, Brooklyn Arena and Basketball (collectively, the “Brooklyn Parties”) entered into a Naming Rights Agreement (the “NR Agreement”) with Barclays Services Corporation (“Barclays”), where, in exchange for certain fees and other considerations, the Arena will be named Barclays Center, and Barclays will be entitled to certain additional sponsorship, branding, promotional, media, hospitality, and other rights and entitlements in association with the Arena, Basketball and the Atlantic Yards Project. The NR Agreement expires on June 30 following the twentieth anniversary of the opening date of the Arena, subject to certain extension rights as defined in the NR Agreement. The NR Agreement also contains certain Arena construction commencement and Arena opening deadlines, as defined in the NR Agreement. If Brooklyn Arena fails to achieve these deadlines, Barclays is entitled to termination and other rights, as defined in the NR Agreement.
Suite License Agreements
As of June 30, 2009, Brooklyn Arena entered into suite license agreements with various companies and, in addition, granted a suite license as an entitlement to certain sponsors of the Arena within sponsorship agreements entered into by the Brooklyn Parties with such sponsors. Each suite license entitles the licensee the use of a luxury suite in the Arena, with most such luxury suites containing seats for viewing most events at the Arena (although one such suite license agreement applies only to Nets games at the Arena). The suite license agreements commence on the first date when the Arena is open to the general public and expire at various terms ranging from one to 20 years (i.e., for a suite license granted within the confines of a sponsorship agreement, the term of the suite license agreement will be coterminous with the term of the sponsorship agreement). As of June 30, 2009, NS&E has received advance deposits on suite license agreements of $375,600, which is included in Deferred revenue, long term in the accompanying Consolidated Balance Sheets.
Also, the suite license agreements call for the payment of the first license year fee to be made in advance of the opening of the Arena. Suite contracts currently have no impact on Basketball’s revenues, as deposits received for suites are accounted for as deferred revenue. These deposits are refundable, contingent upon the construction of the Arena.
Sponsorship and Product Availability Agreements
As of June 30, 2009, the Brooklyn Parties entered into sponsorship and product availability agreements (“Agreements”) with various entities, primarily with respect to the Arena and Basketball (after its planned relocation to the Arena). These Agreements entitle such sponsors to certain sponsorship, promotional, media, hospitality and other rights and entitlements in association with the Arena and Basketball, and expire at various terms ranging from three to ten years from the Opening Date of the Arena, as defined in each such Agreement. These Agreements may be terminated, without penalty, based on a failure to construct and open the Arena.
In addition, Basketball has entered into several sponsorship agreements relating to the Nets and its play of NBA games at the IZOD Center. These agreements have terms ranging from one year to a term that is coterminous with the Nets’ final season of play at the IZOD Center.
….
14. SUBSEQUENT EVENT
On September 23, 2009, NS&E and an affiliate signed a letter of intent with an affiliate of an international private investment fund (“Newco”) to create a strategic partnership for the development of the Atlantic Yards Project, a 22-acre residential and commercial real estate project in Brooklyn, and the Barclays Center, the future home for the Nets.
In accordance with the agreement, Newco will invest $200,000,000 and make certain other contingent funding commitments to acquire through the issuance of newly-issued units a 45% interest in Brooklyn Arena and 80% interest in Brooklyn Basketball, and the right to purchase up to 20% of the Atlantic Yards Development Company, which will develop the non-arena real estate. Following the completion of the transaction, NS&E would own a 55% interest in Brooklyn Arena and 20% interest in Brooklyn Basketball.
1. Discuss the relationship of team heritage/tradition to team value. Why does a team’s heritage become a driver of value?
2. How can younger franchises or expansion franchises develop the heritage that you would find in a traditional professional sports town like New York, Boston, Chicago, etc.?
3. Discuss the specific proposals set forth by Jack Williams. Are there any that threaten fan alienation by abandoning traditions of the games? Are there any that could threaten competition on the field? How should a team roll out similar reforms to ensure that they will be accepted by fans?
4. Should sports leagues try to realize revenues from gambling, or are the threats to the integrity of competition too great?
5. Is the fantasy sports boom an example of leagues benefiting from gambling without getting their hands dirty?
6. Given the study claiming that “it is performance on the court, not star power, that attracts fans,” in the NBA, are teams wrong to market their teams around star players?
7. Would teams be better off explicitly tying star player compensation to revenues generated through ticket sales, merchandising, etc.?
8. In 2007, Coates and Humphreys said that attendance demand for concessions was generally price elastic. Do you think a similar study would find different results after the economic downturn of 2008 and 2009?
9. Would it be better to reduce ticket prices in order to maximize attendance, and then concessions, parking, etc.? Explain how the answer may vary by sport.
10. In what scenarios should teams consider moving their ticket sales to an auction model?
11. What are the justifications for underpricing season tickets?
12. In what other areas of team revenue (other than ticket sales) could variable pricing be used effectively?
13. What lessons can American teams take from Manchester United’s rise as a global brand? What can they reasonably emulate, and what factors are specific to Manchester United?
14. What factors are necessary to create an effective marketing alliance of American and European teams?