
I’ve been told that not all developers are perfect like you and me. We
never make mistakes in our code, but sometimes other developers make
mistakes that we have to clean up. When that happens, the debugging features built into
Rails come in handy. This chapter covers those built-in debugging features, starting with
the debug helper method, which makes it easier to see the values of
variables in your application’s views.
We spent some time looking at the Rails log in previous chapters. In this chapter, you’ll also see how to add your own messages to that log. Finally, using the debugger gem, you can step inside your application as it’s running to track down really tough bugs.
Rails includes a view helper method called debug that you
can use to display the value of an instance variable or method call available inside a
Rails view. This helper wraps its output in <pre> tags so
it’s easier to read.
For example, let’s see how the output of the current_user
method changes as you move through the application. First edit
app/views/layouts/application.html.erb and add a call to the
debug helper just below the yield method, as shown
here:
<!DOCTYPE html>
<html>
--snip--

    <%= yield %>

    <%= debug current_user %>
  </div>
</body>
</html>
Now start the Rails server, if it’s not already running, and go to
http://localhost:3000/login in your browser. You should see the
output from the debug helper just below the Log In button, as shown in
Figure 13-1.
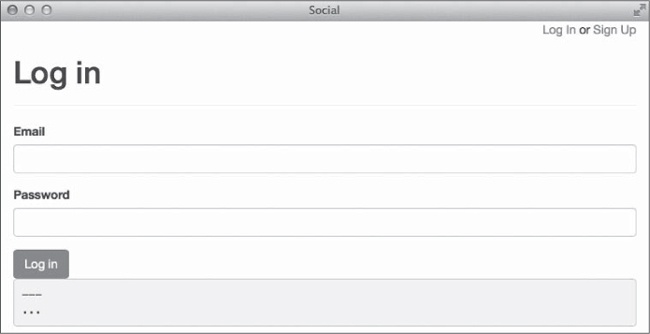
At this point, the output is simply three dashes on one line followed by three dots on
the next line. The debug helper is using YAML to format its output.
YAML is a data serialization language used frequently in Rails projects. For example, the
Rails database configuration file (config/database.yml) is in YAML
format. You also used YAML in Chapter 10 to define fixtures that provide
default data for tests.
In YAML, the three dashes signify the beginning of a document. Three dots
indicate the end of a YAML document. In other words, this is an empty YAML document. On
the Log In page current_user is nil, and the empty
YAML document reflects that.
Now log in to your application and scroll to the bottom of the posts index page to see
how the output from current_user changed.
➊ --- !ruby/object:User
➋ attributes:
    id: 1
    name: Alice
    email: [email protected]
    created_at: 2014-02-26 ...
    updated_at: 2014-02-26 ...
    password_digest: "$2a$10$7..."
Now the YAML output is a little more fleshed out. The first line starts with three
dashes followed by !ruby/object:User ➊, which represents the
type of object being shown. In this case, the object is a Ruby object of class
User. The word attributes ➋ represents the
start of the object’s attributes and their values. Below that, you see the
User model attributes: id,
name, email, created_at,
updated_at, and password_digest.
Displaying this information is a great way to monitor the state of your application as
it runs. Unfortunately, using the debug helper limits you to seeing
values only for your current session, and if your application renders nothing in the
browser window, you won’t be able to see any values at all. In those cases, you can
rely on the Rails log to track down bugs.
Throughout this book, I’ve talked about Rails server output. As the Rails server runs, it shows a copy of the development log. You can open the file log/development.log in your editor to examine that log even when the server is not running.
This file may be quite large depending on how much you’ve been using the
application the log belongs to. You can use the bin/rake log:clear
command to clear your application’s log files.
The Rails logger uses levels named :debug,
:info, :warn, :error,
:fatal, and :unknown. These levels indicate the
severity of the message being logged. The level is assigned by the developer when a
message is logged.
If the level is equal to or higher than the log level configured for the current
environment, the message is added to the corresponding log file. The default log level
in the development and test environments is :debug and above, and the
default log level in the production environment is :info and
above.
Because the default log level in production does not display the
:debug level, you can leave these debug messages in your code
without worrying about cluttering up the logs when your application is deployed and
running.
Each of the log levels has a corresponding method used to print messages. For
example, you can call logger.debug
"Message" to
add a message with the level :debug to the log.
You’ve already seen how to use the debug helper to show
values in views. Rails logger messages are typically used in models and
controllers.
Let’s add the value of current_user to the log and compare
it to what is shown in the browser. Open the file
app/controllers/posts_controller.rb in your editor and add the
logger statement shown here to the PostsController:
class PostsController < ApplicationController
before_action :authenticate_user!
def index
➊ logger.debug current_user
user_ids = current_user.timeline_user_ids
--snip--This line ➊ adds the output of current_user to the
development log every time the posts index action is called. Refresh
the page in your browser and examine the log output in your terminal:
Started GET "/" for 127.0.0.1 at 2014-04-05 19:34:03 -0500
Processing by PostsController#index as HTML
User Load (0.1ms) SELECT "users".* FROM "users"
WHERE "users"."id" = ? LIMIT 1 [["id", 1]]
➊ #<User:0x007fd3c94d4e10>
(0.1ms) SELECT "users".id FROM "users" ...
--snip--
Rendered posts/index.html.erb within layouts/application (27.1ms)
Completed 200 OK in 61ms (Views: 35.9ms | ActiveRecord: 1.7ms)The logger.debug converts the value of the
current_user method to a string and adds it to the log as
#<User:0x007fd3c94d4e10> ➊. Unfortunately, when a Ruby
object like current_user is converted to a string, the default
representation is the object’s class followed by its
object_id.
What you want to do is inspect the object. The
inspect method displays attributes and values when called on a
Rails model. Change the call to current_user that you just added to
the PostsController to current_user.inspect and
refresh the page in your browser again.
Started GET "/" for 127.0.0.1 at 2014-04-05 19:34:27 -0500
Processing by PostsController#index as HTML
User Load (0.1ms) SELECT "users".* FROM "users"
WHERE "users"."id" = ? LIMIT 1 [["id", 1]]
➊ #<User id: 1, name: "User One", ...>
(0.1ms) SELECT "users".id FROM "users" ...
--snip--
Rendered posts/index.html.erb within layouts/application (27.1ms)
Completed 200 OK in 63ms (Views: 40.9ms | ActiveRecord: 1.7ms)This output is much better. The value of current_user is
shown ➊ with all attributes, just as it appears in the Rails console. The Rails
logger displays any string you send to it. I sometimes label the data that I’m
logging and add characters like stars to make the data stand out more:
class PostsController < ApplicationController
before_action :authenticate_user!
def index
logger.debug "** current_user = "
logger.debug current_user.inspect
user_ids = current_user.timeline_user_ids
--snip--You may have had some trouble locating the value of current_user
in output before, but with human-readable labels, it is easier to spot.
Sometimes simply seeing the values of variables after the fact is not enough to debug an issue. The Ruby debugger lets you step into your application as it runs. Inside the debugger, you can see code as it is executed, examine the values of variables, and even change values.
First, edit your application’s Gemfile to add the debugger gem. For Ruby version 2.0 or greater, you should use the byebug gem. Older versions of Ruby should use the debugger gem.
--snip--

# Use debugger
gem 'byebug', group: [:development, :test]
The correct gem for your Ruby version is commented out at the bottom of the
Gemfile. Remove the # from the beginning of the
line and save the file. The debugger isn’t needed in the production environment, so
this line only adds it to the development and test groups.
Because you changed the Gemfile, remember to update installed
gems with the bin/bundle install command. You also need to restart the
Rails server:
$ bin/rails serverNow that you’ve installed the debugger, let’s see what it can do.
If you call the debugger method in your code, your
application stops executing when it reaches that call, and Rails launches the debugger.
For example, remove the logger statements you added to the posts
index action earlier in
app/controllers/posts_controller.rb and instead use the
debugger:
class PostsController < ApplicationController
  before_action :authenticate_user!

  def index
    user_ids = current_user.timeline_user_ids

    debugger

    @posts = Post.includes(:user).where(user_id: user_ids)
               .paginate(page: params[:page], per_page: 5)
               .order("created_at DESC")
  end
--snip--
When the index action is called, execution pauses at the
debugger statement, and the debugger is started. Refresh the posts
index page in your browser. The page shouldn’t finish loading. Check the server
output in your terminal, and you should see the debugger prompt:
➊ .../social/app/controllers/posts_controller.rb:9
  @posts = Post.includes(:user).where(user_id: user_ids)

  [4, 13] in .../social/app/controllers/posts_controller.rb
➋    4    def index
     5      user_ids = current_user.timeline_user_ids
     6
     7      debugger
     8
  => 9   @posts = Post.includes(:user).where(user_id: user_ids)
     10                 .paginate(page: params[:page], per_page: 5)
     11                 .order("created_at DESC")
     12    end
     13
➌ (rdb:2)
In the normal server output, you should see a line indicating the current position ➊ in the source code. In this case, execution is paused at line 9 inside app/controllers/posts_controller.rb. Next, the output ➋ shows your place in the code. You should see 10 lines of code with line 9 in the center. Finally, the debugger prompt ➌ is waiting for your input.
The debugger accepts a variety of commands for working with your application’s code. This section covers the most common commands. Unless otherwise noted, each of these commands can be abbreviated using the first letter of its name.
Start by entering the help command:
(rdb:2) help
ruby-debug help v1.6.6
Type 'help <command-name>' for help on a specific command

Available commands:
backtrace  break    catch    condition
continue   delete   disable  display
down       edit     enable   eval
exit       finish   frame    help
info       irb      jump     kill
list       method   next     p
pp         ps       putl     quit
reload     restart  save     set
show       skip     source   start
step       thread   tmate    trace
undisplay  up       var      where

(rdb:2)
The help command shows a list of all available debugger commands.
You can also follow help with the name of another command for
information on a specific command.
When you entered the debugger, you were shown 10 lines of code around your current
position. The list command displays the next 10 lines of code inside
the debugger.
(rdb:2) list
[14, 18] in /Users/tony/code/social/app/controllers/posts_controller.rb
   14    def show
   15      @post = Post.find(params[:id])
   16      @can_moderate = (current_user == @post.user)
   17    end
   18  end
(rdb:2)
Each time you enter the list command another 10 lines of code are
displayed. In this case, the current file has only five more lines of code, so those
five lines are shown. Enter list- to see the previous 10 lines of
code, and enter list= to show the code around your current
position:
(rdb:2) list=
[4, 13] in /Users/tony/code/social/app/controllers/posts_controller.rb
   4    def index
   5      user_ids = current_user.timeline_user_ids
   6
   7      debugger
   8
=> 9   @posts = Post.includes(:user).where(user_id: user_ids)
   10                  .paginate(page: params[:page], per_page: 5)
   11                  .order("created_at DESC")
   12    end
   13
(rdb:2)
Now that you know where you are in the code, you might want to examine the
values of some variables. The var command displays currently defined
variables and their contents. To see local variables, enter the var
local command:
(rdb:2) var local
self = #<PostsController:0x007ffbfeb21018>
user_ids = [2, 1]
(rdb:2)
Here, only two local variables are defined. The variable self
indicates that you are inside the PostsController. The variable
user_ids received its contents on line 5 in the previous
code.
List instance variables and their values with the var instance
command:
(rdb:2) var instance
@_action_has_layout = true
@_action_name = "index"
@_config = {}
@_env = {"GATEWAY_INTERFACE"=>"CGI/1.1", "P...
@_headers = {"Content-Type"=>"text/html"}
@_lookup_context = #<ActionView::LookupCont...
@_prefixes = ["posts", "application"]
@_request = #<ActionDispatch::Request:0x007...
@_response = #<ActionDispatch::Response:0x0...
@_response_body = nil
@_routes = nil
@_status = 200
@current_user = #<User id: 1, name: "User O...
@marked_for_same_origin_verification = true
(rdb:2)
Quite a few instance variables are already defined at this point. The only instance
variable set by this code is @current_user. This instance variable is
defined in the current_user method in
ApplicationController. The other variables are defined by Rails.
Note that @posts is not defined yet. Your current position is line 9,
which defines @posts, but that line has not yet been executed.
The display command adds a variable to the display list inside
the debugger. If you are especially interested in the value of
user_ids, for example, enter the display
user_ids command to add it to the display list, as shown here:
(rdb:2) display user_ids
1: user_ids = [2, 1]
(rdb:2)
You can also show the contents of the display list and their values with the
display command, abbreviated disp:
(rdb:2) disp
1: user_ids = [2, 1]
(rdb:2)
To remove a variable from the display list, use the undisplay
command followed by the number corresponding to a variable in the list. For example,
undisplay 1 removes user_ids from the display
list.
Use the eval command to evaluate any Ruby code you like and print
its value. This command is abbreviated p, as in print. For example,
you might want to print the length of the user_ids array or the
output from the current_user method.
(rdb:2) eval user_ids.length
2
(rdb:2) p current_user
#<User id: 1, name: "User One", email: "user...
(rdb:2)
The debugger is a Ruby shell, so you can also evaluate Ruby commands by simply
entering them at the prompt. The eval command is not even necessary.
For example, set the value of user_ids to an empty array by entering
this statement at the debugger prompt:
(rdb:2) user_ids = []
[]
(rdb:2)
This prints the return value of the expression user_ids = [] just
as if you had typed it in the Rails console.
Several commands are available for executing your application’s code inside
the debugger. The most commonly used command is next, which executes
the next line of code. The next command executes methods on the next
line of code without moving inside the method.
The step command is similar, but it also shows you each line that
executes inside method calls. The step command moves through your
application and its dependencies literally one line of code at a time. You can use it to
find bugs in the Rails framework or other gems used by your application.
When you are finished moving around in your code, use the
continue command to resume execution and finish the current
request. If you’ve been following along throughout this section, you may remember
you set the value of user_ids to an empty array. When you
continue execution and the posts index page finally renders, no
posts are displayed. Because you set user_ids to an empty array, the
@posts instance variable is also empty, and the render
@posts statement inside the index view renders
nothing.
The Ruby debugger probably isn’t something you’ll use every day, and some developers never use it. But if you ever encounter a really hard-to-find bug, the debugger is invaluable.
This chapter described several debugging techniques. Displaying values in your
application’s views with the debug helper method or adding data
to the log file with logger statements will help you track down most
bugs. The interactive debugger provides complete control over your application, allowing
you to step through your code and pinpoint bugs that are particularly hard to find.
The next chapter covers web application programming interfaces, or APIs. We’ll discuss using other application’s APIs and creating your own.