
![]()
Extended Events
Extended Events are a lightweight monitoring system offered by SQL Server. Because the architecture uses so few system resources, they scale very well and allow you to monitor their instances, with minimal impact on user activity. They are also highly configurable, which gives you in your role as a DBA a wide range of options for capturing details from a very fine grain, such as page splits, to higher-level detail, such as CPU utilization. You can also correlate Extended Events with operating system data to provide a holistic picture when troubleshooting issues. The predecessor to Extended Events was SQL Trace, and its GUI, called Profiler. This is now deprecated for use with the Database Engine, and it is recommended that you only use it for tracing Analysis Service activity.
Extended Events Concepts
Extended Events have a rich architecture, which consists of events, targets, actions, types, predicates, and maps. These artifacts are stored within a package, which is, in turn, stored within a module, which can be either a .dll or an executable. We discuss these concepts in the following sections.
Packages
A package is a container for the objects used within Extended Events. Here are the four types of SQL Server package:
- Package0: The default package, used for Extended Events system objects.
- Sqlserver: Used for SQL Server–related objects.
- Sqlos: Used for SQLOS-related objects.
- SecAudit: Used by SQL Audit; however, its objects are not exposed.
Events
An event is an occurrence of interest that you can trace. It may be a SQL batch completing, a cache miss, or a page split, or virtually anything else that can happen within the Database Engine, depending on the nature of the trace that you are configuring. Each event is categorized by channel and keyword (also known as category). A channel is a high-level categorization, and all events in SQL Server 2014 fall into one of the channels described in Table 19-1.
Table 19-1. Channels
|
Channel |
Description |
|---|---|
|
Admin |
Well-known events with well-known resolutions. For example, deadlocks, server starts, CPU thresholds being exceeded, and the use of deprecated features. |
|
Operational |
Used for troubleshooting issues. For example, bad memory being detected, an AlwaysOn Availability Group replica changing its state, and a long IO being detected, are all events that fall within the Operational channel. |
|
Analytic |
High-volume events that you can use for troubleshooting issues such as performance. For example, a transaction beginning, a lock being acquired, and a file read completing are all events that fall within the Analytic channel. |
|
Debug |
Used by developers to diagnose issues by returning internal data. The events in the Debug channel are subject to change in future versions of SQL Server, so you should avoid them when possible. |
Keywords, or categories, are much more fine grain. There are 47 categories within SQL Server 2014, which are detailed in Table 19-2.
Table 19-2. Categories
|
Category |
Description |
|---|---|
|
access_methods |
Events related to parallel scans with IO affinity. |
|
alwayson | hadr |
Events related to AlwaysOn Availability Groups. |
|
broker |
Events related to Service Broker communications. |
|
cdc_logscan |
Events related to Change Data Capture errors and sessions. |
|
change_tracking |
Events related to Change Tracking cleanup operations. |
|
checkpoint | ckpt_trace | ckptworker_trace |
Events related to memory-optimized checkpoints. |
|
clr |
Events related to the Common Language Runtime—for example, when an assembly is loaded. |
|
cursor |
Events related to cursors, such as a cursor being opened or recompiled. |
|
database |
Database-level events, such as checkpoints beginning and databases starting, as well as page splits and Ghost Cleanup operations (used to physically remove deleted records from a page). |
|
deadlock_monitor |
Events related to deadlocks. |
|
deploy |
Events related to memory-optimized table internals. |
|
errors |
Events related to errors within the Database Engine. |
|
exception |
Events related to exceptions within the Database Engine, such as a memory dump or a stack trace occurring. |
|
execution |
Events related to query execution, such as statements starting and plan cache hits. |
|
filetable |
Events related to the use of FileTables, such as IO requests to FileTables. |
|
fulltext |
Events related to full-text search operations. |
|
garbage_collection | gc |
Events related to garbage collection internals, such as when a garbage collection cycle completes. |
|
index |
Events related to index operations, such as an index scan occurring or a full-text index crawl starting. |
|
init |
The CLR initialization failure event. |
|
io |
Events related to IO, such as physical page reads and writes. |
|
latch |
Events related to latching, such as latch promotion and demotion. |
|
lock |
Events related to locking, such as locks being acquired or lock timeouts occurring. |
|
memory |
Events related to memory, such as bad memory being detected by the operating system or pages being allocated to the buffer pool. |
|
merge_trace |
Events related to internal SQL Server operations. |
|
oledb |
Events related to distributed queries using an OLEDB provider. |
|
optimization |
Events related to the Query Optimizer’s cardinality estimation. |
|
process |
Events related to CPU management internals, such as CPU configuration changes. |
|
query_store |
Events related to the Query Store, which is a feature that will be available in the next major release of SQL Server. |
|
replication |
Events related to the Log Reader Agent in a Replication topology. |
|
scheduling |
Events related to SQLIO’s task scheduler, including wait information. |
|
security |
Events related to authentication performance. |
|
server |
Instance level events, such as reads and writes to a buffer pool extension and trace flags being changed. |
|
session |
Events related to the user session. For example, login, logout, and when a Resource Governor classifier function fires. Resource Governor is discussed in Chapter 23. |
|
storage_management |
Events related to storage, such as page and extent allocation and deallocation. |
|
synchronization |
Events related to spinlocks. |
|
task |
Events related to subroutine initialization internals. |
|
transaction | transactions |
Events related to transactions, such as when a transaction begins and when a memory-optimized OLTP operation generates a log record. |
|
transmitter | transport | ucs |
Events related to the unified communications stack. |
|
warnings |
Events related to warnings in the Database Engine, such as Query Optimizer timeouts and missing column statistics. |
|
xtp |
Events related to In-Memory OLTP. |
Targets
A target is the consumer of the events; essentially, it is the device to which the trace data will be written. The targets available within SQL Server 2014 are detailed in Table 19-3.
Table 19-3. Targets
|
Target |
Synchronous/ Asynchronous |
Description |
|---|---|---|
|
Event counter |
Synchronous |
Counts the number of events that occur during a session |
|
Event file |
Asynchronous |
Writes the event output to memory buffers and then flushes them to disk |
|
Event pairing |
Asynchronous |
Determines if a paired event occurs without its matching event, for example, if a statement started but never completed |
|
ETW* |
Synchronous |
Used to correlate Extended Events with operating system data |
|
Histogram |
Asynchronous |
Counts the number of events that occur during a session, based on an action or event column |
|
Ring buffer |
Asynchronous |
Stores data in a memory buffer, using First In First Out (FIFO) methodology |
*Event Tracking for Windows
Actions are commands that allow additional information to be captured when an event fires. An action is fired synchronously when an event occurs and the event is unaware of the action. There are 50 actions available in SQL Server 2014 that allow you to capture a rich array of information, including the statement that caused the event to fire, the login that ran this statement, the transaction ID, the CPU ID, and the call stack.
Predicates are filter conditions that you can apply before the system sends events to the target. It is possible to create simple predicates, such as filtering statements completing based on a database ID, but you can also create more complex predicates, such as only capturing a long IO that has a duration greater than five seconds, or only capturing the role change of an AlwaysOn Availability Group replica if it happens more than twice.
Predicates also fully support short-circuiting. This means that if you use multiple conditions within a predicate, then the order of predicates is important, because if the evaluation of the first predicate fails, the second predicate will not be evaluated. Because predicates are evaluated synchronously, this can have an impact on performance. Therefore, it is prudent to design you predicates in such a way that predicates that are least likely to evaluate to true come before predicates that are very likely to evaluate to true. For example, imagine that you are planning to filter on a specific database (with a database ID of 6) that is the target of a high percentage of the activity on the instance, but you also plan to filter on a specific user ID (MyUser), which is responsible for a lower percentage of the activity. In this scenario, you would use the WHERE (([sqlserver].[username]=N’MyUser’) AND ([sqlserver].[database_id]=(6))) predicate to first filter out activity that does not relate to MyUser and then filter out activity that does not relate to database ID 6.
All objects within a package are assigned a type. This type is used to interpret the data stored within the byte collection of an object. Objects are assigned one of the following types:
- Action
- Event
- Pred_compare (retrieve data from events)
- Pred_source (compare data types)
- Target
- Type
You can find a list of predicate comparators and predicate sources by executing the queries in Listing 19-1.
A map is a dictionary that maps internal ID vales to strings that DBAs can understand. Map keys are only unique within their context and are repeated between contexts. For example, within the statement_recompile_cause context, a map_key of 1 relates to a map_value of Schema Changed. Within the context of a database_sql_statement type, however, a map_key of 1 relates to a map_value of CREATE DATABASE. You can find a complete list of mappings by using the sys.dm_xe_map_values DMV, as demonstrated in Listing 19-2. To check the mappings for a specific context, filter on the name column.
Sessions
A session is essentially a trace. It can contain events from multiple packages, actions, targets, and predicates. When you start or stop a session, you are turning the trace on or off. When a session starts, events are written to memory buffers and have predicates applied before they are sent to the target. Therefore, when creating a session, you need to configure properties, such as how much memory the session can use for buffering, what events can be dropped if the session experiences memory pressure, and the maximum latency before the events are sent to the target.
You can create an event session using either the New Session Wizard, the New Session Dialog Box, or via T-SQL. We explore each of these options in the following sections. Before creating any event sessions, however, we first create the Chapter19 database, populate it with data, and create stored procedures, which we use in later examples. Listing 19-3 contains the script to do this.
You can invoke the New Session Wizard from SQL Server Management Studio by drilling through Management | Extended Events in Object Explorer and selecting New Session Wizard from the Sessions context menu. After you pass through the Introduction page of the wizard, the Set Session Properties page displays, as illustrated in Figure 19-1. Use this page to specify a name for the session and to indicate if the session should start automatically each time the instance starts. We use the session to track log file IO, so we configure it to start when the instance starts and name it LogFileIO.

Figure 19-1. The Set Session Properties page
On the Choose Template page of the wizard, you can select a predefined template from the drop-down list. Predefined templates are configured with sets of events and predicates that are useful for DBAs in common scenarios. After you select a template, you are able to refine it to suit your individual requirements, or alternatively, you can choose to not use a template. This option configures an empty session into which you can add all events and predicates manually. The Choose Template page is illustrated in Figure 19-2. Because we plan to monitor log file IO, unsurprisingly, we select the Database Log File IO Tracing template.

Figure 19-2. The Choose Template page
On the Select Events To Capture page, we can add or remove events we would like captured in the session. You can search the Event Library for a keyword, or filter by channel or category. When you highlight an event, a description displays, along with the Event fields. You can then select the event by using the right pointing arrow, or you can remove an event by selecting it in the right hand pane and using the left pointing arrow. In our case, we have filtered on the IO category and added the database_log_flush_wait event, as shown in Figure 19-3.

Figure 19-3. The Select Events To Capture page
On the Capture Global Fields page, we can specify any actions that we need. In our scenario, in addition to the preselected actions, we choose to capture the database_name, as demonstrated in Figure 19-4. Actions are known as global fields, because they are available to all events as opposed to event fields, which are local to their specific event.

Figure 19-4. The Capture Global Fields page
On the Set Session Event Filters page, you can review the filters that have been applied to the template in the top pane. In the bottom pane, you can add additional predicates to target the trace to your specific needs. Figure 19-5 illustrates adding a predicate that filters on the database_name global field so that only events from this database are captured.

Figure 19-5. The Set Session Event Filters page
On the Specify Session Data Storage page of the wizard you can specify the target for the event session. In our scenario, we choose to write the events to a file. Therefore, we need to specify the fully qualified filename for the trace file on the server. The default file extension is .XEL. We also specify the maximum file size for the capture, and if we want new files to be created when this maximum size is reached, we also need to specify a value for the maximum number of files, as shown in Figure 19-6.

Figure 19-6. Specify Session Data Storage
The Summary page, displayed in Figure 19-7, summarizes how the Event Session will be configured; it also gives us the option of scripting the configuration, which is highly recommended for documentation, change control, and code reusability.
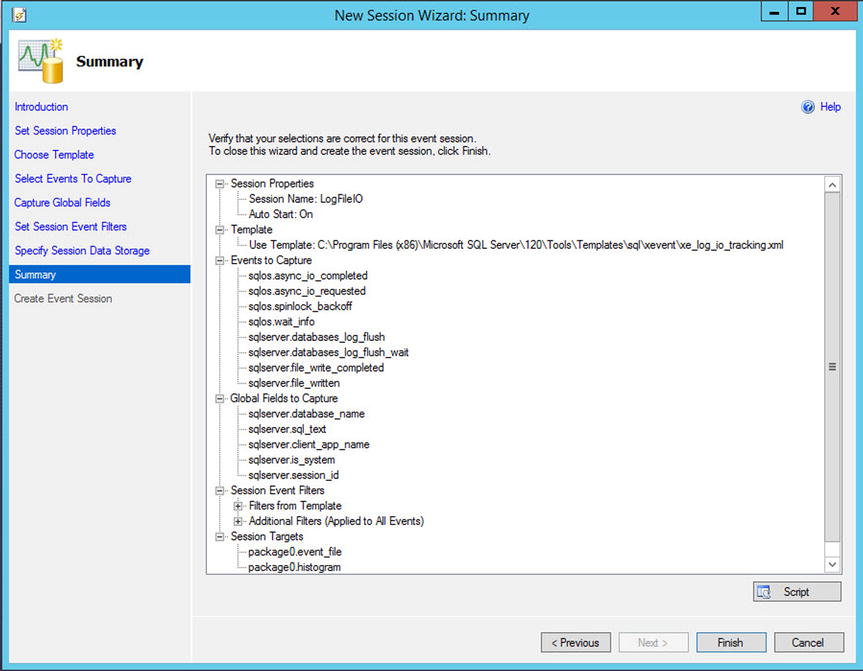
Figure 19-7. TheSummary page
Finally, the Create Event Session page informs us of the status of the Event Session creation (see Figure 19-8). On this page, we specify whether we want the session to start immediately, and if we select this option, we are also given the opportunity of immediately launching the live data viewer, which we discuss later in this chapter.

Figure 19-8. The Create Event Session page
Using the New Session Dialog Box
You can access the New Session dialog box from SQL Server Management Studio by first drilling through Management | Extended Events in Object Explorer, and then by selecting New Session from the Sessions context menu. We use the New Session dialog box to create a session that monitors page splits and correlates them with the stored procedures that caused them to occur. To allow this, we need to enable causality tracking, which gives each event an additional GUID value, called an ActivityID, and a sequence number; together, these allow the events to be correlated.
When you invoke the dialog box, the General page displays, as illustrated in Figure 19-9. On this page, you can specify a name for the session, choose whether or not it should start automatically after it is completed and automatically when the instance starts, whether the live data view launches after the session completes, and if causality tracking should be enabled.

Figure 19-9. The General page
Because we are going to monitor page splits, we name the session PageSplits and specify that the session should start automatically, both after creation and also when the instance starts. We also turn on causality tracking.
On the Events page, we first search for and select the page_splits and module_start events, as shown in Figure 19-10. The module_start event is triggered every time a programmable object fires.

Figure 19-10. The Events page
We now need to use the Configure button to configure each of the events. In the Global Fields (Actions) tab of the Configure screen, we select the nt_username and database_name actions for the module_start event, as illustrated in Figure 19-11.

Figure 19-11. The Global Fields (Actions) tab
![]() Tip If you need to configure the same actions for multiple events, you can multiselect the events.
Tip If you need to configure the same actions for multiple events, you can multiselect the events.
On the Filter (Predicates) tab, we configure the page_splits event to be filtered on the database_name, which is Chapter19 in this case, as show in Figure 19-12. This means that only page splits relating to this database are captured. We do not filter the module_start event on the database_name, because the procedure that caused the page splits could, in theory, have been fired from any database.

Figure 19-12. The Filter (Predicates) tab
In the Event Fields tab of the Configure screen, the fields that relate to the event are displayed. If there are any optional fields, then we are able to select them. Figure 19-13 shows that we have selected the statement field for the module_start event.

Figure 19-13. The Event Fields tab
On the Data Storage page of the New Session dialog box, we configure the target(s). For our scenario, we configure a single event file target, as demonstrated in Figure 19-14. The parameters are context sensitive, depending on the type of target that you select. Because we have selected a file target, we need to configure the location and maximum size of the file. We also need to specify if we want new files to be created if the initial file becomes full, and if so, how many times this should happen.

Figure 19-14. The Data Storage page
On the Advanced page, shown in Figure 19-15, we can specify the desired behavior in the event of memory pressure: whether single-event loss is acceptable, whether multiple-event loss is acceptable, or whether there should be no event loss at all. We can also set the minimum and maximum size for events and how memory partitioning should be applied. This is discussed in more detail in the following section. Additionally, we can configure dispatch latency. This indicates the maximum amount of time that an event remains in the buffers before it is flushed to disk.
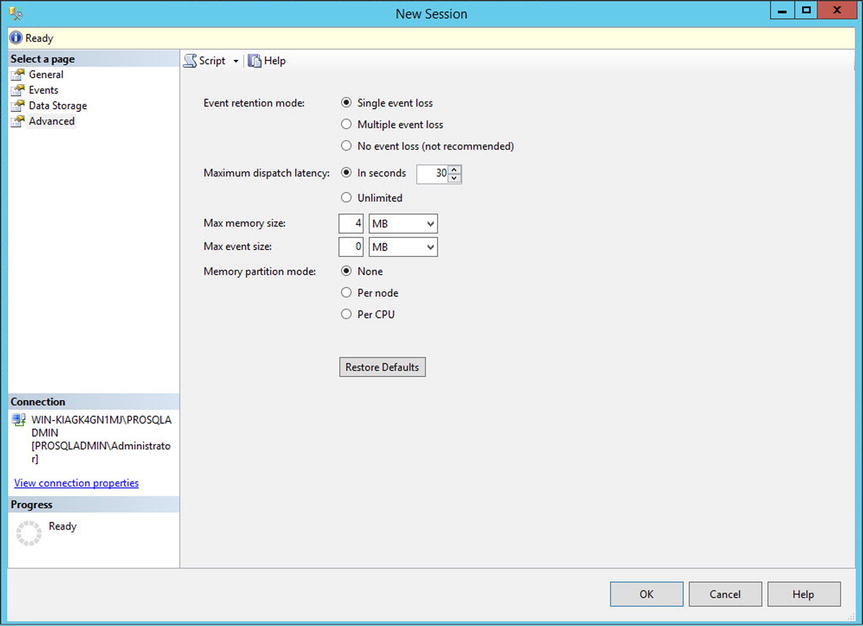
Figure 19-15. The Advanced tab
You can also create event sessions via T-SQL using the CREATE EVENT SESSION DDL statement. The command accepts the arguments detailed in Table 19-4.
Table 19-4. Create Event Session Arguments
|
Argument |
Description |
|---|---|
|
event_session_name |
The name of the event session that you are creating. |
|
ADD EVENT | SET |
Specified for every event that is added to the session, followed by the name of the event, in the format package.event. You can use the SET statement to set event-specific customizations, such as including non-mandatory event fields. |
|
ACTION |
Specified after each ADD EVENT argument if global fields should be captured for that event. |
|
WHERE |
Specified after each ADD EVENT argument if the event should be filtered. |
|
ADD TARGET | SET |
Specified for each target that will be added to the session. You can use the SET statement to populate target-specific parameters, such as the filename parameter for the event_file target. |
The statement also accepts the WITH options, detailed in Table 19-5. The WITH statement is specified once, at the end of the CREATE EVENT SESSION statement.
Table 19-5. Create Event Session WITH Options
|
Option |
Description |
|---|---|
|
MAX_MEMORY |
The maximum amount of memory that the event session can use for buffering events before dispatching them to the target(s). |
|
EVENT_RETENTION_MODE |
Specifies the behavior if the buffers become full. Acceptable values are ALLOW_SINGLE_EVENT_LOSS, which indicates that a single event can be can be dropped if all buffers are full; ALLOW_MULTIPLE_EVENT_LOSS, which indicates that an entire buffer can be dropped if all buffers are full; and NO_EVENT_LOSS, which indicates that tasks that cause events to fire are to wait until there is space in the buffer. |
|
MAX_DISPATCH_LATENCY |
The maximum amount of time that events can reside in the sessions buffers before being flushed to the target(s), specified in seconds. |
|
MAX_EVENT_SIZE |
The maximum possible size for event data from any single event. It can be specified in kilobytes or megabytes and should only be configured to allow events that are larger than the MAX_MEMORY setting. |
|
MEMORY_PARTITION_MODE |
Specifies where vent buffers are created. Acceptable values are NONE, which indicates that the buffers will be created within the instance; PER_NODE, which indicates that the buffers will be created for each NUMA node; and PER_CPU, which means that buffers will be created for each CPU. |
|
TRACK_CAUSALITY |
Specifies that an additional GUID and sequence number will be stored with each event so that events can be correlated. |
|
STARTUP_STATE |
Specifies if the session automatically starts when the instance starts. ON indicates it does, OFF indicates it does not. |
![]() Caution Using the NO_EVENT_LOSS option for EVENT_RETENTION_MODE can cause performance issues on your instance, because tasks may have to wait to complete until there is space in the event session’s buffers to hold the event data.
Caution Using the NO_EVENT_LOSS option for EVENT_RETENTION_MODE can cause performance issues on your instance, because tasks may have to wait to complete until there is space in the event session’s buffers to hold the event data.
The script in Listing 19-4 demonstrates how you can use T-SQL to create the PageSplits session that we created in the previous section.
Viewing the Collected Data
SQL Server provides a data viewer that you can use for basic analysis of event data from a file or live data from the buffers. For more complex analysis, however, you can access and manipulate the event data via T-SQL. The following sections discuss each of these methods of analysis.
Analyzing Data with Data Viewer
You can use the data viewer to watch live data as it hits the buffers by drilling through Management | Extended Events | Sessions in Object Explorer and selecting Watch Live Data from the Session context menu. Alternatively, you can use it to view data in the target by drilling through the session and selecting View Target Data from the Target context menu.
![]() Tip The data viewer does not support the ring buffer or ETW target types.
Tip The data viewer does not support the ring buffer or ETW target types.
The script in Listing 19-5 inserts data into the Customers table in the Chapter19 database, which causes IO activity for the transaction log, which is captured by our LogFileIO session.
If we now open the data viewer for the event_file target under the LogFileIO session in Object Explorer, we see the results illustrated in Figure 19-16. The viewer shows each event and timestamp in a grid; selecting an event exposes the Details pane for that event.

Figure 19-16. Data view on event_file target
Notice that a data viewer toolbar is displayed in SQL Server Management Studio, as illustrated in Figure 19-17. You can use this toolbar to add or remove columns from the grid, as well as to perform grouping and aggregation operations.
![]()
Figure 19-17. Data viewer toolbar
Clicking the Choose Columns button invokes the Choose Columns dialog box. We use this dialog box to add the duration and wait_type columns to the grid, as shown in Figure 19-18.

Figure 19-18. The Choose Columns dialog box
We can now use the Grouping button to invoke the Grouping dialog box. In this dialog box, we choose to group the events by their name, as shown in Figure 19-19.

Figure 19-19. Grouping dialog box
We can now use the Aggregation button to invoke the Aggregation dialog box. We can use this dialog box to apply aggregate functions, such as SUN, AVG, or COUNT to the data. It is also possible to sort the data by an aggregated value. Figure 19-20 shows that we are using this dialog box to add a SUM of the wait durations.
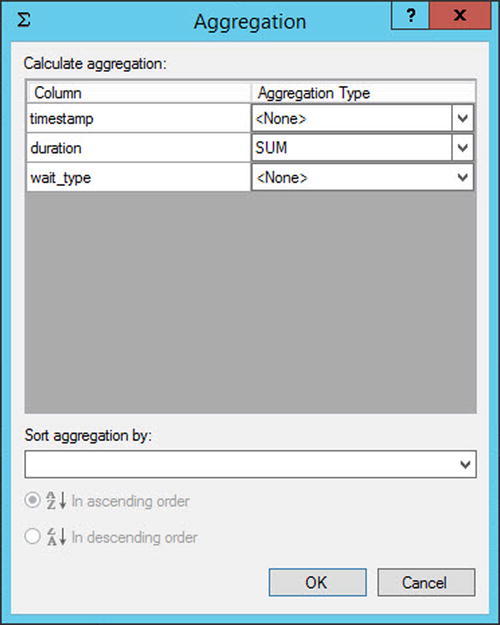
Figure 19-20. The Aggregation dialog box
In the data viewer grid, we are now able to see a SUM of the duration column for the wait_info events, and if we expand this group, it displays the granular details, as shown in Figure 19-21. We see N/A as the subtotal for groups, which do not have a duration field.

Figure 19-21. The Data viewer grid
If you require more complex analysis of the data, then you can achieve this via T-SQL. The sys.fn_xe_file_target_read_file function makes this possible by reading the target file and returning one row per event in XML format. The sys.fn_xe_file_target_read_file accepts the parameters detailed in Table 19-6.
Table 19-6. sys.fn_xe_file_target_read_file Parameters
|
Parameter |
Description |
|---|---|
|
path |
The file path and file name of the .XEL file. This can contain the * wildcard so that rollover files can be included. |
|
mdpath |
The file path and name of the metadata file. This is not required for SQL Server 2012 and above but is for backward compatibility only, so you should always pass NULL. |
|
initial_file_name |
The first file in the path to read. If this parameter is not NULL, then you must also specify initial_offset. |
|
initial_offset |
Specifies the last offset that was read so that all events prior are skipped. If specified, then you must also specify initial_file_name. |
The sys.fn_xe_file_target_read_file procedure returns the columns detailed in Table 19-7.
Table 19-7. sys.fn_xe_file_target_read_file Results
|
Column |
Description |
|---|---|
|
module_guid |
The GUID of the module that contains the package |
|
package_guid |
The GUID of the package that contains the event |
|
object_name |
The name of the event |
|
event_data |
The event data, in XML format |
|
file_name |
The name of the XEL file that contains the event |
|
file_offset |
The offset of the block within the file that contains the event |
Because the event data is returned in XML format, we need to use XQuery to shred the nodes into relational data. A full description of XQuery is beyond the scope of this book, but Microsoft provides an XQuery language reference on msdn.microsoft.com.
The script in Listing 19-6 runs the UpdateCustomersWithPageSplits and UpdateCustomersWithoutPageSplits procedures in the Chapter19 database before extracting the event data using the sys.fn_xe_file_target_read_file. We then use the XQuery Value method to extract relational values from the XML results. Finally, because we have turned on causality tracking, we group the data by the correlation GUID to see how many page splits each stored procedure caused. UpdateWithoutPageSplits provides a contrast.
![]() Tip Remember to update filepaths to match your own configuration before running the query.
Tip Remember to update filepaths to match your own configuration before running the query.
![]() Tip Using XQuery allows you to query on every event field and action that is captured within your trace, so you can create very complex queries, providing rich and powerful analysis of the activity within your instance.
Tip Using XQuery allows you to query on every event field and action that is captured within your trace, so you can create very complex queries, providing rich and powerful analysis of the activity within your instance.
Correlating Extended Events with Operating System Data
Extended Events offer the capability to integrate with operating system–level data. The following sections discuss how to correlate SQL Server events with Perfmon data and other operating system–level events.
Correlating Events with Perfmon Data
Before Extended Events were introduced, DBAs used a tool called SQL Trace and its GUI, Profiler, to capture traces from SQL Server; it was possible to correlate this data with data from Perfmon. With Extended Events, you do not often need to make this correlation, because Extended Events include Perfmon counters for processor, logical disk, and system performance objects, such as context switches and file writes. Therefore, you can correlate SQL Server events with operating system counters by adding these objects to the session and by following the T-SQL analysis techniques discussed in the previous section.
![]() Tip Perfmon counters are in the Analytic channel but have no category.
Tip Perfmon counters are in the Analytic channel but have no category.
The script in Listing 19-7 demonstrates creating an event session that captures statements executed within the instance, alongside processor counters. Processor counters are captured every 15 seconds for each processor in the system. The results are saved to an event file target and an ETW target.
![]() Tip The SQL Server service account must be in the Performance Log Users group, or an error is thrown.
Tip The SQL Server service account must be in the Performance Log Users group, or an error is thrown.
Integrating Event Sessions with Operating System–Level Events
![]() Note To follow the demonstrations in this section, you need to install Windows Performance Toolkit, which you can download from msdn.microsoft.com as part of the Windows Deployment and Assessment Toolkit.
Note To follow the demonstrations in this section, you need to install Windows Performance Toolkit, which you can download from msdn.microsoft.com as part of the Windows Deployment and Assessment Toolkit.
There are instances in which you may need to integrate event session data with operating system data other than Perfmon counters that SQL Server provides. For example, imagine a scenario in which you have an application that exports SQL Server data to flat files in the operating system so that a middleware product, such as BizTalk, can pick them up. You are having trouble generating some files and you need to view the process flow—from SQL statement being run through to the WMI events being triggered in the operating system. For this, you need to merge event session data with a trace of WMI events. You can achieve this through the ETW (Event Tracking for Windows) architecture.
To demonstrate this, we first create an event trace session in Performance Monitor using the WMI provider, and then we integrate it with the event session that we created in the previous section. (You can find Performance Monitor in Administrative Tools in Windows.) After we open Performance Monitor, we select New | Data Collector Set from the Event Trace Sessions context menu, which causes the Create New Data Collector Set wizard to be invoked. On the first page of the wizard, specify a name for the Collector Set, as illustrated in Figure 19-22, and specify if the Data Collector set should be configured manually or based on a template. In our scenario, we choose to configure it manually.

Figure 19-22. The Create New Data Collector Set wizard
On the page for enabling event trace providers, we can use the Add button to add the WMI-Activity provider, as illustrated in Figure 19-23.

Figure 19-23. Add the WMI Provider
We now use the Edit button to invoke the Properties dialog box. Here, we add the Trace and Operational categories by using the check boxes, as shown in Figure 19-24.

Figure 19-24. Properties dialog box
After exiting the Properties dialog box, we move to the next page of the wizard, where we can configure the location where the trace file is stored. We configure the trace file to be saved to the same location as our event session trace, as shown in Figure 19-25.

Figure 19-25. Configure the trace file location
On the final page of the wizard, illustrated in Figure 19-26, we leave the default options of running the trace under the default account and then save and close the trace.

Figure 19-26. Save the trace
In Performance Monitor, our trace is now visible in the Event Trace Sessions folder, but showing as stopped. We can use the context menu of the trace to start the Data Collector Set, as shown in Figure 19-27. Also notice that there is a Data Collector Set called XE_DEFAULT_ETW_SESSION. Our extended event session created this because we created an ETW target. This session is required for integrating the data.

Figure 19-27. Start the Data Collector Set
Now that both the WMISession and Statements_with_Perf_Counters sessions are started, we use the BCP command in Listing 19-8 to generate activity, which causes events to fire in both sessions.
We now need to ensure that the buffers of both sessions are flushed to disk. We do this by stopping both sessions. After stopping the Statements_with_Perf_Counters session, we also need to stop the XE_DEFAULT_ETW_SESSION ETW session in Performance Monitor. You can stop the Statements_with_Perf_Counters session by using the T-SQL command in Listing 19-9.
You can stop the WMISession and XE_DEFAULT_ETW_SESSION by selecting Stop from their respective context menus in Performance Monitor.
The next step is to merge the two trace files together. You can achieve this from the command line by using the XPERF utility with the -Merge switch (demonstrated in Listing 19-10). This command merges the files together, with StatementsWithPerfCounters.etl being the target file. You should navigate to the C:Program Files (x86)Windows Kits8.1Windows Performance Toolkit folder, before running the script.
Now that all events are in the same file, you can open and analyze this .etl file with Windows Performance Analyzer, which is available as part of the Windows Performance Toolkit, as shown in Figure 19-28. Once installed, you can access Windows Performance Analyzer via the Windows Start menu. A full discussion of Windows Performance Analyzer is beyond the scope of this book, but you can find it in Administrative Tools in Windows after it’s installed. You will find full documentation on msdn.microsoft.com.

Figure 19-28. Windows Performance Analyzer
Summary
Extended Events introduce new concepts that you must understand in order to fully harness their power. Events are points of interest that are captured in a trace, whereas actions provide extended information, in addition to the event columns. Predicates allow you to filter events in order to provide a more targeted trace, and targets define how the data is stored. A session is the trace object itself, and it can be configured to include multiple events, actions, predicates, and targets.
You can create an event session through the New Session Wizard, an easy and quick method that exposes Templates; via the New Session dialog box; or of course, via T-SQL. When creating a session via T-SQL, you use the CREATE EVENT SESSION DDL statement to configure all aspects of the trace.
Each Extended Event artifact is contained within one of four packages: Package0, Sqlserver, Sqlos, and SecAudit. The contents of SecAudit are not exposed, however, since these are used internally to support SQL Audit functionality, which is discussed in Chapter 9.
You can view data using the data viewer. The data viewer allows you to watch live data in the session’s buffers, and it also supports viewing target data from the Event File, Event Count, and Histogram Target types. The data viewer provides basic data analysis capability, including grouping and aggregating data.
For more complex data analysis, you can open targets in T-SQL. To open an Event File target, use the sys. fn_xe_file_target_read_file results system stored procedure. You then have the power of T-SQL at your disposal for complex analysis requirements.
You can correlate events by turning on causality tracking within the session. This adds a GUID and a sequence number to each event so that you can identify relationships. You can also easily correlate SQL events with Perfmon data, because Extended Events expose processor, logical disk, and system performance counters. To correlate events with other operating system–level events, event sessions can use the ETW target, which you can then merge with other data collector sets to map Extended Events to events from other providers in the ETW architecture.