
CHAPTER 13
Estimating Probabilities
Estimating probabilities in project management can be done either subjectively or by using a relative frequency approach based on historical data. Subjective assessment of probabilities can be affected by a number of cognitive biases, such as wishful thinking and overestimation of the probabilities of compound events. A number of methods can be used to make judgments about probabilities. Qualitative risk analysis helps prioritize risks, based on their probability and impact.
Approaches to Estimating Probabilities
Wrong estimations of probabilities can lead to major project problems, including failure. During the decision-framing phase (the first phase of the decision analysis process), you identified possible risks and uncertainties. Now you have to define the probabilities that these risks will occur. The probabilities of project risks become part of the project modeling (the second phase of decision analysis) that will be used in the subsequent quantitative analysis (the third phase).
The two approaches to estimating probabilities are:
1. The relative frequency approach, where probability equals the number of occurrences of a specific outcome (or event) divided by the total number of possible outcomes. This calculation can be based on either historical data or measurements of actual project performance. For example, if nine of the last 10 plays of a particular director were canceled after the first performance, it is easy to calculate that the director’s probability of success equals 10%, one out of every 10 shows.
2. The subjective approach, which represents an expert’s degree of belief that a particular outcome will occur. For example, will a new Broadway show be successful? It is hard to tell and depends on many factors. Ultimately, it is a subjective judgment of a decision-maker who is willing to bet on the success of the play.
Many people believe that subjective judgments about probabilities are inaccurate. Wharton professor Philip Tetlock showed that in general, experts’ predictions are only slightly better than chance (Tetlock and Gardner 2015). However, people can deliver quite accurate assessments if certain techniques and tools for elicitation of judgment are used and if the negative effects of cognitive and motivational biases are mitigated.
Subjective Estimation of Probabilities
One of the funniest, but most instructive, stories about a failed project is the movie and later musical The Producers. In it, Leo Bloom and Max Bialystock decide to produce a play, called Springtime for Hitler, that would be in such bad taste that it would turn off the public and quickly fail, allowing them to pocket their investors’ money. Not only is the subject matter distasteful, but to make sure their trick works, they hire the worst possible director and the worst cast and engage in some additional skullduggery to undermine the play. In spite of all their efforts, the first performance is a huge success, the scheme is uncovered, and Leo and Max end up in jail. In short, they didn’t do a very good job of estimating probabilities.
The problem was that Leo and Max fell victim to the same psychological bias that has laid low many project managers before them. They were overconfident, which led them to overestimate the probability of their project failure (failure in this “anti-project” being the show’s success). As a result, they had no contingency plans. In fact, they spent almost all their money before the first performance.
The insurance industry, for one, uses advanced risk-analysis methods and techniques (Simons 2006) to evaluate its exposure to large payouts. Yet recently it has also had to rely on the subjective estimations of experts in predicting what the weather will be in the future. Insurance companies world wide are trying to adapt to a new reality: climate change. The industry agrees that there has been a recent shift in weather patterns. As shown in figure 13-1, insurance losses averaged over a few years constantly grew and significantly fluctuate year over year (Statista 2018). The success of an insurance company depends on its correct assessment of the probability of certain events, be they automobile accidents, house fires, hurricanes, or even an injury to a high-priced (and highly insured) athlete. So, how does the company estimate the probability of weather disasters?
The insurance industry uses complex mathematical catastrophe models to analyze historical weather data, particularly information about the paths and intensities of future hurricanes. Companies try to calculate the potential damage that could be inflicted on different buildings, depending on the buildings’ location, age, and structure. Until recently, the models worked quite well. But the recent surge in weather activity means that insurance companies cannot rely solely on historical data. In response, they have turned to expert judgment. Today, insurance companies commission the services of leading climatologists to come up with these judgments. What do they foresee? Apparently, the weather will not get any better over the next few years, meaning that insurance payout fluctuation will increase.
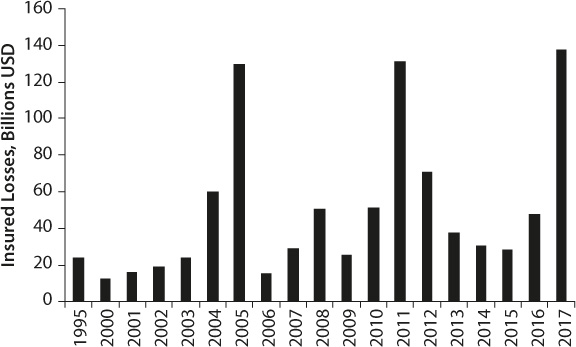
Figure 13-1. Insured losses caused by natural disasters worldwide from 1995 to 2017 (in billion U.S. dollars)
Most uncertainties in project management are related to our lack of knowledge about the future. For these uncertainties, historical data and actual project measurements may be insufficient to come up with probabilities. For example, what is the chance that someday a hurricane will hit New York City? Or, what is the chance that a requirement will change as you are creating a brand-new type of product? In these cases, we have to use a subjective assessment of probabilities, either alone or in combination with the relative frequency approach.
How We Subjectively Assess Probability and Risk
Many people seem concerned about the avian flu and other exotic infections that have yet to kill anyone in the United States. At the same time, the Centers for Disease Control estimates that the more common influenza strains have resulted in between 9.3 million and 49.0 million illnesses, between 140,000 and 960,000 hospitalizations, and between 12,000 and 79,000 deaths annually since 2010 (CDC 2018). After the attacks on September 11, 2001, many people refused to fly and chose instead to drive whenever possible. As a result, from October 2001 to December 2001 a thousand more traffic fatalities occurred than in the same period the year before. This is an example of how we tend to misjudge risks and make wrong assessments of probabilities due to the inherent cognitive and motivational biases that we discussed in chapter 2. (See appendix B for a list of heuristics and biases related to peoples’s assessment of probabilities.) For example, because of biases related to the availability heuristic (people’s having ready access through the media to vivid images of airline crashes), many folks believe that flying is far riskier than driving a car. In truth, at most a few hundred people are killed in commercial airline crashes each a year in the United States, compared to some 44,000 in motor vehicle accidents.
Factors that can significantly affect our estimation of risk include:
• Wishful thinking: This occurs when we overestimate the probabilities of opportunities and underestimate the probabilities of risks.
• Overestimating the probability of compound events: If the probability of a defect in a component is 20% and the device uses three redundant components, the probability of the defective device will be (0.2 × 0.2 × 0.2) = 0.008%. People tend to think this number is much higher.
• Ignoring base-rate frequencies (probabilities of prior events): Here is a question for you. Historically, the probability that a particular component will be defective is 1%. The component is tested before installation. The test successfully identifies defective components 80% of the time. Your test indicates that a particular component is defective. What is the probability that other components are also defective? The correct answer is close to 4%. However, most people would think that answer is a little bit lower than 80%. Actual calculation can be done using the Bayesian theorem (Plous 1993).
Psychologists and neuroscientists have discovered that we (and other animals) have developed a special mechanism to deal with risks (Ledoux 2015). In the event of danger, groups of neurons located above the brain stem pump stress hormones into the bloodstream. This happens in a fraction of a second. The result is that we experience emotions—in particular, fear—in cases of danger. Because of this primal mechanism, in cases of risk, people tend to rely on intuitive (emotional) responses rather than on analysis. While this effect is felt most acutely in those cases where we face imminent peril, it also can affect us in the face of the more abstract, less life-threatening risks that we encounter during the course of a project.
Getting back to our play example, after the successful performance of Springtime for Hitler, its playwright, Franz Liebkind, pointed a gun at Leo Bloom and Max Bialystock and threatened to kill them for bastardizing his drama. Under threat of imminent death, Leo and Max’s limbic systems kicked in, and while pleading for their lives they suggested that Franz kill the actresses instead. This is an example of how our emotions can cause poor judgment. Later, when the situation had calmed down somewhat and the first suggestion was rejected, they suggested that blowing up the theater would be a more appropriate act of revenge for Franz. Still, their choices were quite irrational and emotion driven: the possibility of being caught and spending a lengthy period in prison would increase dramatically if Franz were to take them up on either suggestion. (In case you are wondering, this is not a recommendation to blow up your office or perform other rash acts in the case of a project failure.)
Scientists believe that the mechanism behind our reaction to imminent risks was hardwired into our brains in prehistoric times, when “primitive” people were more concerned about judging the dangers posed by predators and other dangers than making complex multicriteria decisions. Today, project managers face a relatively small chance of being eaten by a predator, but they will still react emotionally to information related to their projects: whether deadlines are missed or not missed, whether the product works well or does not work at all, and so on. Together with heuristics and biases, emotional responses to risks and uncertainties affect our perception of risk and, in turn, our estimation of probabilities. Moreover, emotions can also affect our overall risk preferences or risk attitudes (Hill-son and Murray-Webster 2007). Emotion is one of the important factors that contribute to the shape of the utility function, as shown in figure 4-3 in chapter 4.
Emotions affect not only our ability to assess risks and opportunities. Many small businesses close their doors because their owners emotionally cannot cope with losses, even though they technically have the financial resources to continue doing business. They overestimate short-term opportunities (the short-term probability of success) and underestimate long-term opportunities.
Methods of Eliciting Subjective Judgments in Project Management
Psychologists and decision scientists have developed a number of methods that can help elicit subjective judgments about probabilities. A project manager can benefit by calling in specialists to help. But before you start asking your experts about probabilities, you need to have the following:
1. A clearly defined problem, which was developed during the decision-framing phase of the decision analysis process.
2. Either an identified list of risks or a risk breakdown structure for the project.
3. A project model (for example, a project schedule).
4. A clearly defined set of questions you will ask the experts, to elicit their judgment concerning probabilities.
In addition, your experts should be prepared in the manner discussed in chapter 8. This will ensure that the project team is aware of any personal interests the experts may have regarding particular issues.
But how do you frame questions to elicit an accurate assessment from an expert? You can use a number of methods:
1. Ask for a specific assessment of an event’s probability. Pose a direct question: “What is the probability that the project will be canceled due to budgetary problems?” In many cases, experts will be reluctant to answer this question if they feel they may not have sufficient information.
2. Ask the experts two opposing questions: (a) “What is the probability that the project will be canceled?” and (b) “What is the probability the project will be completed?” The sum of these two assessments should be 100%. In other words, say 40% for the first question, 60% for the second. This method is called a coherence check, and it helps experts to adjust their judgment.
3. Use a probability wheel, a diagram that looks like a pie chart (figure 13-2). Each area of the pie chart is associated with the probability of a certain outcome. Imagine that you spin the wheel as it is done on the Wheel of Fortune TV game show. The larger the area, the greater the chance that the wheel will stop on this area. The experts can adjust these areas until they are in agreement with the specific probabilities. Basically, the probability wheel helps in visualizing the probabilities and performing a coherence check. This is like preferring an analog car speedometer to a digital speedometer; the former is a better instrument for visualizing speed.
Different methods for estimating probabilities will often deliver different results for the same project. What should you do in these cases? While decision science does not give a definite answer to this question, one way to reconcile answers from several experts is to invite another expert. You may also arrange a discussion between experts. Our preferred method to deal with this problem is to further break down the problem. Break compound events into simple events and review them separately. For example, instead of asking a single question about the probability that the project will be canceled due to budgetary problems, you may ask two questions:
1. What it is the chance that a budgetary problem will occur?
2. What is the chance that the budgetary problem will lead to a project cancelation?

Figure 13-2. Probability Wheel
Uncertainties in duration and cost of activities, as well as other uncertainties in project parameters, can be defined by using continuous probabilities or statistical distributions. Uncertainties should be quantified in the modeling phase of the project. We will cover the assessment of continuous probabilities in chapter 16.
What If a Decision Is Sensitive to Probability?
Maj. Ernest Y. Wong and Lt. Col. Rod Roederer of the US Military Academy (2006) used decision theory to review the US government’s decision to attack Iraq in 2003. They hypothetically assumed that the decision to attack that country was based on only one criterion: the existence of a stockpile of weapons of mass destruction (referred to as WMD). Using the analytic methods we have discussed, they demonstrated that the outcome of the decision to attack Iraq was highly sensitive to the range of uncertainty surrounding the assessments of whether Iraq actually had WMD at the time.
If probability is greater than a certain breakeven number (say, 75%), the decision may be correct, and vice versa. However, if the probability is expressed as a range (from 60% to 90%), and if the breakeven point is within this range, it is very hard to tell what course of actions should be taken. Often, estimation of probabilities will affect the decision dramatically. If probability is assessed subjectively, inaccuracy can be even greater. The solution in this case should be to try to improve the quality of probability estimates: so, ask more experts to express their options, have additional discussions, try to obtain more data, and use more advanced techniques to elicit judgment. If the decision to attack Iraq had hinged on the assessments regarding its possession of WMD, the decision makers should have made every effort to minimize the uncertainties associated with the assessments.
Qualitative Risk Analysis
When we determine the probability of events, we can use it as part of a qualitative risk analysis. The PMBOK Guide defines qualitative risk analysis as “a process of prioritizing risks for subsequent further analysis or action by assessing and combining their probabilities and impact.” The idea is to prioritize risks based on probability, impact on project objectives, time frame, when the risk may occur, and risk tolerance.
One of most exciting recent space missions, the New Horizon, is supposed to explore Pluto and a region of the outer solar system called the Kuiper Belt. The New Horizon was launched on January 19, 2006, and it reached the planet in July 2015 (figure 13-3). The spacecraft contained 24 pounds of plutonium, intended for use as power generation. NASA estimated that there was a 1 in 1.4 million to 1 in 18 million chance that an extremely unlikely launch area accident could release up to 2% of the plutonium.

Figure 13-3. The Atlas V Rocket with New Horizon Liftoff from Cape Canaveral, September 24, 2005 (Credit: NASA/Kim Shiflett, 2006)
Karl Grossman, however, did not agree with NASA’s interpretation of the risk. “If it’s 2 percent or it’s 6 percent or if it’s 20 percent or if it’s 100 percent, when you are talking about plutonium, you are talking about the most radioactive substance known” (Grossman 1997). Fortunately, the New Horizon was launched successfully without incident; however, the controversy over using nuclear energy for space missions continues.
The issue here is that it is not sufficient to simply determine the probability of risks. We must also quantify the impact of those risks. The combination of probability and impact will give us an input necessary to make a decision. Quantitative and qualitative risk analysis can be used to analyze the combined probability and impact of the risk. Interpretation of the results depends on personal or organizational preferences—risk attitude and risk tolerance, both part of the decision policy we discussed in chapter 4. Apparently, Karl Grossman has much lower risk tolerance than NASA itself.
In many projects, especially smaller ones, a quantitative risk analysis is not required to determine which risks are most important. It is enough to know their probability of occurrence and impact on project objectives, such as time, cost, scope, and so on. Negative impacts are considered threats; positive impacts are opportunities. When you assess both probabilities and impacts, you may use a probability and impact matrix to prioritize the risks (figure 13-4). Black areas represent high risks that have first priority for mitigation or avoidance. White areas represent low risks. Organizations define the classifications of high and low risks based on risk preferences: the more risk-averse an organization is, the more black areas the matrix will have.
In The Producers, Leo and Max properly estimated the impact for the “show success” risk, but underestimated its probability. Moreover, as with most criminals, they were risk-takers. If they had constructed a probability and impact matrix, their high-risk area would have been quite small. The risk “show success” probably would have found itself in the gray or even the white area, instead of the black area. If they had correctly judged the importance of the risk, they probably would have been more prepared for the eventuality that the show might succeed, rather than completely ignoring it, which led to their downfall.
Here is another consideration: Gene Gigerenzer (Gigerenzer 2015) promotes the concept of statistical thinking. The problem, he asserts, is the illusion of certainty. We believe in certain information related to risks—for example, medical tests. However, in reality these test results are uncertain predictors of eventual health problems. To solve this problem, statistical analysis must be performed and the results of analysis must be properly framed, defined, and communicated.
Modern quantitative analysis techniques—for example, Event chain methodology—can automatically prioritize risks by using sensitivity analysis, which is a relatively easy process as long as you have both a project schedule and a risk breakdown structure. However, the probability and impact matrix remains a useful tool, especially in situations where you want to prioritize risks, such as quality, reliability, and safety, that are not directly related to the project schedule.
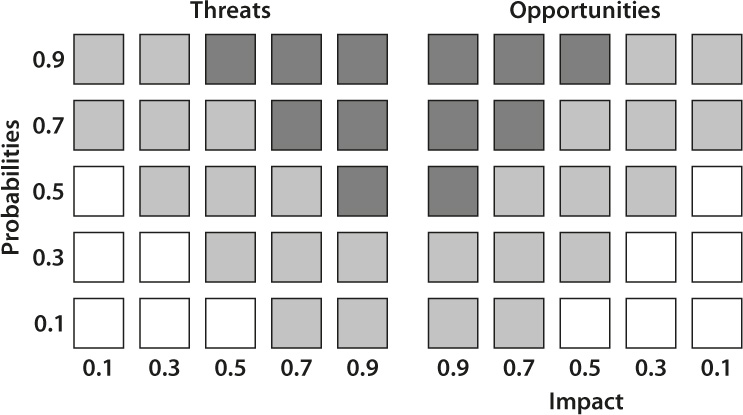
Figure 13-4. Probability and Impact Matrix
As we discussed in chapter 10, a risk register contains all the information about risks, such as name, description, category, cause, responses, owner, current status, and so on. When we know the probability and impact of a risk, we can save it in the risk register, as well.