
APPENDIX Inferential Statistics
Chapter 7 described a range of evaluation goals and methods that are commonly used in usability engineering. However, while we discussed the major concepts of experimental design—for example, the concepts of variables, hypotheses, and validity—we did not present the methods or techniques of inferential statistics. These methods are required when evaluators wish to claim that the results they have obtained are due to the conditions of the experiment rather than chance variation.
There are many statistical tests that can be used to assess the significance of the patterns observed in usability outcomes. Some common tests are listed in Table A.1, along with sample questions they might be used to answer. For example, a t-test compares two independent data sets to see if their means are different, whereas analysis of variance (ANOVA) compares mean differences for the case of multiple independent variables (each of which may have two or more levels). In linear regression, a mathematical equation is constructed to show whether and to what extent each independent variable contributes to the prediction of a dependent variable.
Table A.1 Statistical tests commonly used in summative evaluation activities.
| Statistical Test | Illustrative Usability Evaluation Question |
| Single sample t-test | Is users’ average time to perform a task different than a published or accepted baseline value for similar systems? |
| Two-sample t-test | Are times to issue commands for a user interface with on-screen buttons faster than another with pull-down menus? |
| Analysis of variance (ANOVA) | Are there differences in performance time for multiple versions of a user interface (e.g., on-screen buttons, pull-down menus, and gesture recognition)? |
| Correlation or linear regression | Do the performance benefits of a direct-manipulation user interface depend on the task complexity? |
| How much do individual differences in visual acuity influence performance time? | |
| After age is removed as a covariate, are there differences in performance time for two versions of a user interface? | |
| Mann-Whitney | Is user satisfaction (measured on a 7-point rating scale) different for the user groups who worked with two different prototypes? |
| Wilcoxon U | Are users more satisfied (as measured by a 7-point rating scale) with one user interface prototype than a second one (i.e., after using both)? |
| Sign test | When users are asked to choose between two prototypes, do they choose one more frequently than chance alone would predict? |
| Chi square (X2) | Is body posture (rated rigid, normal, or relaxed by expert judges) affected by the use of natural language prompts in a user interface? |
The result of a statistical test is usually reported with respect to its “significance”—the probability that an observed difference or relationship is the result of chance variation. The lower the probability figure, the more confident an evaluator can be that the observed effect is genuine. By convention, researchers use a probability level of 0.05 as a cut-off for reporting that an effect is statistically significant (this cut-off point is called the alpha level). A simple way to think about a probability level is in terms of faulty conclusions: If a finding is reported as significant at the 0.05 level, then the experimenters are stating that the chance they are wrong is no more than 5 out of 100.
Statistical tests vary in how well they can detect differences. The most powerful are parametric statistics, which are used to analyze continuous variables with a normal distribution (the familiar bell-shaped curve). A normal distribution has a single measure of central tendency (i.e., the mean, mode, and median are the same); most observations are clustered symmetrically around the mean (Figure A.1).
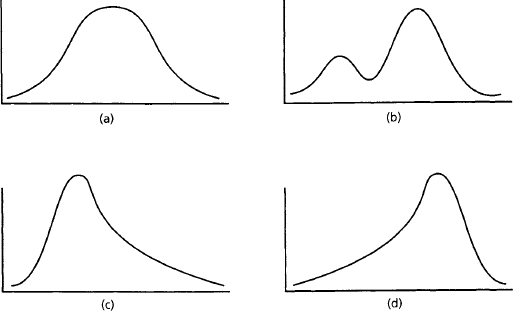
Figure A.1 Different data distributions: (a) is a normal distribution; (b) is bimodal; (c) is skewed positively, and (d) is skewed negatively.
Unfortunately, data collected in usability tests are not always normally distributed (Figure A.1). Measures with a natural lower bound (e.g., user response times) are often skewed around the low end; measures with a natural upper bound (e.g., percentage correct on a memory test) may be skewed in the opposite direction. It is also possible to observe bimodal distributions in a data set—for example, when a user characteristic such as gender influences system interactions.
Data sets that do not follow a normal distribution should be analyzed with nonparametric statistical procedures, which make few assumptions about the underlying data distribution. These tests are usually based on the ranks of the data (i.e., each number is converted to its ordinal position). As a result, nonparametric statistics are also very useful for measures that are inherently ordinal (e.g., a rating scale) or for qualitative data that have been coded using an ordinal scheme (e.g., energy level). The Mann-Whitney test and the Wilcoxon U in Table A.1 are nonparametric statistics often used to test for differences in rating-scale judgments.
Categorical data (i.e., the values have no relative ordering) can be analyzed via binomial probabilities or contingency tables. For example, a sign test can determine whether the number of users who select one of two shortcut options is greater than that expected by chance. A chi-square test can be used to test similar questions for categories that have more than two possible values.
There are many textbooks and software packages covering the concepts, methods, and calculations of behavioral statistics. Richard Lowry, Professor of Psychology at Vassar College, has developed useful online resources, including an introductory online text, available at http://faculty.vassar.edu/~lowry/webtext.html; and a set of corresponding statistical software procedures, available at http://faculty.vassar.edu/~lowry/VassarStats.html. In the following, we use the science fair example to illustrate common statistical techniques applied to usability studies.
A.1 Science Fair Case Study: How to Represent Visitors?
An ongoing concern in the design of the online science fair has been the complexity of the initial view, where projects, avatars of visitors, and other objects such as message boards are arrayed on a panoramic view of the high school gymnasium. One issue concerns whether the user interface will scale up to situations in which there are more than one or two visitors and a full complement of student projects. In this brief example, we report an experiment carried out to examine this issue, where we studied the impacts of a redundant source of user information (a visitors list) as a function of the number of people present at the exhibit.
A.1.1 Experimental Design
The experiment was designed to test two independent variables: two user interface styles (avatars-only versus avatars+list) and the number of visitors in the welcome area. Group size was set at 4, 8, or 16 to cover a reasonable spectrum of sizes. The number of exhibits in the welcome area was fixed at 10.
A number of complementary dependent variables were defined (Table A.2). One concern was conversation fluency: How quickly would participants be able to respond to questions directed at them by other visitors? This variable was defined as the time between the appearance of a question directed to a participant and his or her initiation of a typed reply.
Table A.2 Dependent variables and hypotheses for the avatar experiment.
| Variable | How Measured | Hypotheses |
| Conversation | Time from when a question | Response times will be faster for the |
| fluency | appears to the initiation of a | avatars+list condition |
| typed response | ||
| Partner | Percent correct on post-test | Percent correct will be higher for users |
| recognition | identifying the users who had | in the avatars+list condition |
| been in conversation with the | ||
| participant (out of 20 names) | ||
| Satisfaction | Judgments on three 7-point | Satisfaction ratings will be lower for |
| scales measuring feelings of | the avatars+list condition | |
| awareness, directness, confusion | ||
| Conversation | Choice of yes or no response to | Participants in the avatars+list condition |
| initiative | question about conversation | will be more likely to say yes |
| initiation |
A second concern was group memory: Would participants be able to keep track of who had been part of the ongoing conversation? We measured this variable through a memory test administered at the end of the study, in which participants indicated for a list of 20 user names whether each individual had participated in the ongoing conversation (half of the people had, half had not, but all were present at one time or another).
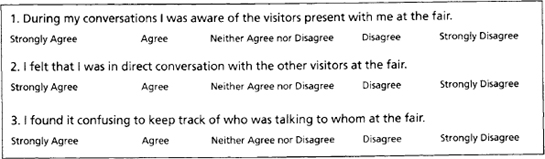
Two other dependent variables were defined to measure subjective outcomes. Three Likert scales were developed (Figure A.2). The first questioned participants’ feelings of awareness of others, the second asked whether they felt their interactions with others to be direct, and the third measured confusion about conversation partners. The final dependent variable was a simple yes-no judgment, indicating whether the user would feel comfortable initiating a conversation in the welcome area.
Hypotheses were developed for each combination of independent and dependent variables. Based on our formative evaluations, we expected that:
- Conversation fluency and memory will be improved for avatars+list. The list provides redundant information about who is there, and we expected this to aid users in keeping track of what was happening and in remembering what happened afterward.
- Subjective reactions will be more positive for the avatars alone. Although the list provides useful information, it does so by pulling attention away from the overall scene, thereby reducing levels of awareness and engagement and increasing confusion.
- Both of the above effects will vary with the size of the group. Specifically, the facilitating effects of the visitor list will be stronger for the larger group sizes, and the preference for the avatars will be stronger for the smaller group sizes.
- For the yes-no question, there will be a preference for the avatars+list, because the combination offers more options for conversation management.
Participants were randomly assigned to sample groups in a mixed design: The (visitor) group-size variable was manipulated as a repeated measure (i.e., all users were exposed to groups of all three sizes), while user interface style was between-groups (i.e., two independent groups of test users worked with the two versions of the software). A total of 24 participants were recruited, with 6 men and 6 women assigned to each group.
A. 1.2 Procedures
Participants first read and signed an informed consent form (similar to the one shown in Figure 7.6). They completed a user background survey that assessed their general computer background, their experience with virtual environments in particular, and their experience with science fairs (similar to that in Figure 7.7). Each participant then read printed instructions that described the tasks they were about to carry out: The instructions included a screen shot of the welcome area with 10 exhibits and 4 visitors. The different elements of the screen were described with reference to this screen.
The participants were told that they would be playing the role of Alicia, a community member visiting the fair for the first time. Other visitors would be arriving and leaving during her visit. Alicia’s main goal is to explore the 10 exhibits. However, the participants were also told that on occasion another visitor will direct a question to Alicia, and they should respond to these questions as quickly and accurately as possible.
The experimental trials then proceeded. Over a period of about 10 minutes, a total of 30 other visitors arrived at the fair; some moved on while others stayed and chatted. During this time, Alicia was asked to respond to three questions. The order and precise timing of the questions was determined quasi-randomly for each participant. One question appeared when 3 other people were present, one when 7 others were present, and one when 15 other visitors were in the welcome area.
The “other visitors” who arrived, chatted, and directed questions to Alicia were simulated by the computer; the questions asked were balanced for length and complexity. This control of the simulated visitors and their questions was an important feature of the experiment design. It eliminated any possible confound due to personality or conversation skill of real visitors. Response times were collected automatically; the clock was started when a question was displayed and stopped as soon as the test participant typed a character in the input area of the chat tool. Participants’ responses to the questions were recorded for later review.
Following the science fair activity, the participants first completed a user reaction questionnaire that included the three Likert scales, along with more general comments and suggestions for improvement. They then completed a memory test of conversation partners that indicated whether each of 20 names had participated in the conversation at the fair; no advance warning was given of this test.
A. 1.3 Results and Analysis
The effects of group size and user interface style on conversation fluency were assessed with a two-factor, repeated-measures ANOVA. The raw data appear in Table A.3, and the means for each test condition are graphed in Figure A.3. The ANOVA revealed a main effect of user interface style (F(1,66) = 10.68, p < 0.01), with the avatar+list interface producing faster times overall. There was also a main effect of group size, with response times increasing as the number of visitors increased (F(2,66) = 42.02, p < 0.001). However, as the graph conveys, the analysis also revealed the predicted interaction of user interface style with group size (F(2,66) = 11.12, p < 0.001). The advantage for the avatar+list interface was significant only for the largest group size.
Table A.3 Raw data for response times to answer question directed to test participants. Note that group size is a repeated measure, and user interface style is between-subjects.
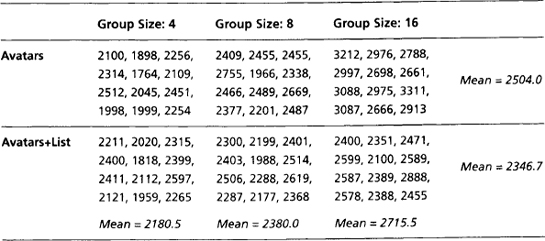

Figure A.3 Average time to respond to questions in conditions with varying numbers of other visitors and different user interface styles.
The raw data for percentage correct on the memory test appear in Table A.4. As the difference in means suggests, the participants using the avatars+list user interface were more accurate in identifying the names of visitors who had participated in the ongoing conversation. A one-tailed t-test for independent samples confirms this conclusion: t (22) = 1.78, p < 0.05.
Table A.1 Percentage correct on conversation partner identification for participants using the two user interfaces. Scores are percentage correct for 20 names.
| Avatars | 85, 70, 80, 80, 75, 90, 70, 65, 75, 90, 90, 60 | Mean = 77.5, SD = 10.44 |
| Avatars+List | 90, 75, 95, 80, 90, 95, 80, 70, 80, 95, 100, 70, 85 | Mean = 85.0, SD= 10.11 |
Participants’ responses to the rating scales appear in Table A.5, broken down by user interface style and the reaction assessed by the rating scale (see Figure A.2). Judgments have been converted to an ordinal scale (from 1 = Strongly Disagree to 5 = Strongly Agree). Note that for the third scale, the assertion was worded negatively—a lower rating reflects a more positive response. The mean differences in the answers to questions 1 and 2 are consistent with the predicted preference for avatars alone. However, the effect was reversed for the confusion scale, with participants using the avatars alone reporting a greater sense of confusion.
Table A.5 Judgments made on satisfaction rating scales; judgments have been converted to an ordinal scale (1 = Strongly Disagree to 5 = Strongly Agree).
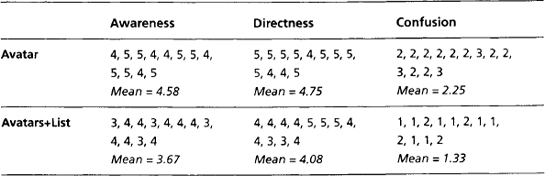
Because the rating scale data are ordinal in nature, the data were analyzed with the nonparametric Wilcoxon U statistic. The rank of each rating across the two user interface conditions was calculated for each of the three scales. The statistic calculates an estimate of what the average rank for each group would be by chance alone, and tests to see if the average rank obtained is different from the estimate. The Wilcoxon U for the avatar-only condition was 20 for the awareness scale, 33 for the directness scale, and 18 for the confusion scale. All of these differences are significant at p < 0.05.
The final analysis examined participants’ response to whether they would choose to initiate a conversation in the welcome area. Answers to this question are tabulated in Table A.6. These categorical data were analyzed with a chi-square test, which compares the observed frequency in each cell with the frequency expected by chance. The expected frequency is estimated from the margin values (e.g., the expected frequency of the upper left cell is equal to 12/24*14, or 7). This analysis revealed that there was no significant relationship between user interface style and likelihood of initiating a conversation (X2(1) = 0.38, ns).
Table A.6 Frequency of responses regarding likelihood of initiating a conversation in the welcome area of the virtual science fair.
| Would initiate | Would not initiate | |
| a conversation | a conversation | |
| Avatar | 7 | 5 |
| Avatars+List | 6 | 6 |
A. 1.4 Drawing Conclusions
The findings of the comparative study confirmed most of the experimental hypotheses. Participants using the avatars-only version of the user interface felt greater awareness and directness in their conversations. However, they also seemed to experience greater confusion, perhaps because the speech bubbles are distributed around the “room,” and it is difficult to keep track of the entire population of visitors and of what is being said. In the avatars+list condition, the list is a stable indicator of who is present and more attention can be focused on the content of the speech bubbles.
The performance data are also generally consistent with the hypotheses: Response times and vistor group memory were better in general for the users working with the avatars+list interface. Importantly, however, the response time advantage was present only for the largest visitor group size. In combination with the satisfaction results, this suggests that the issue is more complex than deciding whether or not to provide the secondary list view. In most cases, users will prefer avatars alone and perform just as well without the extra list support. Only when the visitor group size is large is a redundant information display needed. Display of a visitor list might thus be made contingent on the current visitor group size, or perhaps as an option under user control.
The findings regarding conversation initiation contribute little information. It seems likely that other factors are more important in determining users’ conversation behavior (e.g., who is visiting and users’ general personality). Despite the lack of a difference between test conditions, this result should be seen as good news, in that the choice of user interface will not bias people one way or the other in taking conversational initiative.