
CHAPTER 2 Analyzing Requirements
Make work visible. This end goal of requirements analysis can be elusive when work is not understood in the same way by all participants. Blomberg, Suchman, and Trigg (1996) discuss this in their exploration of image-processing services for a law firm. Their studies of the firm’s attorneys produced a rich analysis of document processing needs—for each legal proceeding, documents often numbering in the thousands are identified as “responsive” (relevant to the case) by junior attorneys, in order to be submitted for review by the opposing side. Every document page is given a unique number for retrieval purposes. An online retrieval index is created by litigation support workers; the index encodes document attributes such as date, sender, recipient, and type.
The attorneys told the analysis team that it would be easier to make the relevance decisions if the documents could be processed automatically to encode their objective attributes (e.g., date and sender). However, studies of human document processing revealed activities that were not objective at all, but rather relied on the informed judgment of the support staff. Something as simple as a document date was often ambiguous, because the index might display the date it was written, signed, and/or delivered; the date encoded required understanding the document’s content and role in a case. Even determining what constituted a document required judgment, as papers came with attachments and no indication of beginning or end. Taking the perspective of the support staff revealed knowledge-based activities that were invisible to the attorneys, but that had critical limiting implications for the role of image-processing technologies (Blomberg 1995).
In this chapter we introduce the goals and methods of requirements analysis, the phase of software development in which the needs of clients with respect to a proposed project or technology are analyzed. Requirements analysis usually starts with a mission statement or orienting goals, then becomes more elaborate through studies and meetings with prospective clients. Under the waterfall model, the result is a requirements specification, a document that lists all functions and features that the proposed system must satisfy.
User-centered approaches to software development recognize that it is impossible to specify all requirements in advance. Clients cannot appreciate their real needs until they see what kinds of options are available; work practices naturally evolve as new technology is introduced. However, this does not mean that requirements analysis is impossible or unimportant, but simply that it must be seen as an ongoing process. Analysts must still develop a detailed understanding of clients, their current work practices, and their needs with respect to the technology under consideration. They must develop and convey a rich description of the problems and opportunities that could be addressed through software design and development.
In the legal office case described above, the mission was to find business applications of image processing. The requirements analysis team studied the processing of legal cases to understand how this activity might be enhanced by image processing. They discovered that different work groups (attorneys versus their data processing staff) had very different understandings of case processing. Thus, an important contribution of requirements analysis in this situation was to capture these different perspectives of the problem.
Usability engineers participate in requirements analysis by studying how work currently takes place to see if they can identify problems or opportunities that might be addressed by new technology. This analysis provides crucial input to the design of new computing systems: At a minimum, a project team hopes to enhance the current situation. Of course other input will be provided by analyses that look at concerns such as hardware platforms, cost, development schedule, or marketing strategies. But because this book is about understanding and responding to the needs of users, we limit our discussion to concepts and methods for analyzing usage concerns.
2.1 Analyzing Work Practices
What is work?1 Try asking yourself or a friend this question. You will probably come up with the things you do during a typical day, the objects or tools you work with, and perhaps the people you talk to. A description of work involves three dimensions:
Analyzing all of these aspects of work is complex. A popular approach for analyzing the first dimension (activities) is hierarchical task analysis (HTA): Individual tasks and subtasks are identified and organized into a hierarchy (Diaper 1989). For instance, in a bank the task of REVIEW-ACCOUNTS might be decomposed as RETRIEVE-ACCOUNT-LIST, FIND-RECENT-ACTIVITY, and REVIEW-ACTIVE-ACCOUNTS (Figure 2.1). Each subtask is also decomposed; for example, FIND-RECENT-ACTIVITY might break down into READ-LISTING and CHECK-DATE. If needed, an HTA can be elaborated to a very fine level of detail, perhaps including physical actions such as picking up or repositioning a document. HTA also indicates decision making, such as when a banker must decide whether or not to open up a specific account based on its level of activity.

A strength of HTA is the step-by-step transformation of a complex activity space into an organized set of successive choices and actions. The resulting hierarchy can be examined for completeness, complexity, inconsistencies, and so on. However, too much emphasis on task decomposition can be problematic (Tradeoff 2.1). An analyst can become consumed by representing task elements, step sequences, and decision rules. Tasks and subtasks must always be understood within the larger context of work; overemphasizing the steps of a task can cause one to miss the forest for the trees. Part of understanding what it means to review accounts at a bank is learning about the banking organization—who makes certain that accounts are up to date, who has access to various accounts, what happens once an account is reviewed, and so on.
Hierarchical task analysis documents the functional goals of a workplace, BUT may direct attention away from an organization’s social relationships and goals.
The social context of work includes the physical, organizational, social, and cultural relationships that contribute to a work environment. Work activities do not take place in a vacuum. Tasks are motivated by personal goals; these in turn are motivated by the higher-level goals held by the organizations sponsoring the work (see “Activities of a Health Care Center” sidebar). A banker may report that she is reviewing accounts, but the bank may view this as “providing customer service” or perhaps “increasing return on investment.”
Of course, the banker is not the only person working toward this high-level goal. Secretaries, data-entry personnel, database programmers, even the bank’s executives, work with the banker to meet the bank’s business goals. They collaborate by communicating with each other about their personal activites, as well as through shared tools and information. Their interactions are shaped not only by the tools they use, but also by their shared understanding of the bank’s business practices—its goals, policies, and procedures.
Another aspect of work analysis is the study of workplace artifacts. The tools that people use to carry out their tasks can provide considerable insight into how they do their work (Carroll & Campbell 1989). An artifact is simply a designed object—typical office artifacts include the furniture, writing instruments and supplies of various sorts, forms and lists, folders, shelves and cabinets for storage, and computers and associated software packages (Figure 2.2). The features of each artifact encourage different kinds of actions and thoughts. For example, a pencil has a shape and weight compatible with the action of holding it between two or more fingers, sliding it across paper, and so on; the buttons on a phone have just the right size and resistance for human finger-presses; and a tape dispenser has a weight and sharp serrated edge to enable one-handed tearing of tape segments.
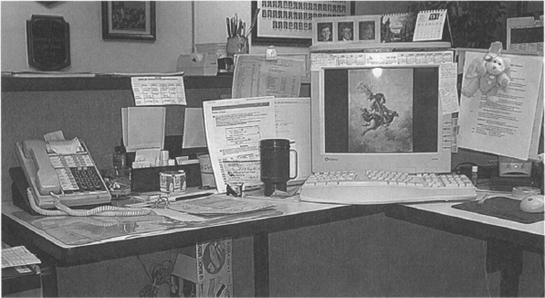
Figure 2.2 Photograph of a receptionist’s desk at Virginia Tech. The desk and its surroundings hold a huge set of artifacts used in the employee’s day-to-day activities.
It is easy and fun to find artifacts and analyze their characteristics (Norman 1987, 1988). Returning to the example of a pencil, note that its shape suggests quite a bit about human hands, such as their size and grasping behavior. Pencil designers succeed to a great extent by giving new designs the physical characteristics of pencils that have been used for years. But the artifact is just part of the picture. Even an object as simple as a pencil must be analyzed with respect to its real-world use (Tradeoff 2.2). Different uses of pencils bring out different concerns—elementary school students need good erasers; very sharp points are important to architects or graphic artists; and preteens competing for social status may care only about name-brand visibility. In the photograph above, the receptionist positions a wide variety of writing instruments in a visible and accessible location so that visitors will find and use the tools as needed.
Work artifacts reflect knowledge, roles, and procedures related to a task, BUT the actual meaning of an artifact is apparent only when observed in use.
Usability engineers have adapted some of anthropology’s methods for analyzing the activities, artifacts, and social context of work. Ethnography is an analytical technique used by anthropologists to gain insights into the life experiences of people whose everyday reality is vastly different from the analyst’s (Blomberg 1995). An ethnographer becomes intensely involved in a group’s culture and activities, sometimes even joining the group as a participant-observer.
Activities of a Health Care Center
Activity theory offers a view of task analysis that emphasizes the goals and practices of a community (Bødker 1991; Nardi 1996). In this framework, an activity is comprised of three elements: a subject (the actor), the community in which he or she is operating, and the object of the activity (the goal). However, each of these elements is mediated by other features of the activity—the tools that support the work, the rules of practice that define the conventions and procedures to be followed, and the division of labor that positions the goal of this activity within the community in general.
Kuutti and Arvonen (1992) exemplify this framework for a health clinic. The organization wanted to evolve from a highly bureaucratic organization with strong separations between its various units (e.g., social work, clinics, and hospital) to a more service-oriented organization. A key assumption was that different units share a common object—enhancing the “life processes” of the town’s citizens. This object was understood to be a complex goal requiring the integrated services of complementary health care units.
Activity theory provides an analysis of individuals acting within this community—for example, a physician. Although the entire community shares the goal of patient care, the physician works in a clinic, which is analyzed as a subcommunity. This clinic is geographically and functionally separated from other units, like the hospital and social work office. His day-to-day behavior is mediated by the tools and the rules of practice of his subcommunity.
As a result, the physician has no way to integrate his efforts with the work done by health care workers in the other subcommunities. For instance, he cannot benefit from the work on home life carried out by a social worker, or psychiatric treatments. There is a mismatch between the high-level shared goal and the physical working conditions. In activity theory, this mismatch is raised as a contradiction that must be resolved before the activity can be successful. In this case study, a more comprehensive analysis of “community” was needed. Email and telephone were used to foster a new virtual community, bringing together workers from different health units.
In the HCI community, ethnography involves observations and interviews of work groups in their natural setting, as well as collection and analysis of work artifacts (see “Teamwork in Air Traffic Control” sidebar on pages 44–45). These studies are often carried out in an iterative fashion, where analysis of one set of data raises questions or possibilities that are pursued in follow-up observations and interviews. However, a full ethnographic study implies weeks or months of observation, and system development projects rarely have this luxurious a schedule. In practice HCI professionals often rely on “quick-and-dirty” ethnographies—these field studies are carried out in a more intensive and focused fashion, with the goal of learning just enough to guide subsequent design activities (Nardi 1997; Hughes, et al. 1996).
2.2 Getting Users Involved
Who are the users? This is obviously an important question in user-centered development. It is first raised during requirements analysis when a project team needs to decide whose activities to study. Managers or corporate executives are a good source of high-level needs (e.g., reduce data-processing errors, or integrate billing and accounting). These individuals may also have a coherent view of many workers’ responsibilities and of the conditions under which tasks are completed. Because of the hierarchical nature of most organizations, these people are easy to identify and comprise a relatively small set. But if a requirements team stops there, they will miss the more detailed and situation-specific needs of the people who will be using the new system (Tradeoff 2.3).
Experienced workers have detailed knowledge about a task’s context and operation, BUT people in related roles may have completely different understandings.
Requirements analysis must consider multiple stakeholders—the many different groups of people who will be impacted by the development of the system (Checkland 1981; Muller 1991). Managers authorize the purchase or development of a new computer system; workers with various job responsibilities use the system; and other employees may benefit or suffer indirectly. Each set of stakeholders has motivations and problems that a proposed system may address (e.g., productivity, satisfaction, or ease of learning). None of them can adequately communicate the perspectives of the others—as summarized in the law office sidebar, many details of a subordinate’s work activities and concerns are simply invisible to those in supervisory roles. Requirements analysis must bring the full range of stakeholder groups into the observation and interviewing activities.
But do people even understand their own activities? We made the point earlier that too much focus on the steps of a task can cause analysts to miss important workplace context factors. A similar point holds with respect to interviews and discussions. People are remarkably good (and reliable) at “rationalizing” their behavior (Ericsson & Simon 1993). Thus, if asked, workers describe the prescribed or most typical version of a task. If a “procedures manual” or other policy document exists, task descriptions may mirror the official procedures and policies.
However, this officially blessed knowledge is only part of the picture (Tradeoff 2.4). Experienced workers also possess much “unofficial” knowledge, learned when dealing with the specific needs of different situations, exceptions, particular coworkers, and so on. This expertise is often held as tacit knowledge—experts may not even realize what they “know” until confronted with their own behavior or interviewed with situation-specific probes. Tacit knowledge about work is often very valuable, because it may contain the “fixes” or “enhancements” that have developed informally to address the problems or opportunities of day-to-day work.
Teamwork in Air Traffic Control
An ethnographic study of British air traffic control rooms by Hughes, Randall, and Shapiro (1992) highlighted a central role for the paper strips used to chart the progress of individual flights. In this study the field-workers immersed themselves in the work of air traffic controllers for several months. They observed the activity in the control rooms and talked to the staff, and they also discussed with the staff the observations they were collecting and their interpretation of these data.
The goal of the study was to analyze the social organization of the work in the air traffic control rooms. The researchers showed how the flight progress strips supported individuation—the controllers knew what their jobs were in any given situation, but also how their tasks were interdependent. This division of labor was accomplished smoothly because the controllers had shared knowledge of what the strips indicated; they were able to take on and hand off tasks as needed, and to recognize and address problems that arose.
Each flight strip displays identifying information about an aircraft, its flight plan, and its current status (see figure on facing page). However, these artifacts are more than just information displays. The strips are work sites, used to initiate and perform control tasks. Each strip is printed from the online database, but then annotated as flight events transpire. This creates a public history, so that any controller can reconstruct a “trajectory” of what happened with the flight. The strips are used along with radar data to spot exceptions or problems with standard ordering and arrangement of traffic. Individual strips get “messy” to the extent flights have deviated from the norm; thus, a set of strips serves as a sort of proxy for the orderliness of the skies.
The team interacts through the strips. Once a strip is printed and its initial data verified, it is placed in a holder that is color coded for its direction. It may then be marked up by different controllers, each using a different ink color; problems or deviations are signaled by moving a strip out of alignment, so that visual scanning detects problem flights. This has important social consequences for the person responsible for a flight. This individual knows that other team members are aware of the flight’s situation and can be consulted; who, if anyone, has noted specific issues with the flight; if a particularly difficult problem arises it can be passed on to the team leader without a lot of explanation; and so on.

Diagram of the flight strip studied by Hughes, Randall, and Shapiro (1992, 117).
The ethnographic analysis documented the complex tasks that rely on the flight control strips. At the same time it made clear the constraints of these manually created and maintained records. A particularly compelling observation was trust of the strips. This was due not to the strips’ physical characteristics, but rather to the social process they are part of—the strips are public; and staying on top of each other’s problem flights, and discussing them informally while working or during breaks, is simply taken for granted. Any computerized replacement of the strips must support not just management of flight information, but also the social fabric of the work setting that makes the controllers confident of the information around them.
Documented standard procedures make work smooth and stress free, BUT much of an employee’s value comes in the tacit recognition and resolution of exceptions.
Sachs (1993, 1995) suggests that organizations can understand themselves from two different perspectives—an “organizational, explicit” view and an “activity-oriented, tacit” view (Table 2.1). The organizational view is easy to reveal and document, because it is described in company policies and procedures. For example, a workflow system is a business support system that models explicit task knowledge of this sort. The business process model is then used to plan, coordinate, and track interrelated tasks. In contrast, understanding the second perspective requires the study of everyday work processes to see what employees actually do to make their organization function effectively. This often involves the analysis of informal and ad hoc communication and collaboration activities (see “Tacit Knowledge in Troubleshooting” sidebar).
Table 2.1 Contrasting an organizational, explicit knowledge view with an activity-oriented, tacit knowledge view (after Sachs 1995, 38).
| Organizational Explicit | Activity-Oriented Tacit |
| View | View |
| Training | Learning |
| Tasks | Know-how |
| Position in hierarchy | Informal political systems, network of contacts |
| Procedures and techniques | Conceptual understanding |
| Work flow | Work practices |
| Methods and procedures | Rules of thumb, judgment |
| Teams | Communities |
One technique for probing workers’ conscious and unconscious knowledge is contextual inquiry (Holtzblatt & Beyer 1993). In this method, people are observed as they carry out tasks in their normal work environment. Notes are made, but the observers are also free to interrupt the work if a problem arises, or to ask for elaboration or rationale for people’s actions. For example, an analyst might see a secretary stop working on a memo to phone another secretary, and then ask her after the call to explain what happened between her and her coworker. This creates a more elaborate record of the task (e.g., it may actually involve input from two employees). It also helps in identifying the causes of people’s behavior, because they are prompted to reflect on their actions at the time that they take place.
A related approach is participatory analysis, where people are observed during normal work activities, and later engaged in discussion about these activities. During requirements analysis for the Virtual School (Chapter 1), we videotaped many hours of students conducting science experiments in their classrooms. Later on, we shared these videotapes with small groups of teachers and students. We asked them to suggest interesting features of the activities, and to help us understand why activities worked well or poorly, and what might be done to improve the learning outcomes (Chin, Rosson, & Carroll 1997).
Tacit Knowledge in Troubleshooting
People often see their conversations with coworkers as a social aspect of work that is enjoyable but unrelated to work goals. Sachs (1995) discusses the implications of this in her case study of telephony workers in a phone company. The study analyzed the tasks of detecting, submitting, and resolving problems on telephone lines. The impetus for the study was the Trouble Ticketing System (TTS), a large database used to record telephone line problems, assign problems (tickets) to engineers for correction, and keep records of problems detected and resolved.
Sachs argues that this system embodies an organizational view of work, where individual tasks are modular and well defined: One worker finds a problem and submits it to the database; TTS assigns it to the engineer at the relevant site, and that engineer picks up the ticket, fixes the problem, and moves on. The original worker is done with problem analysis after submitting the ticket, the second can move on once the problem has been addressed, and so on. TTS replaced a manual system in which workers contacted each other directly over the phone, often working together to resolve a problem. The system was designed to make work more efficient by eliminating unnecessary phone conversations.
In her interviews with telephony veterans, Sachs found that the phone conversations were far from unnecessary. The initiation, conduct, and consequences of these conversations reflected a wealth of tacit knowledge held by the engineers—selecting the right person to call (with relevant expertise for the problem), the “filling in” on what the first worker had or had not determined or tried to this point, sharing of hypotheses and testing methods, iterating together through tests and results, and carrying the results of this informal analysis into other possibly related problem areas. In fact, TTS had made work less efficient in many cases, because in order to do a competent job, engineers developed “workarounds” wherein they used phone conversations as they had in the past, and then used TTS to document the process afterward.
Sachs noted that the telephony workers were not at first aware of how much troubleshooting knowledge they were using in their jobs. They described tasks as they understood them from company policy and procedures. Only after considerable data collection and discussion did they recognize that their jobs included the skills to navigate and draw upon a rich organizational network of colleagues. In further work, Sachs helped the phone company to develop a fix for the observed workarounds in the form of a new organizational role: a “turf coordinator,” a senior engineer responsible for identifying and coordinating the temporary network of workers needed to collaborate on troubleshooting a problem. As a result of Sachs’s analysis, work that had been tacit and informal was elevated to an explicit business responsibility.
2.3 Science Fair Case Study: Requirements Analysis
SBD starts with requirements analysis. Of course, we do not claim that requirements are analyzed all at once in waterfall fashion. However, some analysis must happen early on to get the ball rolling. User interaction scenarios play an important role in these early analysis activities. When you do a field study of a workplace, you observe episodes of real work that may or may not involve technology. The usability engineering goal is to identify aspects of current activities that might be improved or redesigned.
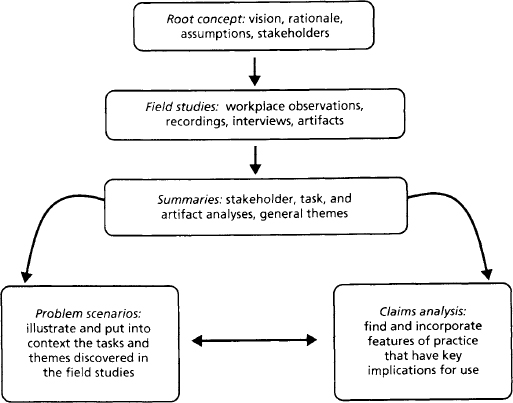
Figure 2.3 summarizes the activities of requirements analysis in SBD. The fieldwork is guided by a root concept, a basic understanding of the project mission that is developed and shared by members of the project team. Field studies examine the activities of various project stakeholders—customers or clients who have an interest or “stake” in how the project turns out. The data from field studies is complex, so various summary representations are developed to organize keyideas. These insights are then synthesized into problem scenarios, that is, narratives of activities in the current situation that reflect needs and opportunities for redesign. These scenarios are complemented by claims that analyze the features of the current situation that are most important in the usage experience. In the following we expand on each of these techniques and representations.
2.3.1 Root Concept
Before going into the field, the analysis team should develop a shared understanding of the project’s high-level goals. In SBD we document this understanding as a root concept (Table 2.2). The root concept is multifaceted, including a statement of project vision and rationale, an initial analysis of project stakeholders, and an acknowledgment of starting assumptions that will constrain or otherwise guide the development process. The root concept is related to the stakeholder analyses of soft systems methodology (see Checkland 1981; Checkland & Scholes 1990).
Table 2.2 Root concept developed at the beginning of the virtual science fair project.
| Component | Contributions to the Root Concept |
| High-level vision | Students exhibit science projects online in an ongoing fashion |
| Basic rationale | Online activities enable more community involvement in science education |
| Digital media enhance potential quality of exhibits | |
| Stakeholder group | |
| Student exhibitor | More options for building and exhibiting science projects; more interactions |
| Student visitors | Easy to visit and comment on friends’ activities and progress |
| Teacher | More flexibility in coaching; sharing of this responsibility with community |
| Community member | Better access to science fair activities; more options for participation |
| Community judge | Greater flexibility in judging; more refined administrative support |
| School administrator | Greater visibility and recognition of education programs |
| Starting assumptions | Will be built using the services and infrastructure of MOOsburg |
| Designers and implementors are university researchers | |
| Development will take place through participatory analysis and design efforts |
A project’s starting vision and rationale may come from many different sources. Sometimes a vision statement is handed down from management, a client, or a marketing division; at other times it will emerge from open-ended discussions about new technologies, or as a solution to specific known problems (e.g., inefficiency or dissatisfaction with a business process). The vision for the virtual science fair was prompted by the increasing access to network technologies on the one hand, and by theories of informal education on the other. The education rationale comes from evidence that rich and meaningful learning is enhanced when children work on authentic projects outside the normal boundaries of the classroom (Jeffs & Smith 1996).
Part of developing a shared vision is the identification of people who will have a vested interest (or stake) in the project outcome—the stakeholders. Notice that not all stakeholders will actually use the proposed system. For example, we expect that the online science fair will involve students, teachers, community members, and judges. But school administrators are also stakeholders, because the success or failure of the science fair reflects on their school system. The stakeholder analysis is refined by considering how the various stakeholders might benefit (or suffer) if the vision were to be implemented.
The final element of the root concept is a list of starting assumptions and how they may impact the project. It is important to consider these early in the project lifecycle, because they may have important effects on subsequent analysis and design work. The science fair project was carried out by university researchers, so it is relatively unconstrained in many dimensions (e.g., schedule, cost, performance characteristics, etc.). But because the project will be implemented within MOOsburg, this community network system is a strong external constraint. At the same time, the development team decided in advance to collaborate with the many community stakeholders throughout the process (participatory design).
The stakeholders name the groups or individuals who should be consulted or observed in the fieldwork. The brief description of each group’s vested interest points to questions or tasks that should be raised and observed in the workplace. For example, we should ask students about their project construction and exhibition activities, talk to community members about how and when they visit these fairs, and consult the school administrators about how a science fair is recognized and allotted resources.
2.3.2 Analysis of Current Practice
The root concept sets the scene for a field study of current practices. With a shared understanding of project stakeholders, goals, and assumptions, the team can start to analyze the activities that will be transformed by the system. Attention should be directed to the needs and concerns of all stakeholders. For the science fair, this includes students, teachers, community members, judges, and the school administration.
Preparing for the Field Study
As team members develop their root concept, questions will come up about the current situation the system is hoping to address. For example, in thinking about a science fair, we wondered about the projects students currently develop and exhibit, the resources they draw on for project development, how the projects are exhibited and judged, how and when parents or other community members contribute to project work, and so on.
A side effect of these initial discussions is that group members learn more about each other—personal background, interests, and biases about science fairs, as well as skills and aptitudes in fieldwork. This helps to organize the group. For example, one member may take on a leadership role, ensuring that decisions are made, a schedule is constructed, and that everyone understands his or her responsibilities. Other team members may take on the job of identifying and making contact with individuals willing to be observed or interviewed. Others may focus on creating and assembling an interviewing guide and data capture tools.
Figure 2.4 presents a guide for conducting our interviews with student exhibitors at a science fair; different guides were developed for each stakeholder group. Each guide should support—but not overconstrain—the questioning process. At the top there is a reminder about what the interviewer is trying to accomplish. The goal is to learn what the participants think about their own activities, so the guide should avoid specific and pointed questions early in the interview. Instead, begin with open-ended prompts that explore general background and how the interviewees think about their work (“tell me about what you do”). More specific questions are listed at the end, reminding the interviewer to address these issues if they have not yet been not raised in the earlier discussion.

In addition to preparing an interviewing guide, the team must decide how to document their field observations. If the work setting involves considerable physical manipulation of objects, a videotape may be helpful. Otherwise, a small tape recorder can be used to record conversations. In either case, plan in advance how you will use the recording equipment (i.e., where will you place the camera[s] or the microphone, and how many tapes will you need), and be certain to gain participants’ permission for any recordings in advance. It may also be useful to bring along a camera to make snapshots of work activities. Finally, one or more team members should take detailed written notes. In gaining permission for the visit and observations, be clear that all recordings, photos, or notes will be treated confidentially.
It is important in a workplace study to establish a comfortable relationship between yourself and the workplace participants. In some settings, workers may be selected by management and may resent spending time with you. In workplaces that rely on very little technology support, participants may be intimidated by developers or researchers who are experts in computer science or design. Your team must be sensitive to social factors like this one and focus first on establishing a friendly and nonjudgmental tone to the exchange.
Observations, Interviews, and Artifacts
The photo in Figure 2.5 was taken during a visit to a science fair. Even a single snapshot like this reveals many details about the work setting and activities. For example, we see that the student is using a computer as part of the exhibit, and is showing his project to several people at once. The visitors seem to be a family group ranging in age from a small child to an adult. Also in the room are non-computer artifacts, including posters on the walls and refreshments on a table. It isn’t obvious what relation the posters have to the computer exhibits, but interviews with the students indicated that only some projects had computer-based content, whereas all projects had a physical poster display.

The posters on the wall are a good example of a science fair artifact. A workplace artifact is any resource that seems to play an important role in an activity; for example, this photo contains artifacts such as the computer with its software and data, posters on the wall, furniture, and even the room itself. Other artifacts from the field study included registration and evaluation forms and an advertisement poster. In some cases, these artifacts are documented by videotapes or photographs; in other cases, the observation team must ask specifically for copies of relevant documents or other tools, or may simply make notes that describe such objects.
In addition to taking photographs, we observed exhibit activities and interviewed students and visitors. In this case, our field study was opportunistic—we simply observed the participants and activities underway during our visit. If we had been studying a more structured workplace (e.g., a business office), we would have spent more time planning the visit, first finding out when key activities take place, and making sure that we visited during these times. Sometimes a team may need to simulate an important but infrequent real-world activity—for example, asking a retail store employee to act out the process of reporting a theft.
How much field data should you collect? How many visits are necessary, and to how many different sites? This depends on the project’s scope and resources; large or innovative projects usually spend more time on requirements analysis. At the same time, some projects may have a tight schedule or other limited resources, so that extensive fieldwork is impractical. As a rule of thumb, we recommend at least one set of observations and/or interview for each stakeholder group. For the science fair, this meant talking to students, teachers, community members (including parents, judges, and visitors), and the school administrators.
2.3.3 Summarizing the Field Data
Fieldwork produces a wide variety of data (photos, videos, notes, etc.) that can be overwhelming. Here we discuss several summary representations that can be used to organize the findings about a project’s stakeholders, their activities, and the tools or artifacts they use.
Stakeholders
The observations and interviews for each stakeholder group are organized into stakeholder profiles (Table 2.3). These profiles summarize the general characteristics of each group, and are based on the observations and interviews from the field study. On occasion they may include published research about the population (e.g., information about demographics, disabilities, or other special characteristics). We organize the summaries into background, expectations for the proposed system, and preferences regarding information technology. We will use these profiles later to generate hypothetical stakeholders who will play the role of actors in the problem scenarios.
Table 2.3 Stakeholder profiles developed from the science fair field study.
A related summary is the stakeholder diagram showing the relations among different stakeholder groups (Figure 2.6). Students do not work on their projects in isolation; teachers advise them and community members may provide comments or serve as official judges. These sorts of relations are important to document and, like the profiles above, will be useful in developing the problem scenarios—scenarios often involve more than one actor, and the actor interactions will illustrate these general relations.

Notice how the relationships diagrammed in the figure show the interactions of the school administration with other stakeholders. A simplistic analysis of science fairs might ignore the influence of the school administration, but in fact these individuals have key responsibilities for recruiting and rewarding participation, as well as in gathering resources for such events.
Discussion of stakeholder relations helps a team understand the impacts that one group of participants may have on others. For instance, the number of students who participate affects the number of community members needed to judge the exhibits, as well as the resources needed from the school administration. Similarly, the background and interests of the community members who visit a student’s exhibit will influence the ease and enjoyment of the exhibiting process.
Task Analysis
Another set of summaries is developed to document the tasks of each stakeholder group. Table 2.4 presents a simple list of tasks that were observed and discussed during the science fair. Although we do not yet know what aspects of the science fair will be addressed by the new project, we want to have as complete a list as possible of the contributing activities. Clearly, the students, visitors, and judges are most central to the science fair activity, but teachers and administrators have their own set of supporting tasks.
Table 2.4 Tasks carried out by stakeholders as part of the science fair activity.
| VSF Stakeholder | Science Fair Tasks Observed or Discussed |
| Students | Reviewing participation requirements; proposing a project; carrying out the project; constructing an exhibit; demonstrating the project |
| Community members who visit exhibits | Finding out about the fair; traveling to the fair; browsing projects at a fair; interacting with students at their exhibits |
| Community members who serve as judges | Volunteering to be a judge; studying the evaluation form; evaluating a specific project; writing and submitting exhibit evaluations |
| Teachers | Helping a student refine a proposal project; providing pointers to resources and other information; critiquing a student’s project in progress; helping a student create an exhibit |
| School administrators | Recruiting volunteers to judge projects; summarizing participation in fair; highlighting winning projects in annual report; specifying resources needed for next year’s fair; acknowledging student and judge participation |
For tasks that have many steps, or that are particularly important in an activity, a hierarchical task analysis may be developed. As discussed earlier, this analysis decomposes complex tasks into subtasks. Figures 2.7 and 2.8 present a hierarchical task analysis for two central science fair tasks—exhibit preparation (2.7) and judging (2.8). We are confident that both of these tasks will be addressed in some way by the new system, so it is worthwhile to analyze in detail how they are currently accomplished.


Each box in the task analysis diagrams represents a task step. Vertical lines indicate decomposition of a step into two or more subtasks; the subtasks are gathered together under the horizontal lines. Numbering indicates how a task is decomposed, and the plans show the logical ordering or dependencies among subtasks. For example, in Figure 2.7, the plan for the project content analysis task says to first write down the project structure, and then summarize the content for each element.
Artifact Analysis
Figures 2.9 and 2.10 present two artifacts collected in the science fair study, an advertising poster (2.9) and a judging form (2.10). Workplace artifacts can be of many sorts—data files, forms, software, brochures, and so on—and help to document task information and procedures. The poster that advertises the fair shows which features the organizers believe are important to convey to potential visitors. The judging form reflects the value system applied to exhibit evaluation, which dimensions are important, how the dimensions should be weighed against one another, and so on. Other artifacts relevant to science fairs are the student registration form, newspaper notices recruiting volunteers to serve as judges and later announcing the winners, instructions provided to judges and to students, photographs of the exhibits, prize ribbons, and even the thank-you notes sent by fair organizers to the volunteers helping to set up and judge the exhibits.

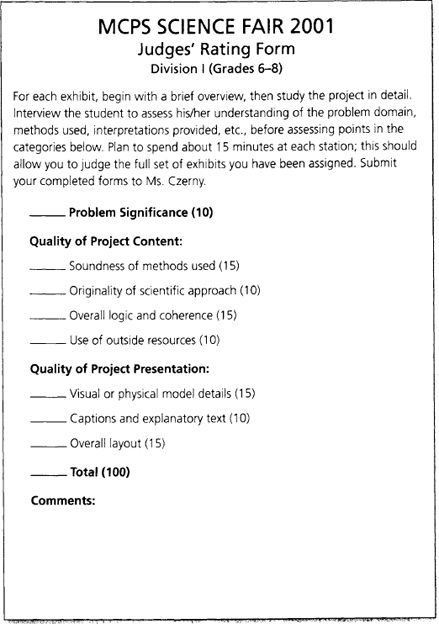
Table 2.5 summarizes what was learned from the poster and the judging form, broken into the information and procedures implied by each artifact. The poster reflects what the organizers believe are the most important or interesting aspects of the fair. The judging form highlights characteristics related to the quality of exhibits. It is possible that an artifact will reflect information that conflicts with field observations (e.g., we might have found out that the organizers had changed, a sponsor had been added, etc.), so it is important not to accept without question the information or procedures that they imply. As we noted earlier, much of what people know or experience in a situation is based on tacit knowledge, or is the result of other stakeholders’ views and concerns.
Table 2.5 Information and procedures implied by the poster and the judging form.
| Science Fair Artifact | Implied Information Needs and Procedures |
| Fair publicity poster | Information: when and where fair is held; sponsoring organization; time when winning exhibits announced; sample projects; contact information |
| Procedures: fair lasts 2 hours; judging takes 1.5 hours; projects take up to 6 months to complete; exhibits entered and judged in three age-level groupings | |
| Judging form | Information: judging is age-specific; exhibits judged on three dimensions; quality is complex judgment broken into subcategories; Ms. Czerny is head judge |
| Procedures: interview addresses significance and quality; judging takes 15 minutes; forms submitted when all are done; head judge compiles results |
Workplace Themes
As the discussion of field data continues, the team should begin to identify and illustrate workplace themes. A workplace theme is simply a category that is proposed for related observations or discussion points. Different stakeholders will focus on different aspects of the current situation (e.g., based on their personal motivations or backgrounds), but the analysts should search for underlying patterns in the problems observed or concerns raised.
A useful technique for identifying workplace themes is to write down on a post-it note any comments or observations that seem interesting. These notes are then arranged on a wall. The analysis team works together to rearrange related post-its into groups (Figure 2.11). As groupings are proposed, their usefulness is tested by trying to name them—if you find yourself with too many “Miscellaneous” or “Other Problems” groups, your work is not done yet! This is similar to the “affinity diagrams” used in contextual design (Beyer & Holtzblatt 1998; Wixon, Holtzblatt, & Knox 1990).

The thematic groupings are reviewed, discussed, reorganized, and renamed until a team is satisfied with their shared understanding of the data. The process can also be carried out in a participatory fashion with other project stakeholders. Sometimes a comment or discussion point may fall into more than one theme. This is fine; simply make some indication that multiple copies have been made.
As the number of themes becomes large, it may be useful to create a tabular representation like that in Table 2.6, which collects a number of science fair observations under six themes. Notice that we were careful to include both good and bad things about the current practice of science fairs. This is a key aspect of the SBD framework: Even though we are most interested in “fixing” problems, we want to make sure that we do not “break” things that are working well.
Table 2.6 Summary of themes from the science fair field study.
| Theme | Issues Contributing to the Theme |
| Fair attendance | Difficult to get the word out to people who are not parents of students Evening exhibit hours compete with other family events or obligations Same families tend to participate each year, an informal subcommunity |
| Student participation | Participants are usually experienced, know a good deal about projects and judging |
| Enjoy feeling creative; highly motivated to innovate in methods and displays Very excited but also anxious during judging, proud if they or friends “win” | |
| Community involvement | Parents are the most active supporters, often bring family of “cheerleaders” A few people involved year after year, often as mentors, organizers, or judges |
| Those who do come enjoy themselves, talk to one another as well as browse | |
| Some visitors see posters in background, but never get around to examining them | |
| Some feel they might like to be involved but too busy doing other things Some may discover “results” through newspaper summaries or other institutions | |
| Judging | Very demanding activity, sometimes hard to give each exhibit enough time Relies considerably on paper form to guide comments and ratings Usually assigned only a subset (e.g., by age or topic) to evaluate Often must deal with a broad range of quality and sophistication in exhibits |
| Exhibit construction | Takes place over long period of time through planning and iteration Constrained by available space and materials (e.g., 4’x6’ poster boards) Follows a general structure, a top-to-bottom, left-to-right, flow of ideas Should provide an overview, as well as details on closer investigation |
| Resources | Usually scheduled in open multipurpose space such as a high school gymnasium |
| Students sometimes get project materials from schools, often from home Technology support is minimal, often no power or equipment options Organized and judged by volunteers who are “rewarded” with recognition |
Workplace themes are a critical source of information for the problem scenarios and claims produced during the requirements phase. They make explicit a team’s shared understanding of what is most interesting or important about the problem domain the team has been studying.
2.3.4 Problem Scenarios and Claims
Stakeholder profiles and diagrams, task and artifact analyses, and field data themes form a scaffolding from which problem scenarios are constructed. A problem scenario tells a story of current practice. These stories are carefully developed to reveal aspects of the stakeholders and their activities that have implications for design. Other members of the project team (e.g., managers, software engineers) should be able to read the problem scenarios and appreciate the work-related issues that the field study has uncovered.
We call these “problem scenarios” not because they emphasize problematic aspects of current practices, but rather because they describe activities in the problem domain. In SBD new activities are always grounded in current activities. It is just as important to understand what is working well already and to build on this as it is to find difficulties that must be addressed.
Scenario writing is a creative activity. The fieldwork uncovers key tasks and themes that should be illustrated. Real-world characters and context are created to help in generating the stories and in making them believable and evocative. Sometimes an observed episode will form the base for a scenario, but in most cases the stories will be entirely fictional.
A useful way to get started is to describe a few hypothetical stakeholders, imaginary people with characteristics you think are typical of a stakeholder group (similar to Alan Cooper’s notion of a “persona” Cooper 1999). These stakeholders will serve as actors in the problem scenarios, and the background and motivation for each helps us to imagine how a specific scenario might unfold from that person’s perspective.
Figure 2.12 describes five hypothetical stakeholders for a science fair—a student exhibitor, her teacher, her next-door neighbor, a longtime science fair judge, and the fair organizer. For projects with a strong commitment for innovation, a related technique that involves the generation of “unusual” actors (e.g., a neighborhood gang leader) might be used as a complement to envisioning more typical characters (Djajadiningrat, Gaver, & Frens 2000).

Figure 2.13 presents five problem scenarios that use one or more of the hypothetical stakeholders as actors. We used the tasks listed in Table 2.4 as a starting point for these stories, but there is no strict 1:1 mapping. The goal is always to tell a story about the current situation that is meaningful to the actors, and that brings out some of the issues identified during analysis. This sometimes involves a combination of two or more tasks. For example, the story about Alicia and Delia touches on three of the tasks listed for community visitors—finding out about the fair, browsing an exhibit, and interacting with a student.
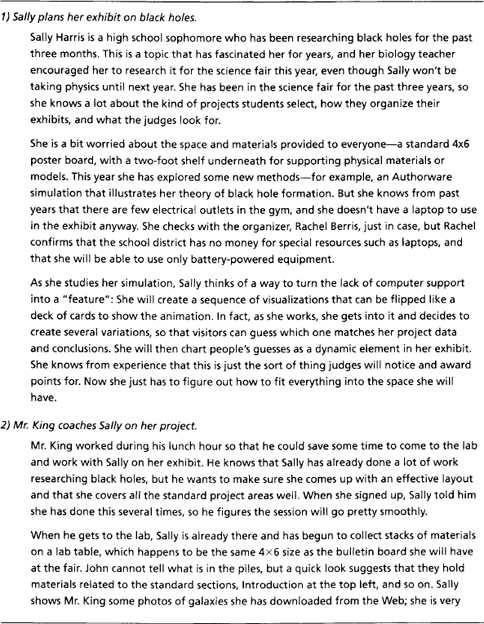


Figure 2.13 (continued.)
Although the field studies provide an understanding of the current situation, it is up to the scenario writers to decide what tasks to illustrate, how to weave in the themes and stakeholder relations, and what other details about the character or situation to include. In Figure 2.14 we diagram how we came up with the first scenario: We took one of Sally’s most important tasks (planning her exhibit), then imagined how she would approach this task. We gave her a plausible topic, and considered what her goals would be and what actions and reactions might take place as she worked on her exhibit ideas. We continually referred to the themes to see if we could incorporate anything relevant to the themes in this situation.

Scenarios often involve more than one stakeholder. For example, Alicia and Delia encounter Sally during their visit. Indeed one contribution of this scenario is to explore the stakeholder relationship between visitors and students at the fair (Figure 2.6). As suggested here, the stakeholder diagram can also be a guide when generating scenarios—as a story unfolds, consider whether interactions with other stakeholders could make the scenario more realistic or raise issues that the team has uncovered.
A scenario should convey what its actors are like, and what forces are influencing their behavior. Both Sally and her teacher are busy people; this is typical though not part of the science fair itself. Alicia Sampson’s family life has no direct bearing on the fair or its operation. However, these details provide concrete bits of context that allow the reader to empathize with the actors’ motivations and experience. The details also evoke thoughts about contrasting situations where other factors are in play, such as a case where Sally’s neighbor lives alone and has no other obligations. This “what-if” thinking is an important benefit of writing and sharing scenarios in requirements analysis.
The five scenarios in Figure 2.13 deliberately reuse actors and artifacts (most notably Sally and her exhibit). This adds to the overall coherence of a scenario set: The description of Sally’s project during construction has to make sense in the context of coaching, visiting, judging, and archiving. Such reuse encourages a broader analysis of the people and artifacts in the problem domain, because impacts on more than one activity are considered. Of course, this comes with a cost of not generating descriptions of other people and artifacts—for example, an inexperienced judge who is unable to complete the forms in the time allotted. A set of problem scenarios serves only as an illustrative set of “stakes in the ground.” They are suggestive, not exhaustive.
In SBD, scenario writing is always interleaved with claims analysis, where the features of a situation that have important effects on the actors are identified. Each such feature is written down with its hypothesized good and bad effects. Claims analysis is related to the tradeoffs identified in each chapter of this textbook. Claims can be seen as examples of tradeoffs, where the tradeoffs are reflected in the claim’s upsides and downsides. The difference is that claims are tied to specific artifacts and activities, while the chapter tradeoffs are general statements of competing concerns. Claims can often be seen as instances of these more general tradeoffs. Claims analysis plays several important roles in SBD:
Table 2.7 Claims analyzed while developing the problem scenarios. The consequences preceded with plus signs are referred to as “pros” or “upsides” of a feature; those with minus signs are the “cons” or “downsides” of a feature. As a group they illustrate the tradeoffs associated with the feature.
How did we come up with the claims in Table 2.7? We first identified the “interesting features” of a scenario. During requirements analysis, a claims feature is anything in the situation that has notable effects on an actor’s experience—an object, a procedure, even another person. (During design, we use claims to analyze features of the new design.) Some features may emerge during theme analysis (physical exhibits, the high school gym as an exhibit space; see Table 2.6). The search for features is also influenced by the technology you are likely to apply. For instance, we knew in advance that digital storage and display are very different than their physical counterparts, so we tried to analyze the impacts of physical project elements.
Once an interesting feature was identified, we considered its consequences for the actors in the science fair scenarios. A consequence is simply some impact on a person’s ability to carry out or enjoy an activity. For instance, does the physical character of Sally’s materials make it easier to plan and construct her exhibit? Harder? More or less pleasant or satisfying? Often a scenario will convey just one consequence of a feature, but most features have more than one possible effect, both positive and negative. In cases where the analysis team is relatively unfamiliar with the problem domain, discussions with stakeholders about features and consequences may be essential (Chin, Rosson, & Carroll 1997).
A claim can be extended by thinking about the impact of the same feature in other situations. Sometimes this means considering a slight variant of an existing scenario (e.g., what if Sally had a two-foot poster board to work with?). A feature may have different consequences for different stakeholders, so it is important to consider effects that might be occurring in other scenarios (e.g., the physical flip cards were attractive to Delia). Sometimes a consequence found during discussion leads to additions or revisions to a scenario. For example, we added the comment about Sally’s handling of her photos only after first proposing that reproduction cost is a negative consequence of physical exhibits.
As we indicated above, claims are often related to the more general tradeoffs that are discussed in this textbook. For example, thinking about poster boards directed our attention to the general structure of exhibits (typical elements and layouts), but we also recognize that students have strong feelings of creativity and personal ownership (Tradeoff 2.1). The judging form presents task-oriented information (the evaluation dimensions and their relative weights), but seeing the forms in use reveals that they are not always used as intended (Tradeoff 2.2). Holding the science fair in the gym is a good use of community resources, but individual students may find the large multipurpose space hard to use (Tradeoff 2.3).
Analysts and designers often ask how many scenarios and claims are enough, and how to tell if they have come up with the “right” ones. There is no simple answer to these concerns. SBD is an inquiry method—it raises questions that promote rich discussions and understandings of people and activities. Thus, one answer is that you are not done until there are no more questions. Obviously this is not a practical response, so we also offer a few rules of thumb:
2.3.5 Scenarios and Claims as Requirements
Are problem scenarios and claims a requirements specification? No. A problem scenario does not specify what a new system should do; it presents insights gleaned about the current situation. Subsequent design reasoning will respond to these problem scenarios and claims by creating and refining a design vision that will be implemented as a software system. In this sense, problem scenarios and claims express requirements only implicitly by describing the needs and opportunities in the current situation.
Problem scenarios relate how particular features of the world are believed to impact people’s activities and experiences; claims provide a more explicit analysis of these impacts. A design process must then respond to these needs and possibilities, maintaining or improving on the positive characteristics while diminishing or removing the negative.
Remember that this textbook presents a simplified view of SBD. In practice, analysis and design are tightly interleaved. As soon as usage concerns or opportunities are discovered in the problem situation, potential design solutions will be proposed and considered. Indeed, we can see this in the science fair example: Our requirements analysis focused almost immediately on the usage issues that are most likely to be influenced by networks and digital media (e.g., scheduling and space constraints). At the same time, because the entire process is iterative, we know that these scenarios and claims are only a first pass at understanding the problem situation. Our analysis of users’ requirements will continue to develop as design ideas emerge and are explored in new scenarios and claims.
Summary and Review
This chapter summarized some of the important issues in analyzing the needs of the situation a system will transform. The virtual science-fair case study was introduced and used to illustrate requirements analysis activities in SBD. Central points include:
Exercises
Project Ideas
Conduct a requirements analysis for the online grocery store problem:
Recommended Reading
Beyer, H., & K. Holtzblatt. 1998. Contextual Design: Defining Customer-Centered Systems. San Francisco: Morgan Kaufmann.
Cooper, A. 1999. The Inmates Are Running the Asylum: Why High-Tech Products Drive Us Crazy and How to Restore the Sanity. Indianapolis: Sams Press.
Nardi, B. A., ed. 1996. Context and Consciousness: Activity Theory and Human-Computer Interaction. Cambridge, MA: MIT Press.
Wixon, D., & J. Ramey, eds. 1996. Field Methods Casebook for Software Design. New York: John Wiley & Sons.
1In this discussion we use “work” to refer broadly to the goal-directed activities that take place in the problem domain. In some cases, this may involve leisure or educational activities, but in general the same methods can be applied to any situation with established practices.