In the previous chapter, we created a second version of Dice of Doom to play on larger game boards. It has become quite difficult to understand the board and make moves using our crude console interface. Certainly, Dice of Doom would be infinitely better if we had a pretty graphical game board that allowed us to simply click where we wanted to make our moves. Well, I have good news for you . . .
In this chapter, we’ll put together a lot of code from earlier chapters to transform Dice of Doom into a full-featured, graphical game you can play right inside a web browser!
We’ve already written a primitive web server in Chapter 13. Also, we’ve covered how to draw SVG graphics with a DSL in Chapter 17. Lucky for us, the new HTML5 standard includes features that make it possible to embed SVG pictures directly inside a standard HTML document. In this way, we’ll be able to use our simple little web server to serve up some fully interactive vector graphics. You’ll be amazed at how easy it is to do this.
Note
At the time this book was written, the only web browser to support inline SVG within HTML was Firefox 3.7 Alpha. Use this, or a more recent release of Firefox with our new version of Dice of Doom. If you’re having problems, try navigating to the about:config page in the Firefox address bar, and set the html5.enable configuration setting to true. This will allow Firefox to use the latest HTML5 settings.
Also, remember that our web server library is not pure ANSI Common Lisp, and makes use of some CLISP-specific extensions. This means it requires CLISP to function.
First, we’ll need to pull in code from various other chapters to get ready. In the previous chapter, we created version 2 of our Dice of Doom engine. Place all the code from that chapter in a file named dice_of_doom_v2.lisp. You should also already have created a file named webserver.lisp from Chapter 13. (These files are all freely available from http://landoflisp.com/.)
Let’s load in these files:
>(load "dice_of_doom_v2.lisp")>(load "webserver.lisp")
For our SVG support, we’ll also need the SVG-rendering code from Chapter 16 and Chapter 17. Place those functions in svg.lisp. (This file is also available from http://landoflisp.com/.) For reference, the functions we’ll need are let1, split, pairs, print-tag, tag, svg, brightness, svg-style, and polygon. Load this file next:
> (load "svg.lisp")Now let’s write some code that can draw a pretty version of our game board using SVG. First, we’ll want to define some constants that control the various dimensions needed to draw the board:
(defparameter *board-width* 900) (defparameter *board-height* 500)(defparameter *board-scale* 64)
(defparameter *top-offset* 3)
(defparameter *dice-scale* 40)
(defparameter *dot-size* 0.05)
The board width and height will be 900-by-500 pixels, which is a good size for playing a game in a browser on most people’s computer screens. The board scale ![]() represents half the width of a single hex on the screen in pixels. The
represents half the width of a single hex on the screen in pixels. The *top-offset* variable ![]() tells us we want three extra hex heights of free space above the base of the board. We’ll need this because a hex with lot of dice on it will have its dice sticking out, upward, and we need room for these dice to be visible on the screen. The
tells us we want three extra hex heights of free space above the base of the board. We’ll need this because a hex with lot of dice on it will have its dice sticking out, upward, and we need room for these dice to be visible on the screen. The *dice-scale* variable ![]() tells us that a single die will be about 40 pixels tall and wide on the screen. Finally, we set
tells us that a single die will be about 40 pixels tall and wide on the screen. Finally, we set *dot-size* to 0.05, which tells us that each dot will be about 0.05 times the size of a die ![]() .
.
Now we’re ready to write a function that can draw a die. Note that we won’t use bitmaps or anything like that to draw. Instead, we’re drawing a die “the hard way,” by rendering it directly out of raw SVG polygons. Here’s the code:
(mapc (lambda (x y) (polygon (mapcar (lambda (xx yy) (calc-pt (cons (+ x (* xx *dot-size*)) (+ y (* yy *dot-size*))))) '(−1 −1 1 1) '(−1 1 1 −1)) '(255 255 255)))
'(−0.05 0.125 0.3 −0.3 −0.125 0.05 0.2 0.2 0.45 0.45 −0.45 −0.2) '(−0.875 −0.80 −0.725 −0.775 −0.70 −0.625 −0.35 −0.05 −0.45 −0.15 −0.45 −0.05))))
To draw a die, we need to pass in three arguments ![]() . The first two are the x and y position at which the die should appear in the SVG picture. The third is the color we want the die to be. This function will take some liberties with that color and modify it as needed to give the die a little shading.
. The first two are the x and y position at which the die should appear in the SVG picture. The third is the color we want the die to be. This function will take some liberties with that color and modify it as needed to give the die a little shading.
Anything we draw in this function will need to be rendered in a scaled fashion, based on the *dice-scale* constant we defined. Therefore, we first define a local function calc-pt that scales a point for us ![]() . Since we’ll need to draw several scaled polygons, let’s also create a convenience function,
. Since we’ll need to draw several scaled polygons, let’s also create a convenience function, f, that runs calc-pt against all points in a polygon and then draws it by calling the polygon function ![]() .
.
A die in our picture will have three visible faces: the top face, the front face, and the right face. We draw these by calling our function f three times starting here ![]() and using some hard-coded coordinates for the three faces.
and using some hard-coded coordinates for the three faces.
The last thing we need to do is draw the little dots on the faces of the die. We do this by mapcing ![]() the coordinates for the dots
the coordinates for the dots ![]() against a lambda function that can render a dot. This lambda function uses the
against a lambda function that can render a dot. This lambda function uses the *dot-size* variable to scale down a square-shaped polygon that represents each dot on the die face. We could write more sophisticated code to draw circular and/or elliptical dots, but the dots are so small that squares look just fine.
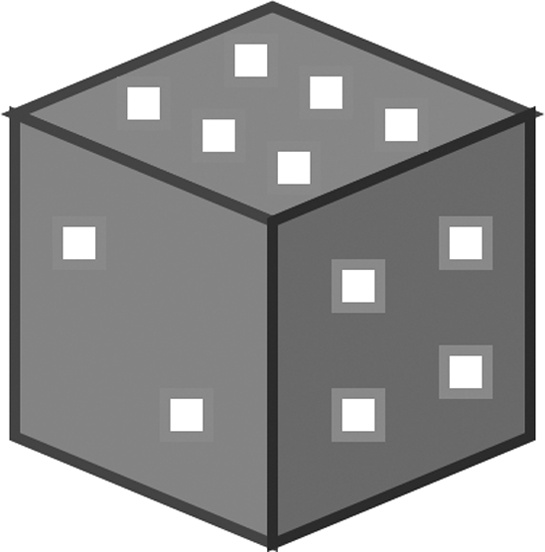
Let’s try drawing a die at x=50 and y=50 with an RGB red (255 0 0) color:
> (svg 100 100 (draw-die-svg 50 50 '(255 0 0)))
<svg xmlns="http://www.w3.org/2000/svg" xmlns
:xlink="http://www.w3.org/1999/xlink" height="100" width="100"><polygon
 points="50,10 26.0,20.0 50,30.0 74.0,20.0 " style="fill:rgb(255,40,40);stroke:rgb
(155,0,0)"></polygon><polygon points="50,30.0 26.0,20.0 26.0,50 50,60.0
" style="fill:rgb(255,0,0);stroke:rgb(155,0,0)"></polygon><polygon points="50,
30.0 74.0,20.0 74.0,50 50,60.0 " style="fill:rgb(215,0,0);
stroke:rgb(115,0,0)"></polygon><polygon points="46.0,
13.0 46.0,17.0 50.0,17.0 50.0,13.0 " style="fill:rgb(255,255,255);stroke:rgb(155,155,
155)"></polygon><polygon points="53.0,16.0 53.0,20.0 57.0,20.0 57.0,16.0
 " style="fill:rgb(255,255,255);stroke:rgb(155,155,155)"></polygon><polygon
 points="60.0,18.999998 60.0,23.0 64.0,23.0 64.0,18.999998 "
 style="fill:rgb(255,255,255);stroke:rgb(155,155,155)"></polygon><polygon
 points="36.0,17.0 36.0,21.000002 40.0,21.000002 40.0,17.0 " style="fill:rgb(255,255,
255);stroke:rgb(155,155,155)"></polygon><polygon points="43.0,20.0 43.0,
24.0 47.0,24.0 47.0,20.0 " style="fill:rgb(255,255,255);stroke:rgb(155,155,155)"><
/polygon><polygon points="50.0,23.0 50.0,27.0 54.0,27.0 54.0,23.0 "
 style="fill:rgb(255,255,255);
stroke:rgb(155,155,155)"></polygon><polygon points="56.0,34.0 56.0,38.0
60.0,38.0 60.0,34.0 " style="fill:rgb(255,255,255);stroke:rgb(155,155,155)"></polygon>
<polygon points="56.0,46.0 56.0,50.0 60.0,50.0 60.0,46.0 "
 style="fill:rgb(255,255,255);stroke:rgb(155,155,155)">
</polygon><polygon points="66.0,30.0 66.0,34.0 70.0,34.0 70.0,30.0 " style=
"fill:rgb(255,255,255);stroke:rgb(155,155,155)"></polygon><polygon
 points="66.0,42.0 66.0,46.0 70.0,46.0 70.0,42.0 " style="fill:rgb
(255,255,255);stroke:rgb(155,155,155)"></polygon><polygon points="30.0,30.0
 30.0,34.0 34.0,34.0 34.0,30.0 " style="fill:rgb(255,255,255);stroke:rgb
(155,155,155)"></polygon><polygon points="40.0,46.0 40.0,50.0 44.0,
50.0 44.0,46.0 " style="fill:rgb(255,255,255);stroke:rgb(155,155,155)"
></polygon></svg>
If you want to see what the final die looks like, just save this gobbledygook to a file named die.svg. Then load the result in Firefox, where you should see the following picture (shown at a blown-up size):
Next, let’s write the function to draw an entire hex tile, including the base and the dice on the tile:
(defun draw-tile-svg (x y pos hex xx yy col chosen-tile)(if (oddp (+ x y z)) −0.3 0.3))) (- yy (* *dice-scale* z 0.8)) col)))
This function takes in a lot of parameters, because a lot of information is encoded in a single tile of the board. You’ll learn the precise meaning of each of these parameters when we draw the board in the next section.
First, our draw-tile-svg function draws the base. To give the base a mild 3D look, we’ll draw it twice, with one level stacked on top of the other. Here ![]() is the loop that draws the two bases. Within that loop, we need to draw a hexagonal polygon
is the loop that draws the two bases. Within that loop, we need to draw a hexagonal polygon ![]() . We map a scaling function across the coordinates so that they are scaled to our
. We map a scaling function across the coordinates so that they are scaled to our *board-scale* variable. Here ![]() you can see the six points of a hexagon in perspective encoded using decimal notation. The color of the base will be brightened slightly if it has been chosen by the player to perform a move. We do this by increasing the brightness of the tile when creating our polygons
you can see the six points of a hexagon in perspective encoded using decimal notation. The color of the base will be brightened slightly if it has been chosen by the player to perform a move. We do this by increasing the brightness of the tile when creating our polygons ![]() .
.
After we’ve finished drawing the tile base, we need to draw the dice that reside on the tile. We do this by looping across the number of dice ![]() and then calling our
and then calling our draw-die-svg function ![]() . When calculating the x and y positions of the dice, we need to perform a bit of scaling math. The most interesting piece of this math is that we shift the dice a bit to the left or right, depending on whether the sum of the x-, y-, and z-coordinates for a given die is odd or even
. When calculating the x and y positions of the dice, we need to perform a bit of scaling math. The most interesting piece of this math is that we shift the dice a bit to the left or right, depending on whether the sum of the x-, y-, and z-coordinates for a given die is odd or even ![]() . This makes the stacks look a little imperfect and will give the stacked dice for the complete board a pleasing, natural appearance.
. This makes the stacks look a little imperfect and will give the stacked dice for the complete board a pleasing, natural appearance.
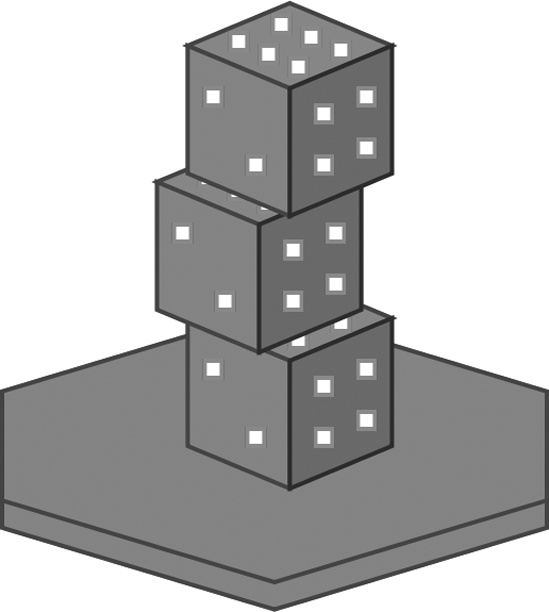
Now let’s call our function to draw a finished tile and see how it looks. Again, just copy the output from this command to a file named something like tile.svg.
> (svg 300 300 (draw-tile-svg 0 0 0 '(0 3) 100 150 '(255 0 0) nil))
<svg xmlns="http://www.w3.org/2000/svg" xmlns:xlink="http://www.w3.org/
1999/xlink" height="300" width="300"><polygon points="36,143.6 100,124.4
 164,143.6 164,169.2 100,188.4 36,169.2 " style="fill:rgb
(255,0,0);stroke:rgb(155,0,0)">
...
Here’s what you should see when looking at the file in Firefox:
Now we’re ready to write a function that draws an entire game board as an SVG. It will be very similar to our draw-board function, which we’ve been using to draw the board to the console. It fulfills the same role, but simply outputs the result as SVG data.
(defparameter *die-colors* '((255 63 63) (63 63 255)))
The draw-board-svg function takes the board as an argument, but also requires two other arguments that will be important for using the picture as the front end of the user interface for our game ![]() . One argument is
. One argument is chosen-tile, which indicates a tile that the player has clicked with the mouse. We’re going to color that tile a bit lighter, so the player can tell that the computer has recognized the selection. Another argument is legal-tiles, which indicates which tiles the player can legally click next.
It so happens that SVG pictures have a feature for web links, which works just like the <a href="..."> hyperlinks in regular HTML. If a tile is a legal tile for the player’s next move, we’ll wrap the SVG for that tile in such a link, making it clickable. Having the legal-tiles parameter lets us know which tiles we want to be clickable.
The draw-board-svg function consists of a couple of nested loops that loop through the y ![]() and
and x ![]() coordinates of the tile board. For each tile, we then define a ton of local variables (using the facility for local variables in the
coordinates of the tile board. For each tile, we then define a ton of local variables (using the facility for local variables in the loop macro introduced in Chapter 10). First, we declare pos ![]() , which indicates the position of current tile in the hex array. Then we fetch that hex. Next, we calculate the pixel coordinates for the tiles, in the variables
, which indicates the position of current tile in the hex array. Then we fetch that hex. Next, we calculate the pixel coordinates for the tiles, in the variables xx and yy. As you can see, the math for these coordinates gets a bit tricky, since the board is drawn in perspective on the screen.
The final local variable we define is col, which will hold the color of the tile and dice in the current spot. We do this by using a list of die colors, which currently holds the colors red (for player A) and blue (for player B). We also darken the color a bit based on the y-coordinate using the brightness function (discussed in Chapter 17). This darkens the rows in the back a bit, adding to the 3D appearance of our SVG game board.
If the current tile is a member of the legal tiles ![]() , we’re going to wrap it in a web link, as mentioned previously. In SVG, this is done with a tag in the form
, we’re going to wrap it in a web link, as mentioned previously. In SVG, this is done with a tag in the form <a xlink:href="...">, which we create here ![]() . Notice that we also wrap each tile in a
. Notice that we also wrap each tile in a <g> tag, which tells the SVG renderer to treat the polygons in this tile as a group. To figure out the actual URL we want to link to, we call the make-game-link function. This function builds an appropriate URL. You’ll understand the format of the URL better once we start writing the code that handles the web server for our game.
Finally, we’re ready to call our draw-tile function ![]() . There are two different versions of the call in our code: one for the hyperlinked version and one for the nonlinked version.
. There are two different versions of the call in our code: one for the hyperlinked version and one for the nonlinked version.
Phew! Now we can finally draw a full game board dynamically, using the SVG format:
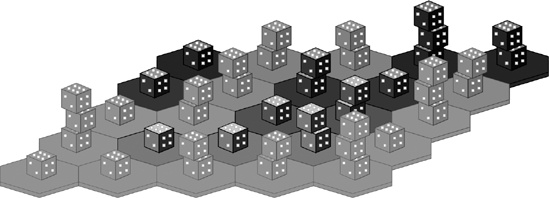
> (svg *board-width* *board-height* (draw-board-svg (gen-board) nil nil))
<svg xmlns="http://www.w3.org/2000/svg" xmlns:xlink="http://www.w3.org/
1999/xlink" height="500" width="900"><polygon points="256,185.6 320,166.4
 384,185.6 384,211.2 320,230.4 256,211.2 "
...
If you save the output to board.svg and load it in Firefox, here is what you should see: