Case Study 4 Exploring Injury Data for Root Causal and Association Analysis
Mary Osborne
Murali Pagolu
Part 2: SAS Enterprise Content Categorization
Introduction
The United States Consumer Product Safety Commission (CPSC) is an independent agency in the United States that regulates the sale and manufacturing of more than 15,000 products in the United States. CPSC conducts research on products in the market and issues bans or recalls on unsafe products from use to prevent potential hazards. Consumers use the CPSC hotline or their website to report injuries, incidents or issues concerning the safety of products. In addition to these, CPSC operates the National Electronic Injury Surveillance System (NEISS), which collects Emergency Room data from 100 hospitals and use that data to calculate probabilistic national estimates.
Objective
In this case study, we attempt to explore, explain and analyze consumer complaints from the National Electronic Injury Surveillance System using SAS® Text Miner and SAS® Enterprise Content Categorization Studio. Through this analysis you can solve the following business problems and help to improve the search in a public records database about injuries:
1. Determine the types of injuries sustained by people.
2. Examine which actions lead to which types of injuries.
3. Identify which products are specifically associated with which type of injuries.
Data Description
For this case study, data is extracted from NEISS online query system containing consumer reported injury data. The following SAS data sets are provided to you for this case study.
Neiss_school.sas7bdat – Data related to injuries and issues associated with Falls/Falling
Neiss_sports.sas7bdat – Data related to injuries and issues associated with Sports
Neiss_swallow.sas7bdat – Data related to injuries and issues associated with swallowing products
These data sets are available in the folder Case Studies ▸ Case Study 4. See the website for this book. In addition to these data sets, we have also provided you with the raw files for each of these injury categories. SAS® Content Categorization project ‘CPSC_CC’ and SAS® Enterprise Miner project ‘CPSC’ are also made available in this folder for your reference.
Step-by-Step Instructions
Part 1: SAS Text Miner
1. Copy the folder Case Study 4 to a location on your PC (e.g., D:).
2. Launch SAS® Enterprise Miner and create a new project and name it ‘CPSC’. Enter the SAS code shown below in the project start up code and click ‘Run now’ to assign ‘Data’ library.
libname CPSC “D:Case Study 4”;
3. Create three diagrams ‘school’, ‘sports’ and ‘swallow’ in the new project, one for each data set to explore and analyze them individually. Register all the data sets specified in Step 1 with default roles assigned by the SAS® Enterprise Miner data source wizard.
4. Open the diagram ‘school’ and drag and drop the data source ‘neiss_school’ into the diagram. Also, drag and drop ‘text parsing’, ‘text filter’ and ‘text topic’ nodes into the diagram and connect them in a sequence as shown in Display C4.1 below. Right click on the ‘Text Topic’ node and choose ‘Run’.
Display C4.1: Text mining process flow to analyze NEISS complaints related to ‘schools’

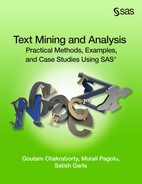
5. Click on the ellipsis button next to ‘Filter Viewer’ under ‘Results’ in the properties panel for ‘Text Filter’ node to open ‘interactive filter viewer’. Within the Terms pane, you will find all the terms parsed by the text parsing node and subsequently chosen to be dropped/kept for further analysis by the ‘Text Filter’ node. Sort the list by the ‘TERM’ column and choose the row with “+fall” and click on the “+” next to the term fall. The list will expand and you can see all the verb forms of “fall” (See Display C4.2). Instead of counting these as separate terms, they are treated as the same term for the purposes of analysis. You can also see two words “fall” in separate entries, but they are of the roles noun and adjective, respectively. In addition to these, you can also see a term ‘fal’ which is most probably misspelt and should have been the same term fall. Hence, both ‘fal’ and ‘fall’ should be considered as synonyms though one of these terms is misspelled.
Display C4.2: Partial screenshot of expanded “fall” term in interactive filter viewer
6. Repeat Step 5 for the word “+head” and you can see the number of documents in which the term ‘heads’ is found to be lot lesser compared to the term ‘head’ (See Display C4.3). This may indicate that accidents involving two or more heads such as bumping heads is less likely to occur than accidents involving s a single head.
Display C4.3: Partial screenshot of expanded term “head” in interactive filter viewer

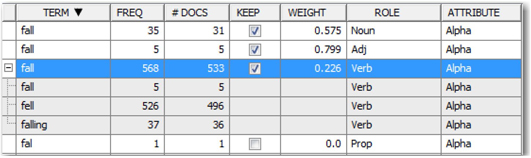
7. As you found in Step 5, there are many terms which are misspelled in the documents. Hence, the individual term frequency (FREQ) is not accurate since the misspelled terms attribute to noise in the data. The ‘Text Filter’ node offers a spell check feature to suggest the correct spellings of misspelled words. To enable spell check in the ‘Text Filter’ node, choose ‘Yes’ for the property “Check Spelling” and select an english dictionary in the ‘Text Filter’ properties (Display C4.4). For this case study, we have provided you a SAS data set (engdict. sas7bdat) pre-built with english words to serve as a dictionary. Copy this data set to the same location as you have used for creating a library in Sstep 2. Click on the ellipsis button next to ‘Dictionary’ and browse through the library CPSC to select the dictionary data set.
Display C4.4: Properties in Text Filter node to enable spell check
Once you choose the spell check options and rerun the ‘Text Filter’ node, the results of the spell check are stored in the data set specified against ‘Spell-Checking Results’ property under the Results section (Display C4.4). In this case, EMWS1 is the name of the workspace folder/library specific to this diagram and ‘Text Filter_spellDS’ is the name of the data set which contains these results.
8. Navigate to the following path based on the Enterprise Miner project location that you chose to create this project.
<….EMProject Location…>WorkspacesEMWS1
Make a copy of ‘TextFilter_spellDS.sas7bdat’ data set in the same location as the CPSC library.
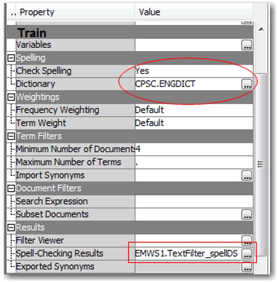
9. Go to the folder representing the CPSC library, right click on this data set and choose ‘Open with SAS X’ (where X is the version of SAS installed on your machine) to open it in Base SAS. By default the data set is opened in browse mode (Display C4.5). From the menu options, select Edit ▸ Edit mode. This will enable you to edit the entries in the data set. In the data set you will find that the incorrectly spelled words are caught by the spell checker and correct spellings are suggested (See Display C4.5). However, there may be some words which are appropriate in their original form and spell check is not required.
Display C4.5: Output data set created as a result of using spell check in the Text Filter node
For example, terms such as 86yof means ’86 year old female’ when describing the age and gender of the person injured/affected. However, in this case the spell checker suggested that the correct form should be 8yof meaning ‘8 year old female’ and this is not correct. Hence, you need to delete such mistakenly corrected entries from the data set manually. For the purpose of this case study, we provided you the cleaned data set (textfilter_synonyms_school.sas7bdat).
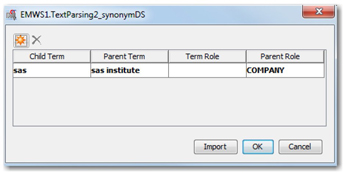
10. The results of spell checking can be used as a preliminary synonyms list for the purposes of parsing the text. By doing this, all those misspelled terms will be treated as synonyms with the correctly spelled word forms giving accurate calculation of unique term frequency. This is the most critical input for deriving text topics in further steps. By default, you will see ‘SASHELP.ENGSYNMS’ as the synonyms data set in this node. Click on the ellipsis button next to the ‘Synonyms’ property to open the ENGSYNMS data set in a pop-up window (Display C4.6). As you can see, it has only one entry for ‘sas’ representing ‘sas institute’ in it.
Display C4.6: Window showing the current synonyms list (data set)
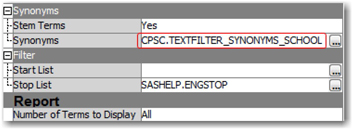
Now, click on the ‘Import’ button to browse through the library ‘CPSC’ and select the cleaned synonyms list specific to the schools data ‘textfilter_synonyms_school.sas7bdat’. You can see the synonyms data set changed in the properties panel for the ‘Text parsing’ node (Display C4.7). Now that you have new synonyms listed for this diagram, you need to rerun the text parsing and text filtering processes again to pickup the changes. Right click on ‘Text Filter’ node and select ‘Run’.
Display C4.7: Properties in Text Parsing node to provide Synonyms data set
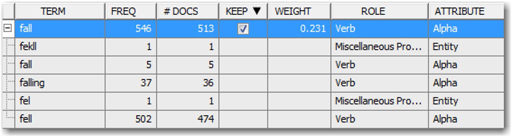
11. Open the ‘Filter Viewer’ in the Text Filter node again after you have rerun the process as described in the previous step. Expand the term ‘+fall’ again and you should find that the misspelled words such as ‘fal’ and ‘fekll’ are treated as synonyms with its root word ‘fall’ (Display C4.8). This is one of the best ways to quickly collect the synonyms list to use in stemming a lot of terms to their root forms when misspelled.
Display C4.8: Properties in Text Parsing node to provide Synonyms data set
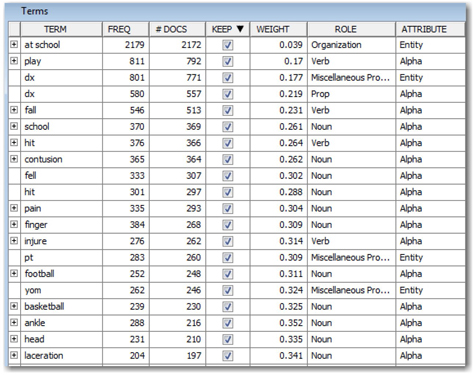
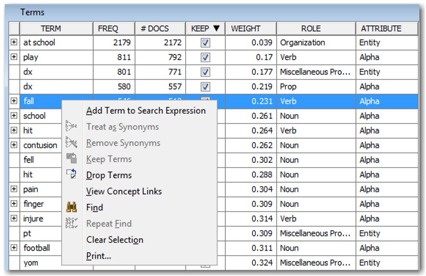
12. You can also use the Terms pane to understand what are the keywords that are associated with specific types of accidents at school (See Display C4.9). For example, verb terms such as “hits” or “play” are useful to describe the cause of injury. Medical terms such as “laceration” and “contusion” can also help to understand types of injuries. Abbreviated terms such as “yom” and “yof” represent year-old-male and female, respectively. Even though these terms are unique to this set of documents, SAS® Text Miner understands the terms that are important and also identify their parts of speech (proper noun).
Display C4.9: Key terms retained by the text filter node based on the term weights
13. Next explore the links between these words. Select “+fall” from the terms list. Right-click and select “View Concept Links” to open up the concept linking diagram (See Display C4.10). Concept links helps in explorative analysis of the data and shows how strongly certain terms are associated with other terms. This step can help to understand how various subjects/themes are discussed in the corpus of documents. These results can provide as input to formulate initial business and linguistic rules to further strengthen the classification schemes.
Display C4.10: Partial screenshot of terms list showing how to open concept linking diagram
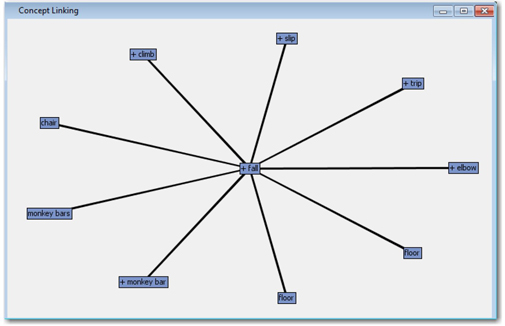
14. In the concept link diagram, the selected term appears at the center of the tree, surrounded by the terms that are most highly associated with that term (See Display C4.11). The width of the lines in the display represents the strength of association between terms; a thicker line indicates a stronger association. If you position the mouse pointer over a term, then a tooltip shows two numbers, separated by a forward slash (/). The first number is the number of documents in which the term appears with its immediate predecessor in the display. The second number represents the total number of documents in which the term occurs in the document collection.
In this example, you can see two things that SAS® Text Miner can do to help you initially explore the data. You can see that the software created some noun groups, or multi-word phrases, such as “+monkey bar”. You can also begin to see some evidence that some falls involve things like monkeybars and floors. You can move the diagram around to help make it easier to see the words on the screen. By clicking anywhere on the screen and moving the mouse, the diagram also moves.
Display C4.11: Concept linking diagram showing terms associated with “+fall”
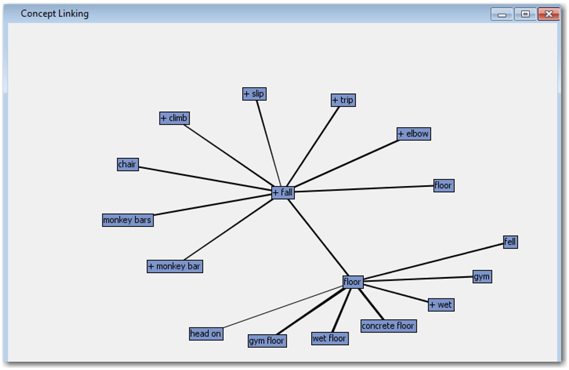
15. You can also learn more about falls by double-clicking on the words linked to “fall” to see their associated links. Double-click on “floor” to find the words most associated with falls on floor. As you can see there are two terms showing up here for ‘floor’. One term represents ‘floor’ as a noun and another represents a verb. Move your pointer over to both these terms in the diagram and verify which one shows the highest frequency. Double-click on the one which has more frequency and it will show more terms linked to ‘floor’. These terms explain that the hits on heads are due to slippery floor when wet (See Display C4.12). Based on the thickness of the bars connecting the terms, you can find that more incidents are occuring on concrete, wet, and gym floors. Close the interactive filter viewer by pressing the X at the top and do not save changes.
Display C4.12: Concept linking diagram showing terms associated with “floor”
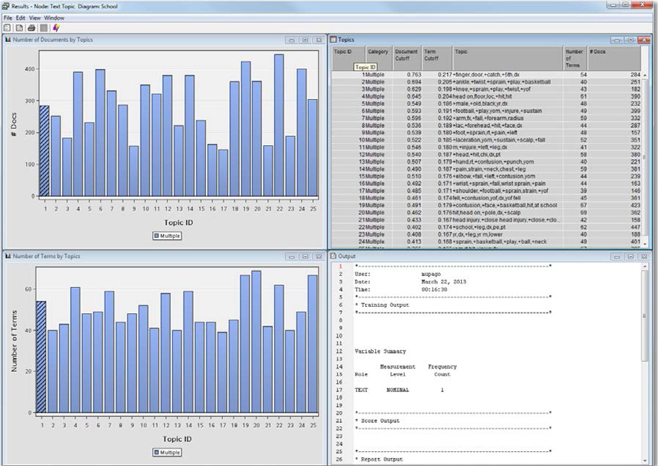
16. The Text Topic node is useful for assigning documents to multiple topics. It also has the nice feature of enabling you to explore how the different topics relate to the individual documents. This can be useful if you are trying to build a taxonomy, or classification scheme, to ensure documents are classified correctly or people can search and retrieve relevant information. Right-click on the Text Topic node and click ‘Run.’ Once the node has completed its run successfully, click “Results.” You will see four panes in the window (See Display C4.13).
The Topics pane shows the keywords associated with each topic. The Number of Documents by Topics pane shows how many documents are classified with each topic. The Number of Terms by Topics pane shows how many terms from the Terms List are associated with each topic. There is also an Output pane with SAS output. Click on the first row in the Topics pane. This will cause the bars associated with that cluster to be marked in the other two non-output panes. The first Text Topic involves problems surrounding finger cuts in doors. Highlight the second topic and you will find that it seems to be about ankle sprains while playing basketball.
Display C4.13: Results from Text Topic node for NEISS data related to ‘School’
This process is about trying to determine just which keywords are used and how they indicate which topics. This is one way to begin building a taxonomy, which will be discussed in-detail in the SAS® Enterprise Content Categorization section. Close the Results window for the Text Topics, minimize Text Miner and bring up Content Categorization.
Note: You may repeat this entire process for the other two categories ‘swallow’ and ‘sports’ in separate EM diagrams following Steps 4 through 16. This way, you should be able to identify key topics/themes for all the three categories to help build a taxonomy in the next step.
Part 2: SAS Enterprise Content Categorization
SAS® Enterprise Content Categorization is used to organize and classify documents into different topic areas based upon certain features in the documents. In order to classify documents, the user has to define certain rules for each topic. This example focuses on a user-written taxonomy (or classification scheme) based upon the initial text mining results.
1. Launch SAS® Enterprise Content Categorization Studio and create a new project, name it ‘CPSC_CC’. Right click on ‘CPSC_CC’ within the taxonomy pane and click ‘Add Language’. Select ‘English’ as the language and click Ok.
2. Right click on ‘English’ and select the option ‘Create Categorizer from Directories’. Browse to the location on your PC where you have copied the folder ‘docs’ that we provided you for this case study. Navigate to that folder and click OK to create those categories based on the folder structure (See Display 14). The three categories, sports, swallowing, and school are created based on those three folders. For each of these categories, you can start creating subcategories that fit well with these categories. As a next step you can write Boolean rules to help define what goes into each subcategory based on the topics discovered using SAS® Text Miner in the first part of this case study.
Display C4.14: Partial screen capture of categories and topical sub-categories
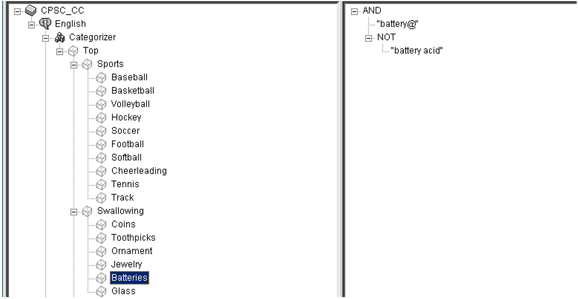
For example, you can include various forms of the word “battery” to tag documents as being about batteries. The “@” sign at the end of the word is a type of wildcard that accounts for the various expansions of the word “battery”. By having the “NOT” clause with the phrase “battery acid” you can exclude documents that involve battery acid.
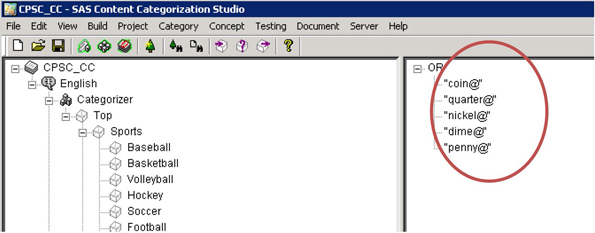
3. Click on “Coins” underneath “Swallowing” in the taxonomy pane. Enter the key terms that represent various types of US metallic currency and the word “coin”. Because of the @ sign at the end of each term, the plural forms of the terms are captured (See Display C4.15).
Display C4.15: Boolean rules for the subcategory ‘Coins’
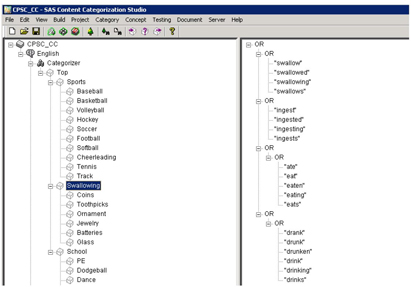
4. Click on “Swallowing” in the taxonomy pane. Include various synonyms for “swallow” in the taxonomy, such as ingest, eat, and drink (See Display C4.16).
Display C4.16: Boolean rules for the category ‘swallowing’
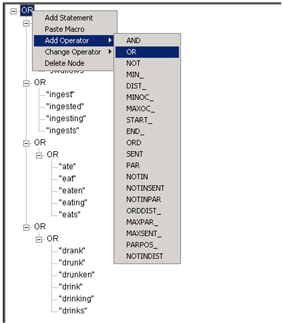
Underneath the topmost “OR” in the rules pane, right-click and select “Add Operator | OR” (Display C4.17).
Display C4.17: List of Boolean Operators available at the root node in a category
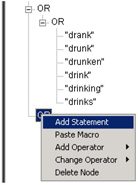
Now click on the new “OR” at the bottom and select “Add Statement” (See Display C4.18).
Display C4.18: ‘Add statement’ option used to add a new rule
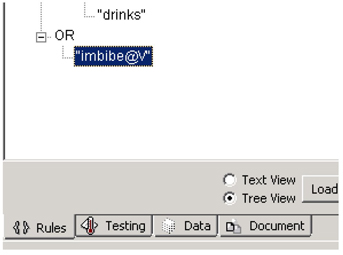
Type in “imbibe@v” here and it will add in all the verb conjugations of the term imbibe, such as ‘imbibing’ and ‘imbibed’ (See Display C4.19). Similarly, you can wildcard on specific parts of speech, such as nouns or adjectives if required.
Display C4.19: Added Boolean rule to the existing rules set for the ‘Swallowing’ category
5. Similarly, write the boolean rules based on the topic terms extracted for all categories and sub-categories. You may open the content categorization project ‘CPSC_CC.tk’ that we have provided you to understand how to write these rules.
6. Set up the testing paths for all the categories and their sub-categories as shown in Table C4.1 below. Clear the training path if populated since it is not required. Switch to the Testing Tab while having the “Swallowing” node highlighted. This tab is next to the Rules tab. Click TEST at the top. This will prompt you that categorizer is not up to date and needs to be rebuilt. Click Yes. After the Categorizer is rebuilt, click TEST again.
Table C4.1: Testing Paths by section category for categorizer
| Category | Testing Path |
| Sports | D:Case Study 5CPSCdocsSports |
| Swallowing | D: Case Study 5CPSCdocsSwallowing |
| School | D: Case Study 5CPSCdocsSchool |
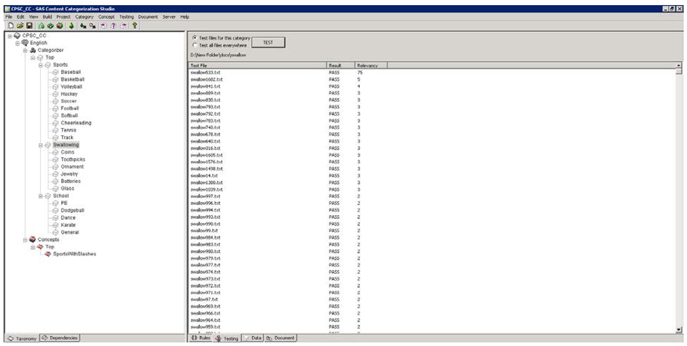
7. The Testing tab gives the analyst an initial idea of how rules are working by checking for either the specified rule or all rules for a set of documents. In the testing pane there are three columns: the Test File, the Result, and the Relevancy. The test file lists the individual document tested. The Result here indicates whether the categorization rules made a PASS or FAIL on the document (See Display C4.20). Passing here is defined as having at least one example of a rule trigger within a document. The Relevancy shows the number of rule hits and whether or not the number of hits falls above a certain threshold. In this case, the project is set up to only look at the frequency of the hits, and the threshold is set to a single hit for a document to be ‘relevant’ or PASS. You may modify the category to account for factors such as document length, establishing minimum thresholds, weighing parts of the document more than others, and even weighing certain nodes of the taxonomy more than others.
Display C4.20: Results from Testing Tab for ‘Swallowing’ category
Scroll down the testing results and you will find that some reviews do not mention the “swallowing” issue. These are the documents that have a result of FAIL. These documents are all about incidents where someone swallowed something. Some of the documents fail because there are other ways to say swallow that have not yet been included in the rules (such as ‘ingestion’), but another reason is that some documents are simply misclassified as being about “swallowing”. A common finding in text analytics is that the unstructured data can disagree with the structured data at times. An analyst can use text analytics to validate structured data, find emerging issues, and enhance modeling for events.
8. Double click on a document (say swallow889.txt) and this will automatically open up the Document tab (fourth on bottom). There you can see how the individual rules (highlighted in red) are triggering a category match for this particular document (See Display C4.21). Ingested, Eating, and Swallowed are the rules which triggered a match on this document.
Display C4.21: Rules triggering the ‘Swallowing’ category match for a document
![]()
Once you have reviewed the results in the “Testing” tab, you may go back to the “Rules” tab and modify the rules to include more terms such as ‘ingestion’. Thus you can understand that the taxonomy creation is an iterative process. As the language evolves over time you will probably need to add new words or phrases to the taxonomy to ensure that you properly capture information of interest.
Note: For your reference we have provided you the SAS Content Categorization Studio project CPSC_CC.tk which you can open and verify the Boolean rules that are pre-built for all the three categories and their sub-categories. You may need to change the testing paths to ensure they are pointing to the correct folders/files on your machine.
Summary
• SAS® Text Miner and SAS® Enterprise Content Categorization Studio can be used together to complement each other’s unique linguistic capabilities for the purpose of exploring, analyzing, and extracting valuable information from textual data.
• The spell check feature in the text filter node can be utilized to provide the preliminary synonyms list for parsing the content and stemming terms. By following this method, you can significantly reduce the time required to verify misspelled words and accurately generate the term-by-document frequency occurrence matrix which is critical for deriving text topics.
• The Interactive filter viewer in the text filter node helps you to identify the most important terms in a document corpus without spending significant effort. Important terms are retained and unimportant terms are dropped automatically by the software based on their frequency of occurrence both within a document and the entire corpus.
• The Text topic node automatically generates the key terms/themes that are significant in defining the document collection at a very high level. These results can help you understand different areas of causes/concerns in the data without digging through each document. They are also pivotal in helping you build the taxonomy to classify the document collection based on type of injury/cause of injury.
• Content Categorizer in SAS® Enterprise Content Categorization Studio provides an easy-to-use graphical interface to quickly build a Boolean rule based model to identify and classify documents in various categories and sub-categories. The point and click feature helps you to avoid writing those rules in the syntax that the tool understands.