
Case Study 5 Enhancing Predictive Models Using Textual Data
Maheshwar Nareddy
Goutam Chakraborty
While text mining customer responses can reveal valuable insights about a customer, plugging the results from text mining into a typical data mining model can often significantly improve the predictive power of the model. Organizations often want to use customer responses captured in the form of text via emails, customer survey questionnaires, and feedback on websites for building better predictive models. One way of doing this will be to apply text mining to reveal groups (or, clusters) of customers with similar responses or feedback. This cluster membership information about each customer may then be used as an input variable to augment the data mining model. With this additional information, the accuracy of a predictive model can improve significantly.
The data used in this case study is hypothetical. But, it is created based on a real data set of a client company (Fuel Stop Company with 300+ gas stations in the US). Some of the text comments, variable names, and descriptions have been disguised to protect the identity of the client company.
The hypothetical case involves customers calling the fuel company’s call center for many different reasons. Customers’ comments via phone were captured by call-center reps and typed into a form. These comments were later merged with numeric variables from the fuel company’s database about these customers (by matching them via the company’s loyalty card number).
Data Description
The merged data set (survey_text_and_numeric) is used in this case study. The data set is available in the Case Studies ▸ Case Study 5 folder of the data provided with the book. The purpose of this case study is to demonstrate how the use of textual data in conjunction with numeric data in a predictive model improves the performance of the predictive model.
Step-by-Step Instructions
1. Create a SAS® Enterprise Miner project and a diagram within the project.
2. Create a library to point to a folder where the data set is located. Add the data source, survey_text_and_numeric, to the project (via your library).
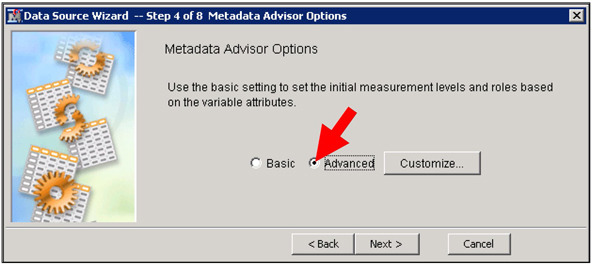
3. In Step 4, ensure that you use Advanced Metadata Advisor Options as shown in Display C5.1.
Display C5.1 Data Source creation
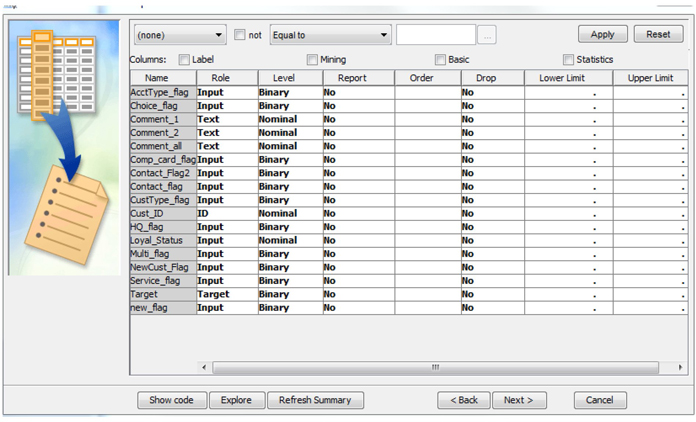
4. The variable roles and levels should be as shown in Display C5.2.
Display C5.2 Data source creation: Variable properties
5. Click through and finish the next data creation steps by accepting the default options.
6. Drag the survey_text_and_numeric data to the diagram space.
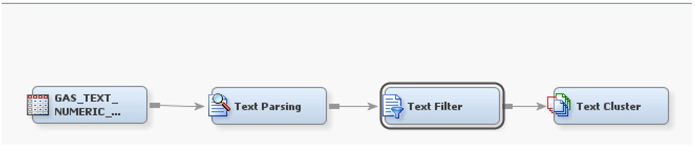
7. Add a text parsing node, text filter node, and text cluster node, as shown in Display C5.3.
Display C5.3 Process flow
8. Right-click on the text parsing node and select ‘Edit Variables’. Change the ‘Use’ field of Comment_1 and Comment_2 to “No,” as shown in Display C5.4.
Display C5.4 Text Parsing node input variables screen
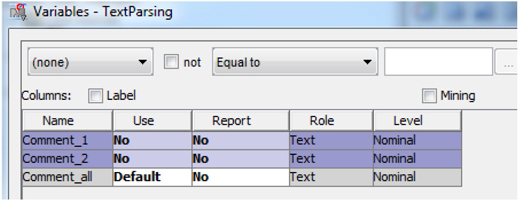
In this case study, you are using all of the comments together to text clusters. It is, however, possible to create clusters separately for Comment_1 and Comment_2, and you should explore that on your own.
9. Run the flow from the Text Cluster node. Examine results.
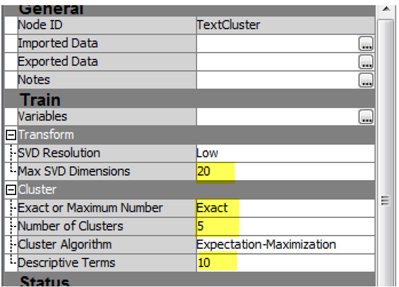
You will find that there are many small clusters with few observations. This is not surprising, given the small data set. As a demonstration, you can ask text miner to create a maximum of 20 SVD dimensions and exactly 5 clusters, then describe those clusters using 10 terms.
10. Make changes in the properties panel of the Text Cluster node, as highlighted in Display C5.5.
Display C5.5 Text Cluster node property panel
11. Run the cluster node and examine results.
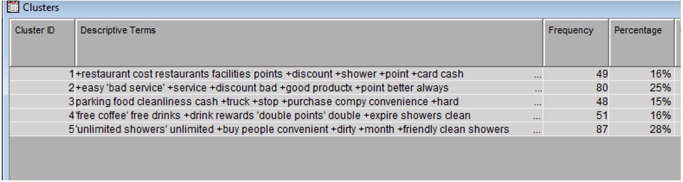
It appears that five clusters with reasonable number of observations per clusters have been created by text cluster node as shown in Display C5.6. You should explore the cluster solution to get a feel for what these clusters might represent. Optionally, you may use a Segment Profile node to profile these clusters using the numeric variables available in the data.
Display C5.6 Clusters frequencies and descriptive terms
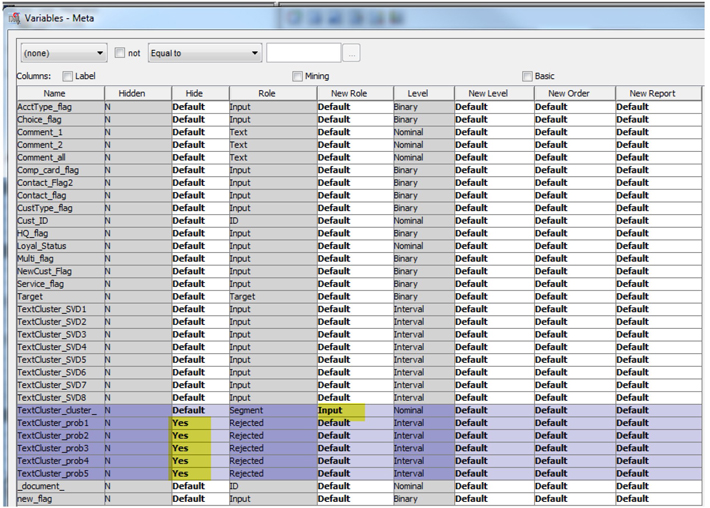
12. Add a Metadata Node to the diagram and connect it to Text Cluster node. Click on the ellipsis button next to Training in the Variables section of the Property panel of the Metadata node. Then, make changes as shown in Display C5.7.
Display C5.7 Metadata node – Train variables
13. Drag a Data Partition tool from the Sample Tools palette into the diagram workspace and connect it with the Metadata node.
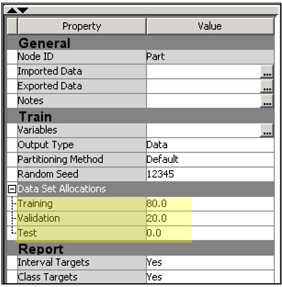
14. In the Property panel of the Data Partition, change Training to 80, and Validation o 20, and Testto 0 as shown in Display C5.8.
Display C5.8 Data Partition node property panel
15. From the Model tab, drag a regression node and connect it to the data partition node. Rename the regression node as Numeric Only (Reg).
16. Right-click the Numeric Only (Reg) node and select Edit Variables.
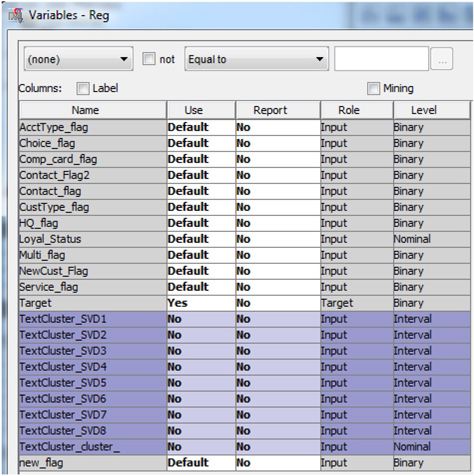
17. Change the Use role of all cluster variables to No as shown in Display C5.9. Then, click OK.
Display C5.9 Regression node (Numeric Only) – Input Variables
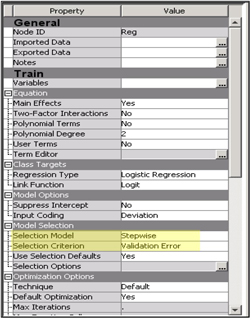
18. In the properties panel of the regression node, change Selection Model to Stepwise and Selection Criterion to Validation Error, as shown in Display C5.10.
Display C5.10 Regression node property panel
19. In the diagram space, right-click the Numeric Only (Reg) node and select Copy, and then right-click on the diagram workspace and select Paste. Change the name of the pasted node to Numeric & Text (Reg) and connect it with the data partition node.
20. Right-click the Numeric & Text (Reg) node and select Edit Variables.
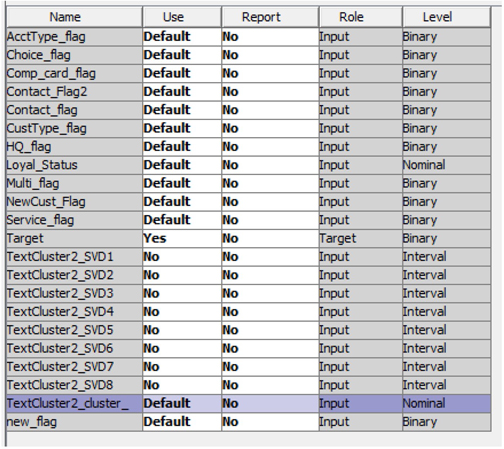
21. Change the Use role of the cluster membership variable from “No” to Default, as shown in Display C5.11. Then click OK.
Display C5.11 Regression node (Numeric and Text) – Input variables
22. In the diagram space, copy and paste the Numeric Only (Reg) node. Change the name of the pasted node to Numeric & SVD (Reg) and connect it with the data partition node.
23. Right-click the Numeric & SVD (Reg) node and select Edit Variables.
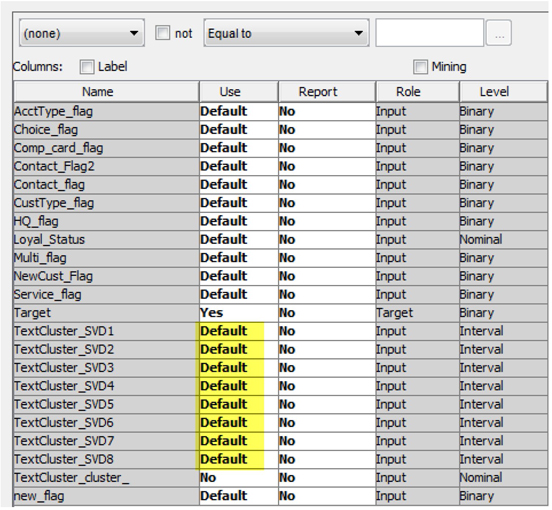
24. Change the Use role of the SVD variables from “No” to Default, as shown in Display C5.12. Then, click OK.
Display C5.12 Regression node (SVDs) – Input variables
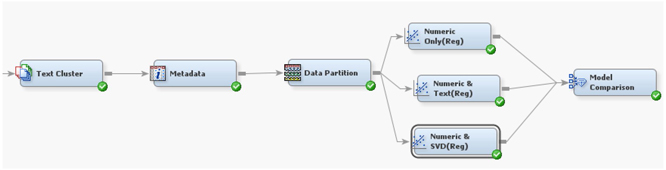
25. Drag a Model Comparison node from the Assess tab and connect it with all of the Regression nodes, as shown in Display C5.13.
Display C5.13 Process flow
26. Right-click the Model Comparison node and run it. Examine the results.
Display C5.14 Model comparision node results
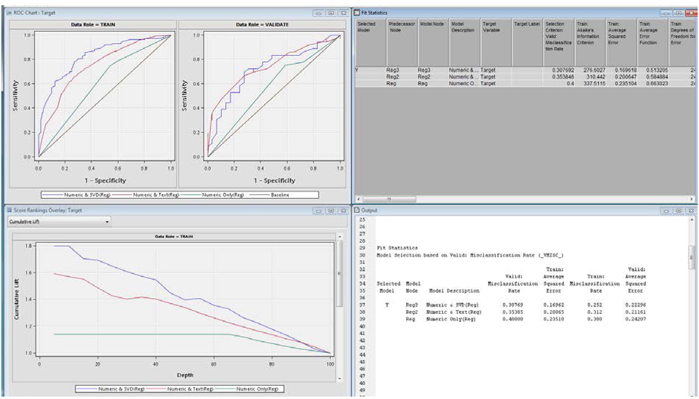
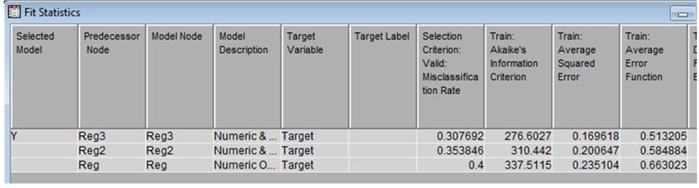
Notice that (Display C5.15) the Numeric & SVD (Reg) model has clearly outperformed the Numeric and Txt(Reg) model, which has outperformed the Numeric Only (Reg) model in model misclassification rate in validation data.
Display C5.15 Model Fit Statistics from model comparison node
Thus, addition of SVDS or text clusters has improved the predictive ability of the model over a model that has only numeric variables. Interestingly, if you explore the results from each regression node, you will find that more numeric variables are playing significant roles in the predictive models when text clusters or text SVDS are included in the model.
Summary
This is a quick demonstration using real-world data to show the improvement in predictive model performance by including textual comments. Unstructured data is powerful in providing a complete view of business processes and outcomes. Text mining results in various forms (SVDs, cluster memberships, text topics) that can be easily plugged into a predictive model and used as inputs. This capability will provide companies’ unlimited opportunity to utilize the insights extracted from unstructured data in order to achieve better lift and accuracy in predictive models. SAS® Enterprise Miner makes this process relatively easy by allowing modeling nodes and text mining nodes to co-exist in one store.