Case Study 3 Features-based Sentiment Analysis of Customer Reviews
Jiawen Liu
Mantosh Sarkar
Goutam Chakraborty
Text Mining for Negative App Reviews
Text Mining for Positive App Reviews
Introduction
Sentiment analysis, (also called sentiment or opinion mining), is a popular technique for summarizing and analyzing consumers’ textual reviews about products and services. Feature-based sentiment analysis is used to reveal customers’ sentiments not just at the overall product/brand level but also at the product/service specific feature level. There are two major approaches for performing sentiment analysis in SAS® Sentiment Analysis Studio: Statistical model-based approaches and Natural Language Processing (NLP) based approaches. In this case study we demonstrate both of these approaches.
With the rapid evolution and growth of mobile devices, mobile products and services have become “must haves” in our lives. Every day new mobile products and services, often with different features or attributes, are entering the market. Consumers often write online reviews of these products and services and make comments not just about their overall sentiment about such products and services but also about which feature or attribute of each product/service they like or dislike. In this case study, we use both SAS® Text Miner and SAS® Sentiment Analysis Studio to perform sentiment mining. For this purpose, we use artificial data created based on actual online customer reviews of apps for mobile devices.
Data
We modified and anonymized six hundred actual customer reviews posted online and created an artificial data set. Five hundred of these reviews are used for building models, and the remaining one hundred reviews are used for testing models. Raw textual data has been categorized into positive and negative groups based on 5-star numerical ratings given by the same consumers who posted those review comments on the site. Comments with ratings greater than or equal to 4 stars are considered as positive and less than or equal to 2 stars are considered as negative for the purpose of this case study. The comments with ratings in between 2 and 4 were excluded in this analysis. For modeling, we have two data sets for text mining, and two directories (folders) for sentiment mining as described below.
Text Mining data sets:
• Negative reviews: APP_TMmodelAPP_neg.sas7bdat
• Positive reviews: APP_TMmodelAPP_pos.sas7bdat
Sentiment Mining Model Data Folders:
• Negative reviews in folder: APPAPP_SMmodel eg
• Positive reviews in folder: APPAPP_SMmodelpos
For testing sentiment mining models, you have two directories that contain positive and negative documents.
Sentiment Mining Test Data Folders:
• Negative reviews in folder: APPAPP_SM est eg
• Positive reviews in folder: APPAPP_SM estpos
The above mentioned data sets and documents are available in the folder Case Studies ▸ Case Study 3 in the data provided with this book. See the website for this book.
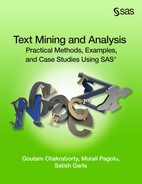
Display C3.1 illustrates a detailed flow chart of the steps involved in our analysis. In the following section, we present the details of the techniques applied in this case study.
Display C3.1 Feature-based NLP Sentiment Mining flow chart
Text Mining for Negative App Reviews
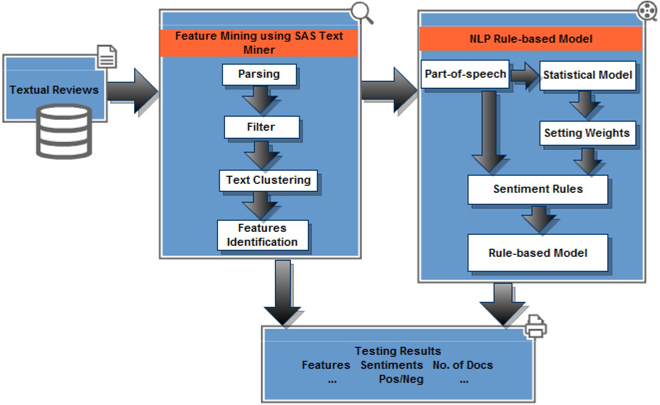
1. Open SAS Enterprise Miner 12.1 and create a new project. Create a new library pointing to the folder (Case Studies ▸ Case Study 3 ▸ APP_TM ▸ model) that contains input data sets for text mining models (App_neg.sas7bdat and App_pos.sas7bdat). Create two data sources with the two data sets in the library that you created. Set up data roles and levels as shown in Display C3.2. Each data set has two columns, “id” and “text”. Column “id” is a unique nominal variable to uniquely identify each textual comment. Column “text” contains the textual comment.
Display C3.2 Column roles and levels information
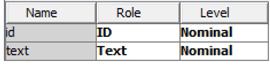
2. Create a diagram and name it “product_TM”. Drag the negative review data source (APP_NEG) into the diagram workspace. Add “Text Parsing”, “Text Filter”, “Text Topic”, and “Text Cluster” nodes to the diagram and connect them as shown in Display C3.3. All of these nodes are run with default options unless specifically mentioned below.
Display C3.3 Process Flow Diagram in SAS® Text Miner 12.1
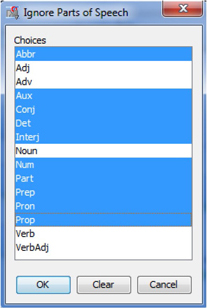
3. In the “Text Parsing” node, find the “Ignore Parts of Speech” option on the properties panel and click the ellipsis button. Hold “Crtl” key on your keyboard and select abbr, aux, conj, det, interj, num, part, prep, pron, and prop (Display C3.4). Click “OK” to save and exit.
Display C3.4 Parts of Speech Ignore List
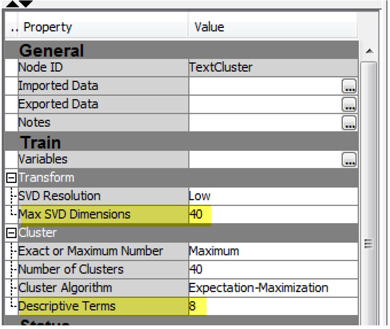
4. Text clustering is used for unsupervised grouping of text documents. In the properties panel of the “Text Cluster” node (Display C3.5), change the value of “Max SVD Dimensions” to 40. Singular Value Decomposition (SVD) is used to reduce dimensionality by transforming the term-by-document frequency matrix into a lower dimensional form. Smaller values of k (2 to 50) are thought to generate better results for text clustering using short textual comments such as the ones used in this case study. Also, change the value of the property “Descriptive Terms” to 8. This setting ensures that eight terms are displayed to describe each cluster in the results.
Display C3.5 Text cluster node property panel
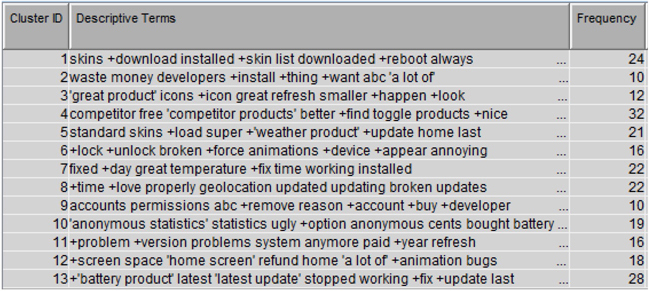
5. Right click on “Text Cluster” node and click “Run”. After the run completion, click “Results” on the pop-up window. Display C3.6 shows the results from text clustering. Thirteen clusters are generated. Each cluster has a fair number of documents. The descriptive terms as shown in Display C3.6 for each cluster give us a sense of what terms are defining each of those clusters.
Display C3.6 Cluster results
6. From step 5 you got a basic idea of how consumers may be using this product and some of the features of this product. In this step, you will run the text topic node to get deeper insights about topics of conversation and features mentioned in those topics.
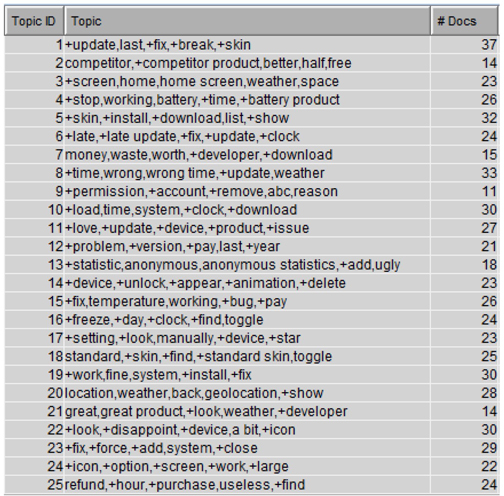
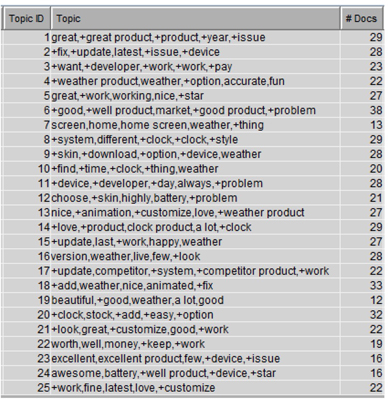
7. Right-click on the “Text Topic” node and select “Run”. It will run the node with default settings. After the run is complete, click “Results”. In the results window, maximize the “Topics” window and you can see the list of topics generated (Display C3.7). From Display C3.7, you can see that features such as “Weather”, “Update”, “Time/ Clock”, or “Money/ Price” appear several times in the twenty-five topics generated. Using the results from text clustering modify and customize the topics to narrow down these to a handful of relevant topics.
Display C3.7 Text topic results obtained using default settings
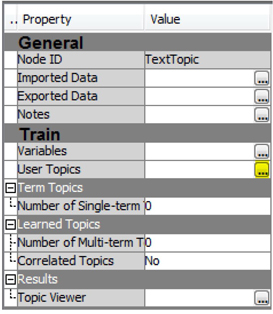
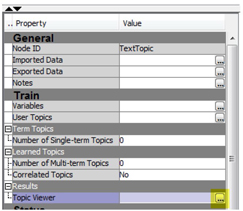
8. In this step you can create customized “User Topics”. Right-click and rename the current text topic node as a Text Topic (Default). Then add another text topic node and attach it to the text filter node. Right-click and rename this as a Text Topic (Custom). In the properties panel of the “Text Topic (Custom)” node, change the value of “Number of Multi-term topics” to “0”, because you want to generate customized user topics and you do not want SAS Enterprise Miner 12.1 to do this for you automatically. Click the ellipsis button (highlighted) next to “User Topics” as shown in Display C3.8.
Display C3.8 Text topic node property panel
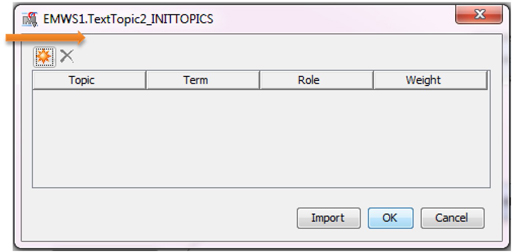
9. In the pop-up window (See Display C3.9), you can create custom topics of your interest. To add a new topic, click on the orange sun icon (pointed arrow); to delete an existing and unwanted item, highlight the row you want to remove, and then click delete icon.
Display C3.9 User topics workspace
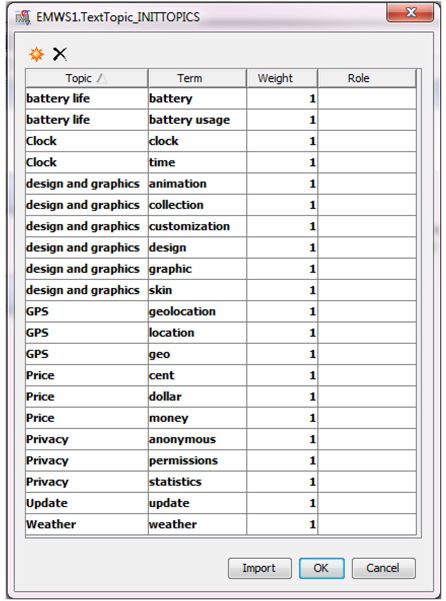
10. For negative reviews, you will create eight customized topics. Add topics as shown in Display C3.10. In this window, all rows for the same topic value represent a unique topic; For example, “battery” and “battery usage” are values for the topic “battery life”. “Weight” indicates the importance of each term within its topic. In this case study, we give the same importance to each term. Hence, all weights will be equal to “1”. In practice, you should experiment with different weights based on domain expertise and then test to see how those work. Click “OK” to save and exit. Instead of typing all of the topic terms, click on the Import button and select the SAS data set texttopic_pos from your library. Then, right click on the “Text Topic” node and select “Run”. After the run completes, click “Results” to see user-defined topics along with the number of documents for each topic.
Display C3.10 User topics with customized topics
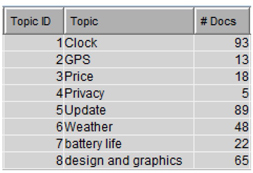
11. From Display C3.11, you can see that the newly created topics are fairly distributed with the exception of the topic “privacy” which has a frequency of 5.
Display C3.11 Text topic results
12. To get a better understanding of these topics and how they are related to the terms, open the interactive topic viewer by selecting the ellipsis button in the properties panel next to Topic viewer in the Results section, as shown below in Display C3.12.
Display C3.12 Launch Interactive topic viewer
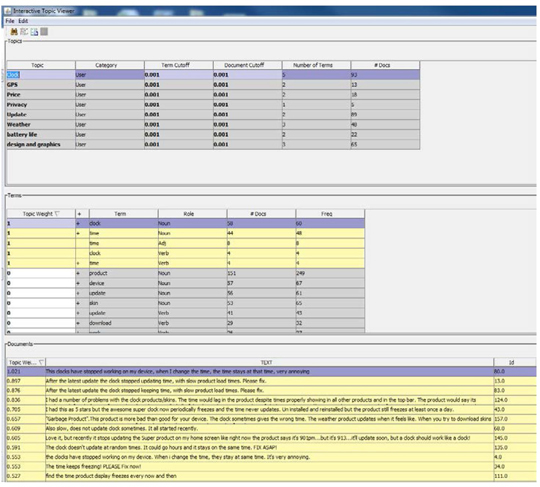
13. The interactive topic viewer allows users to select each topic and find the terms and documents that relate to that topic, as shown below in Display C3.13. As you can see, the bottom section (documents) of the window displays all text documents with the document topic weight for the topic “Clock” which you have selected from the top section (topics). The Interactive topic viewer also lets users analyze and manage term cut-off and document cut-off scores. See Chapter 6, “Clustering and Topic Extraction,” for more information on the Interactive topic viewer.
Display C3.13 Interactive Topic Viewer
You should explore these results to get a better sense of how the customized topics enhance the analysis.
Text Mining for Positive App Reviews
You will now create another process flow within the same diagram using the positive app reviews data set and repeat Steps 3 to 6 above in order to get a sense of what customers are talking about in the positive reviews.
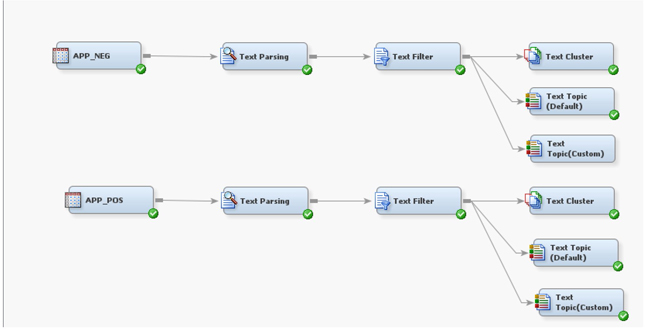
1. Select all of the nodes except the APP_NEG (data source node) and then “copy” and “paste” in the same diagram (Display C3.14) workspace. By doing this, the property settings of all nodes are automatically retained so that you do not have to change each node’s settings. Now add the positive review data (APP_POS) to the data sources and then click and drag the data source into the diagram and connect it to the “Text Parsing” node as shown in Display C3.14.
Display C3.14 Diagram with APP_POS process flow nodes
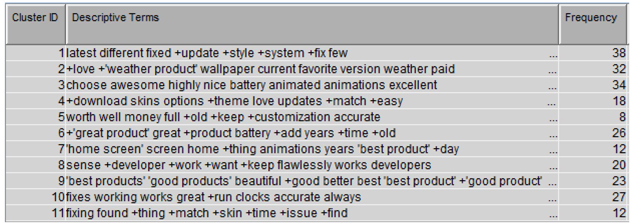
2. From the APP_POS process flow, right click on the “Text Cluster” node and click “Run”. Display C3.15 shows the cluster results from the text cluster node. Eleven clusters are generated. Documents are fairly distributed among these clusters. The descriptive terms from each cluster give us a sense of the characteristics of grouped comments as shown in Display C3.15.
Display C3.15 Text cluster results
3. From step 8, you have a basic idea of how consumers are using this product and some of the features of this product that they are talking about positively in their reviews. Next you will run the text topic node to get deeper insights about topics of conversation and features mentioned in those topics. Run the “Text Topic” node with default settings. The generated topics in Display C3.16 show that features such as “Weather”, “Update”, “Time/ Clock”, or “Money/ Price” appear several times in the twenty-five topics that are generated. The results show pretty much similar features as discovered for negative review data source. Therefore, you will continue to use the same “User Defined” topics and run the custom node.
Display C3.16 Text Topic node results with default settings
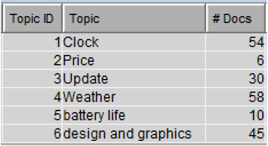
4. Now right click on the “Text Topic (Custom)” node and select “Run”. Open the results and see user-defined topics along with the number of documents. As shown in Display C3.17, the “Text Topic” node only generated six topics. Comparing the custom topics results between positive and negative reviews reveal that there was not a single document that talked about GPS or privacy topics in the positive reviews. The custom created topics are fairly distributed with the exception of the topic “price” which has a frequency of only 6.
Display C3.17 Custom topic results for positive reviews
As explained in Step 6.g from the negative comments process flow, you can use interactive topic viewer from the text topic node for easier and better understanding of topics and cut-off scores. This analysis has greatly helped in getting a high-level idea of the sentiment expressed in the user reviews. These insights are very valuable for digging deeper into the text in order to extract sentiment at feature and document level. The next section will take you a step further into sophisticated sentiment mining using SAS® Sentiment Analysis Studio.
NLP Based Sentiment Analysis
Parts-of speech (POS) tagging is often the most time consuming and challenging task before doing sentiment analysis of any text data. Online textual reviews are often short, non-grammatical sentences and contain slang terms, abbreviations, and symbols which make the POS tagging even more difficult. However, the text mining in SAS® Enterprise Miner 12.1 provided us with good insights into what consumers are talking about in these reviews. Those insights will come in very handy as you conduct sentiment analysis via SAS® Sentiment Analysis Studio 12.1.
1. Open SAS Sentiment Analysis Studio 12.1. Start a new project. Use default settings for both the rule-based model and the statistical model.
2. In the “Corpus” white workspace, right click and select “New Corpus.” Type in a name such as App_Reviews.
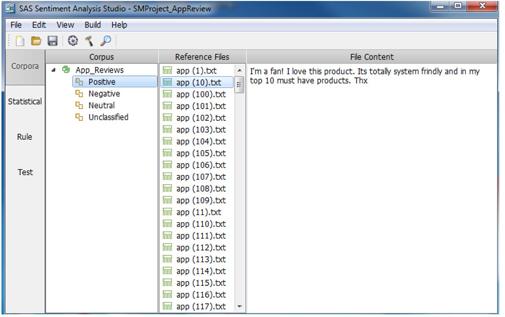
3. Right click on “Positive” and choose “Add a Directory”. Go to the folder (Case Studies ▸ Case Study 3 ▸ APP_SM ▸ model ▸ pos) where files for modeling the positive sentiments are stored and click “select folder.” You will see the 250 positive reviews (text files) imported and listed in the “Reference Files” workspace. To see the contents of any particular file, click and select it in the Reference Files space (See Display C3.18).
Display C3.18 Sentiment Analysis Studio corpus view panel
4. Repeat the previous step to add the Negative directory (Case Studies ▸ Case Study 3 ▸ APP_SM ▸ model ▸ neg) where files for modeling the negative sentiments are stored. You do not have “Neutral” and “Unclassified” documents in this case study.
5. Build the Statistical Model
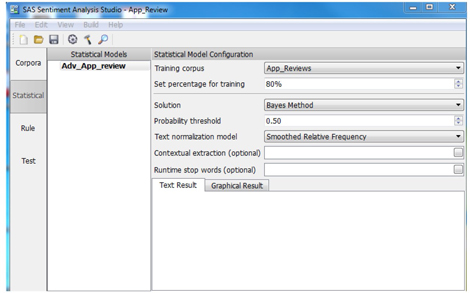
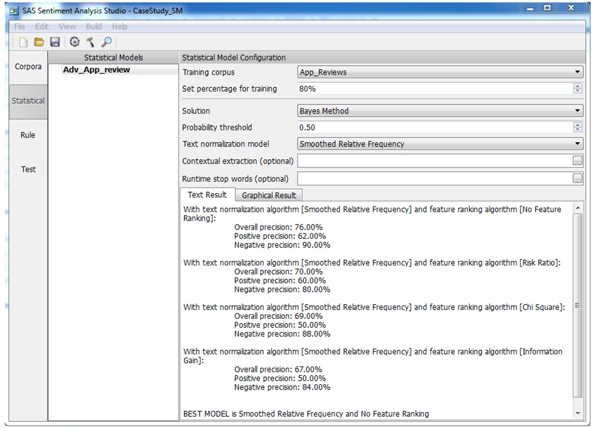
a. Click on the “Statistical” tab (left panel). Right click in “Statistical Models” white workspace and choose “New Model”. Name the new model (such as Adv_App_Review), select “Advanced”, and click “OK”. On the statistical model configuration panel (See Display C3.19), you can make changes to improve your statistical model performance. Here, you will use default settings.
Display C3.19 Statistical model configuration panel
b. On the top menu, click “Build” and select “Build Statistical Model”. Select the model name that you just created and click OK to run. After the run completes, you will see the results as shown in Display C3.20. One of the major reasons for building a “Statistical Model” is to extract a list of most commonly used words and terms and reuse them as a start list for a rule-based model. From the result, you can see that the overall accuracy of “Statistical Model” is 76% (Display C3.20). Later you will compare the accuracy of both statistical model and rule-based model in the conclusion section.
Display C3.20 Statistical model training results
6. Building a Rule-Based Model
a. Click on the “Rule” tab from the left panel. On the top menu, click “Build” and select “Import Learned Features” to import all keywords to start building a rule-based model. You can load the features from a model or a data file. Let us start with importing from the “Statistical Model”. Change the “Number of keywords to import” to “200” and click “OK”. The reason to keep 200 keywords is simply because it is easier to review, edit, and change in later steps. Next click on “Tonal Keywords” and you will see 200 positive words and 200 negative words. You can scroll down and see different keywords for positive or negative reviews. While many of these keywords look reasonable, some do not. As an analyst, you often start with these keywords and then modify them to create your own list. Display C3.21 is an example of first four positive keywords that were imported into “Tonal Keywords”. The weight of each word is auto-calculated based on the word’s frequency.
Display C3.21 Examples of positive tonal keywords

b. It is recommended that you create multiple rules to achieve better results. At this stage of analysis, all terms and words are serving globally. Hence a rule-based model when tested on the test data will yield the same number of documents for each feature. It often works better if you divide words into different categories. You will create different categories under “Intermediate Entities”. The reason for doing this is to correctly and thoroughly detect each sentiment word along with its feature.
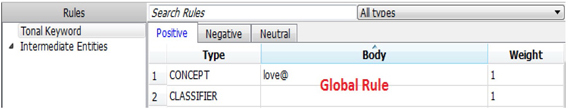
c. You can create custom rules either globally or create rules for each feature. To create rules globally, click “Tonal Keyword”. Under “Positive”, “Negative”, or “Neutral” tabs, first edit the “Body” section, and then change “Type” and “Weight”. Note that rules will not work if you do not change the “Type” of rules. Display C3.22 is an example of creating rules in “Tonal Keywords”. In this example, a global CONCEPT rule “love@” is created. Words such as “love”, “loves”, “loved”, and “loving” are detected and counted for all features.
Display C3.22 Example of creating Concept Rule under Tonal Keyword
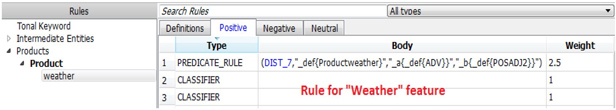
Display C3.23 is an example of creating rules for a specific feature. This rule will be triggered only if the feature name ”weather”, an adverb and a positive sentiment adjective (we have defined a group of positive sentiment adjectives), happen to occur within a distance of seven words.
Display C3.23 Example of creating rules for a specific feature
d. For your convenience, we have created a set of rules and entities for use with this data set. Go to “File” and select “Import Rules”. Choose the XML document rule file “App_Rule.XML” and click OK. All custom created rules will be imported into this project.
e. Features discovered from text mining analysis are implemented in this section. Currently you can see all these features under “Product.” If you want to create a new product, right click on “Products” and select “New Product.” If you want to add features to a “Product”, right click on “Product” and select “New Feature”.
f. Under “Intermediate Entities”, you will find the entities “ADV”, “NEGADJ1”, “NEGADJ2”, “NEGWORD”, “OP”, “POSADJ1”, “POSADJ2”, and “VERB”.
g. By clicking on “ADV”, you can see a list of words that are used as adverbs. Words in “NEGADJ1” are negative adjectives with sentiment weight of 1. The same rules apply to “NEGADJ2”. “POSADJ1” are positive adjectives with sentiment weight of 1. Same rules apply to “POSADJ2”. NEGADJ1/ POSADJ1 are the lists with all adjective words that we considered having less negative/ positive sentiments than the words in NEGADJ2/ POSADJ2. When “ADV” word and “NEGADJn”/ “POSADJn” word occur together, then the sentiment weight becomes “n+0.5”. Sentiment weights are often subjective and difficult to interpret as explained in Chapter 8, “Sentiment Analysis.” Interested readers are advised to follow the references mentioned in the text.
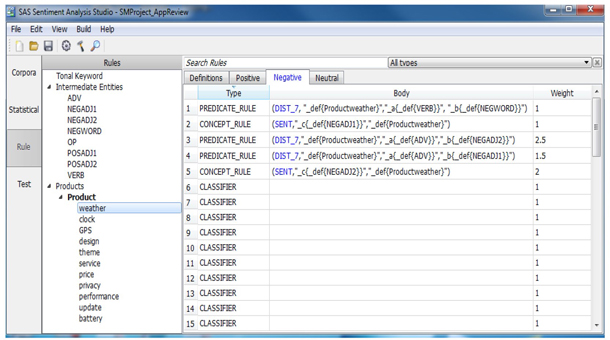
“OP” contains other products that can be considered competitors. In “VERB”, it contains verbs that are often used in these reviews. In this custom list you will find the type of “VERB” is “CONCEPT” with the symbol “@” added to the verbs. Symbol “@” will detect all verb forms. CLASSIFIER, CONCEPT, CONCEPT_RULE, and PREDICATE_RULE types were used for this case study. CLASSIFIER rules are used to match a term or a phrase. We used CLASSIFIER rules to match the words which can be used only for a feature. For example, “expensive” can only be used for feature “price”. Display C3.24 shows an example of PREDICATE_RULE and CONCEPT_RULE. In “DIST_n”, n is the number of words between matches on rules. The first match is tagged as position 1, the second match as position2 and it goes on until the last match (n). “_def” matches the definition for products or features. “_def{Productweather}” is a definition for the feature “weather” of “Product”. “_a” and “_b” are arguments that match when these two arguments match in a document. “SENT” will match the words and definition only within the same sentence.
Display C3.24 Examples of PREDICATE_RULE and CONCEPT_RULE
h. Next go to “Build” and select “Build Rule Based Model”. After the model is built you will be notified with a successful message but no visible results.
i. Go to the “Test” tab. Right click in the “Test Data” white workspace and select the “New Test Directory”. Go to test folders Case Studies ▸ Case Study 3 ▸ APP_SM ▸ model ▸ test for sentiment mining and import both the “neg” and “pos” folders separately.
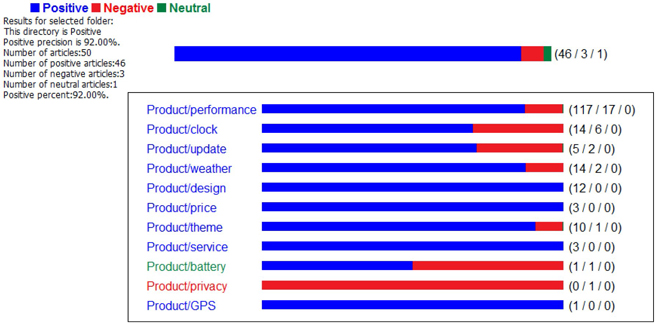
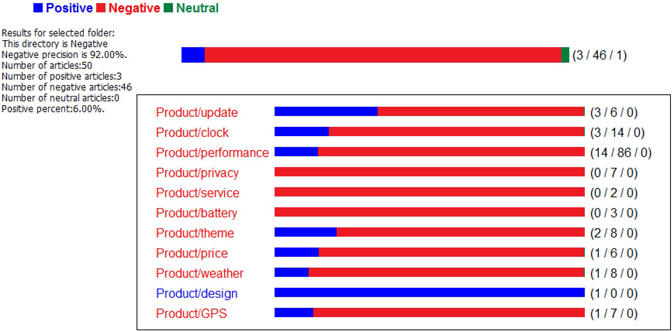
j. Right-click on each imported directory and select “Test in Rule Based Model”. Display C3.25 and Display C3.26 show the testing results from a rule-based model for positive and negative test data, respectively. Both these results show 92% accuracy. Additionally, positive and negative sentiments toward to each feature is illustrated.
Display C3.25 Testing results from Positive Directory
Display C3.26 Testing results from Negative Directory
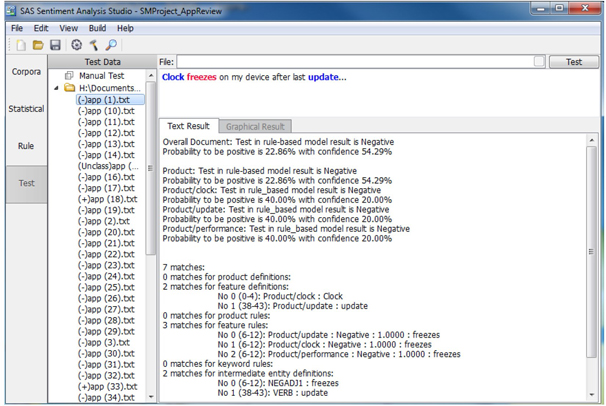
k. Expand the negative testing directory, right click on the text file 1.txt and select “Test in Rule-based Model”. The testing results are shown in Display C3.27. This file has been classified as a negative comment. Four features are identified in this coment. Words in blue are identified as “features”; words in green are identified as positive sentiment; and words in red are detected as negative sentiment.
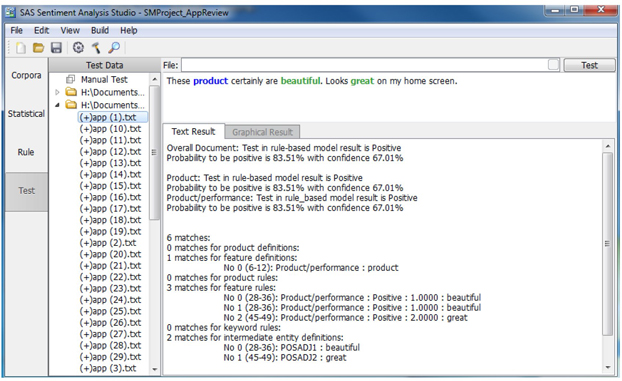
l. Expand the positive testing directory, right click on the text file 2.txt and select “Test in Rule-based Model”. The testing results are shown in Display C3.28.This file has been classified as a positive comment. Four features have been detected.
Display C3.27 Single text file test result (Negative Directory)
Display C3.28 Single text file test result (Positive Directory)
Summary
The NLP rule based model provides deeper insights in understanding consumers’ sentiments. Primarily, you understand that the product users are satisfied with product graphics designs, but are concerned and unhappy about privacy features. Also, looking at the model results, the rule-based model performs extremely better than a statistical model (Table C3.1).
Table C3.1 Statistical and rule-based model comparison
| Products | Statistical Model | Rule-based Model | ||||
| Positive Precision | Negative Precision | Overall Precision | Positive Precision | Negative Precision | Overall Precision | |
| Product | 62% | 90% | 76% | 92% | 92% | 92% |
The statistical model was built without identifying the product features. On the other hand, a rule-based model was built using a list of product features. These product features were derived from text mining analysis using SAS® Text Miner and also from the terms extracted from the statistical model. Using both SAS Text Miner and rule-based Sentiment Analysis using SAS® Sentiment Analysis Studio helps to achieve better results.