
Case Study 6 Opinion Mining of Professional Drivers’ Feedback
Mantosh Sarkar
Goutam Chakraborty
Analysis Using SAS® Text Miner
Analysis Using the Text Rule-builder Node
Introduction
The widespread adoption of mobile applications has tremendously expanded the scope of obtaining timely customer feedback. While many companies collect feedback from their customers via mobile apps, they often restrict their analysis to numeric data and ignore analyzing customer feedback and sentiment from textual data because of perceived difficulties associated with analyzing text data. In this case study, you will analyze customer feedback by professional drivers sent via mobile devices. Currently, he company experts manually classify these textual feedbacks into positive and negative groups. Here, you will learn how to use SAS® Text Miner to automatically generate and summarize topics from positive and negative feedbacks, as well as classify comments into positive and negative groups. In addition, we also help you learn how to build rules in SAS Sentiment Analysis Studio to predict customer’s sentiment automatically, so that experts’ time can be used for more strategic purposes.
Data
A leading retail & energy company with hundreds of truck stops located in most of the U.S. has kindly agreed to provide the data for this case study anonymously. It offers fuel, fast food, and convenience store services to its customers. In addition, it offers amenities such as food from national restaurant chains as well as trucking supplies, showers, and RV dump stations. The data used in this case study is feedback obtained via a mobile phone app that is used by professional drivers to locate a store, find nearby fuel stations, and check loyalty program reward point balances. This feedback is free-form text comments from professional truck drivers who talk about various topics related to their experience at the store, questions on required services, etc. Currently, company experts classify driver’s feedback into positive and negative by reading and analyzing it.
For reasons of anonymity, the name of the company is masked in the text comments. After data cleaning and validation, 2,335 text comments were used for this case study. We decided to keep the data and analysis separate for positive and negative comments. You will start with SAS® Text Miner to extract insights from topics the professional drivers are talking about in their feedback.
Analysis Using SAS® Text Miner
The data sets used for this analysis are:
• neg_model_new.sas7bdat
• pos_model_new.sas7bdat
• engdict.sas7bdat
The data sets are available in the Case Studies ▸ Case Study 6 folder of the data provided with the book. The following sections will walk you through a detailed step-by-step text mining process.
1. Create a new project in SAS® Enterprise Miner and create a library pointing to the location where the data resides using the project start code or File ▸ New ▸ Library menu.
2. Create two data sources using the provided input data sets: “pos_model_new”, “neg_model_new”.
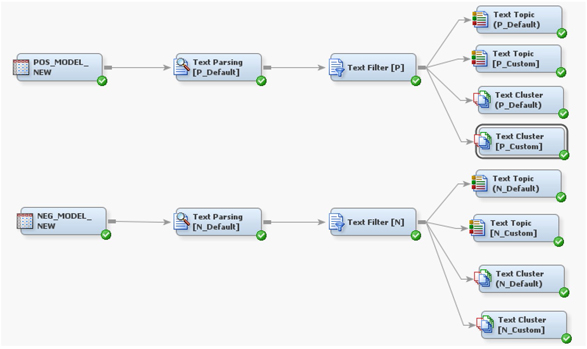
3. Create a new diagram and drag the two input data sources onto the diagram space. Connect the data sources with text miner nodes as shown in Display C6.1. The nodes with “Default” in their names are run with default settings in their properties panel.
Display C6.1 Text mining process flow
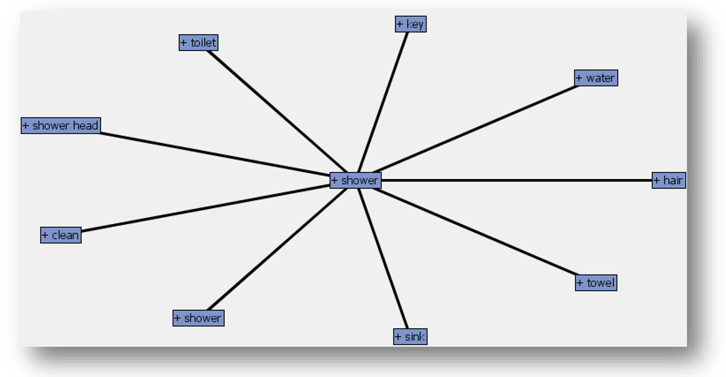
4. Change the default dictionary setting in both text filter nodes by selecting the “engdict.sas7bdat” from your library. Click the ellipsis button next to the ‘Dictionary’ property setting. Right-click the text filter nodes and run both the process flows. An interesting output of the text filter node are concept links. They help to identify relationships between terms. You can view concept links by first clicking the ellipsis button next to Filter viewer in the properties panel of the text filter node, then right clicking any term in the Filter Viewer results and selecting “View Concept Links”. Display C6.2 shows the concept link diagram for the word “shower” obtained from the text filter node in the negative feedback process flow. The thickness of the lines connecting the words signifies the strength of the association between terms. The term “shower” is strongly associated with terms such as key, water, toilet, shower head, clean, sink, towel, and hair. Reading through the comments that contain these terms, you will find that customers complain about showers not being clean, cold water, dirty sinks, the shower room keys0 not working properly, and not having enough towels available.
Display C6.2. Concept link diagram for the term “shower”
5. Modify the properties of Text Topic (Custom) node as below.
6. Change “Number of multi-term topics” to 13 for negative comments and 3 for positive comments (as shown in Display C6.3).
7. Run the process flow from the Text Topic nodes.
Display C6.3 Properties panel of Text-topic (custom) node for positive feedbacks and negative feedbacks

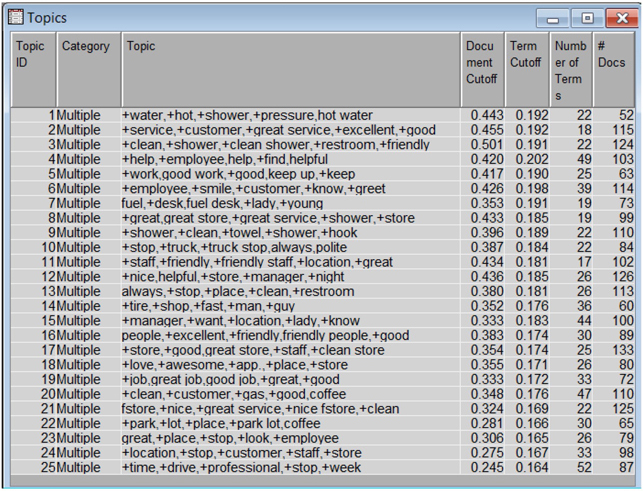
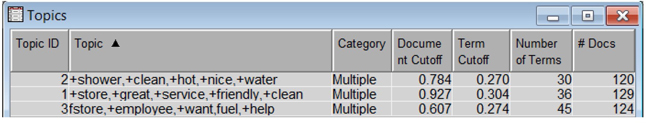
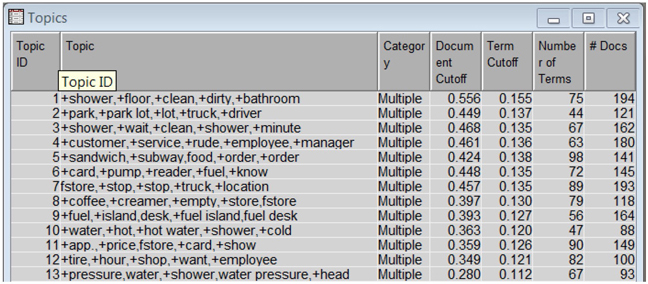
The data is first parsed and then fed into the text filter node. The output from text filter node is then fed to the text topic node, which generates 25 multi-term topics by default (as shown in Display C6.4 and Display C6.6). Given the small data size, 25 topics are deemed too many. Also, these 25 multi-terms have redundant themes. By changing “Number of Multi-term topics” in the property panel in a trial-and-error method, only 13 multi-term topics were retained for custom text topic node which uses the negative comments as input (as shown in Display C6.7) and only 3 for the custom text topic node (as shown in Display C6.5) which uses the positive comments as input. In this data, the numbers of topics for complaints outnumber the topics for appreciation, which is consistent with prior consumer research findings (conducted with the help of an external research agency) that people are more likely to complain than compliment. Note that in this case, you are configuring the text topic node to pick the number of topics and use appropriate terms to describe those topics. However, it is also possible to specify custom topics using user defined terms via the ‘user topics’ functionality.
Display C6.4. Text topic node results from positive comments with default settings
Display C6.5. Text topic node results from positive comments with custom settings
Display C6.6. Text topic node results from negative comments with default settings

Display C6.7. Text topic node results from negative comments with custom settings
8. Attach a cluster node to both process flows (Positive and Negative), run them with default settings, and examine the results.
With default settings, 8 clusters are generated for positive comments and 9 clusters are generated for negative comments. While these cluster sizes look reasonable, after trying different cluster numbers and using domain expertise, the number of clusters is changed as follows.
9. Modify the properties of ‘the Text Cluster (Custom)’ node by changing the property “Exact or Maximum Number” to “Exact” and “Number of clusters” to 13 for negative comments and 3 for positive comments (as shown in Display C6.3). Run the text cluster nodes and examine the results.
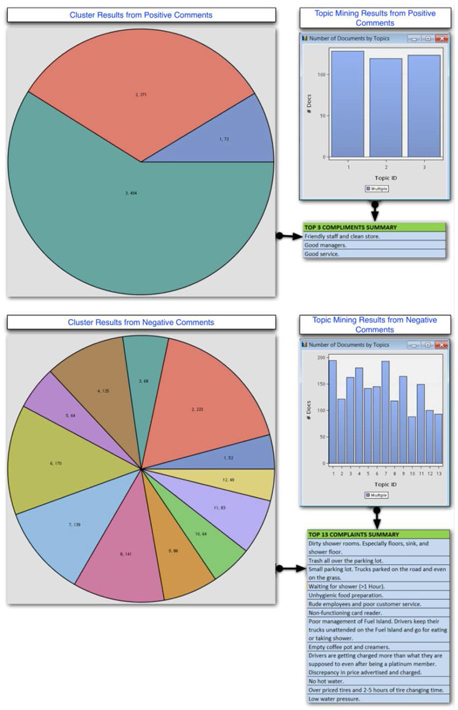
Cluster analysis with custom settings results in 12 clusters of reasonable sizes for negative comments (as shown in Display C6.8). Results show that the top factors that customer complained about were dirty shower rooms, trash all over the parking lot, rude employees, etc. These results are similar to those obtained via topic mining (text topic node). For positive comments, cluster analysis results in 3 groups, and their interpretations are similar to the topics found for the positive comments. This is not surprising, because you have deliberately forced the number of clusters and number of topics to be similar in this case.
Display C6.8. Summary of results from SAS® Text Miner
While Expectation-Maximization (EM) cluster algorithm is generally the preferred method for clustering textual data, it is possible to use hierarchical clustering or even SOM/Kohonen (once the SVDs have been calculated). Let us see how hierarchical clustering performs on the negative comments and how the hierarchical clusters relate to the EM clusters.
10. Attach another cluster node to the process flow for negative comments. Change the cluster algorithm to Hierarchical in the properties panel. Run this node and examine the results. The results reveal nine clusters with a reasonable number of documents per cluster, as shown below:
Display C6.9. Hierarchical clustering results for negative comments
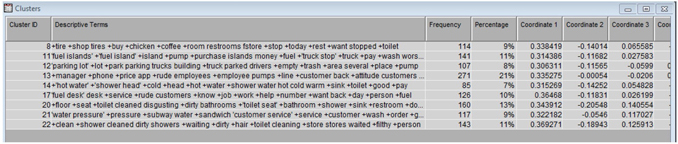
To compare the clustering results between EM and hierarchical algorithm, you can read the descriptive terms of each cluster identified by the nodes and if needed, skim through the actual documents for each cluster. It is also useful to compare the cluster memberships of each document using the two methods. This is described next.
Attach a merge node to the process flow for negative comments and connect the two clustering nodes (N_Default and N_Hierarchical) to the merge node.
1. In the property panel of the merge node, select the ellipsis button for variables. Change the Merge Role of ID to “By”. Run the merge node.
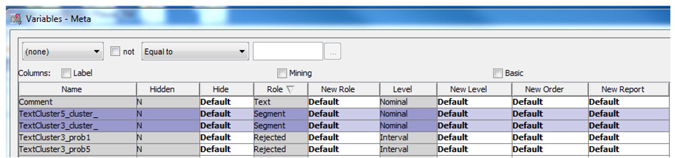
2. Attach a metadata node to the merge node. In the property panel of the metadata node, select the ellipsis button for Train under Variables.
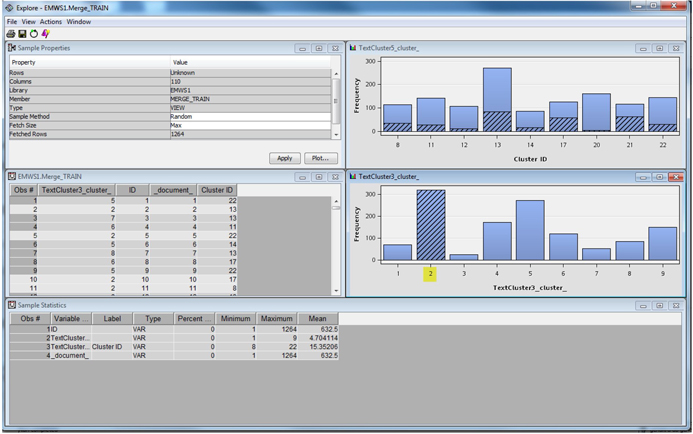
3. In the pop-up window, sort (by clicking) the table by Role. You will find two variables with the role ‘Segment’ (each name ending with _cluster_). Those two variables represent cluster memberships of each document from the two cluster nodes. Select those two variables together and click the Explore button.
Display C6.10 Cluster membership variables
4. In the Explore results, click each bar to understand the relationships between clusters from the two algorithms.
Clicking the highest bar in the bottom panel shows that very little commonality exists between cluster memberships from the two algorithms. The purpose of this demonstration is not to prove that one algorithm is better than the other. At the end of the day, clustering is a partitioning tool, and any partitioning may be useful. It is up to the user to carefully examine each cluster solution, using domain expertise to determine which solution is more usable.
Display C6.11 Relationships between clusters from the two algorithms
Analysis Using the Text Rule-builder Node
The Text Rule-builder node is available in the SAS® Enterprise Miner version 12.1 and above. The Rule-builder node creates an ad hoc set of rules with user-definable outcomes. These rules are basically Boolean if-then-else type rules that can be exported to SAS® Content Categorization Studio
For this part of demonstration, you will use the following data sets.
• All_model.sas7bdat (a data set that combines positive and negative comments for building models. This data set has 90% of all comments)
• All_test.sas7bdat (a data set that combines positive and negative comments for testing models built. This data set has 90% of all comments)
• Engdict.sas7bdat
1. Create a new project in SAS® Enterprise Miner and create a library pointing to the location where the data resides using the project start code or File ▸ New ▸ Library menu. Create a new diagram.
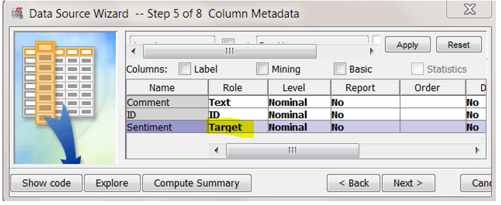
2. Create a new Data source using All_model.sas7bdat. Make sure to change the ‘Role’ of variable ‘Sentiment’ in Step 5 of ‘Data Source Wizard’ to target as shown in Display C6.12. The sentiment variable reflects whether company experts judge the comment is as positive or negative.
Display C6.12. Data source creation process for data set All_model
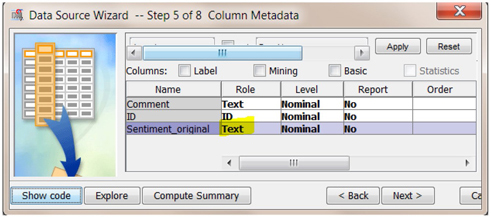
3. Create another data source using the All_Test data set. Select the role of the variable sentiment_original to text as shown in Display C6.13. The sentiment_original variable reflects whether the comment is judged as positive or negative by experts in the company.
Display C6.13. Data source creation process for All_Test data set
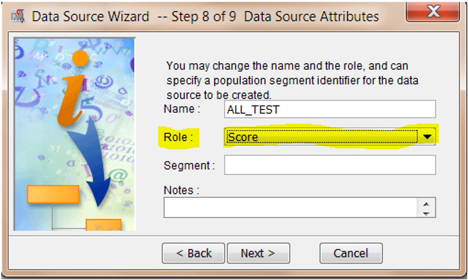
4. In step 8 of the data source wizard, select the role type for this data set as “Score” instead of “Raw” as shown in Display C6.14. For help importing the data set as a scoring data set, please see the help section of SAS Enterprise Miner 12.1 (Help->Contents->Create a score data set).
Display C6.14. Data source creation process for data set All_Test
5. Now drag the data set All_Model onto the diagram space. Connect the data set with nodes as shown in Display C6.15.
Display C6.15. Text mining process of comments using text rule-builder node

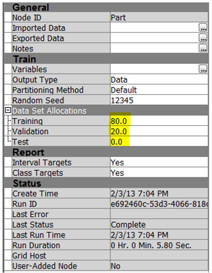
6. In the property panel of data partition node, change the value of “Data Set Allocations” as shown in Display C6.16.
Display C6.16. Data partition node property panel
7. Use default settings for the text parsing node.
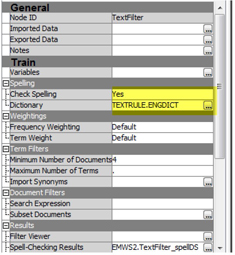
8. In the property panel of ‘Text Filter’ node (as shown in Display C6.17), import the dictionary engdict from the SAS library where you saved this data set.
Display C6.17. Text Filter node property panel
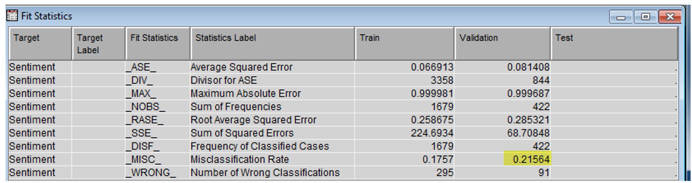
9. Use default properties for ‘Text Rule-Builder’ node. Run the node and examine the results. Results show a pretty good validation misclassification rate of 0.2156, as shown below.
Display C6.18. Overall model classification results from the rule builder node
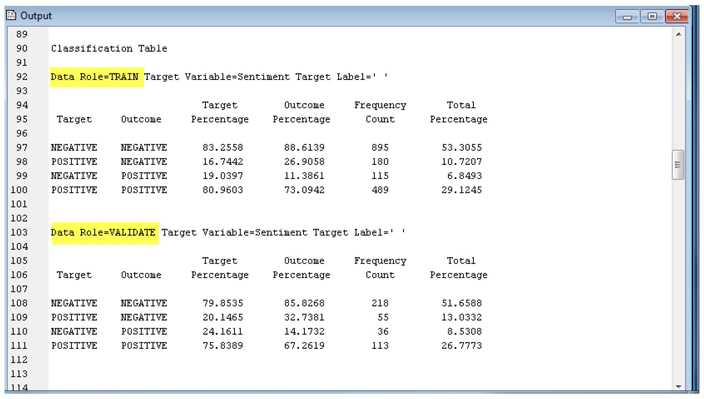
While the model seems to be performing reasonably from looking at the overall misclassification rate, it is also important to evaluate how well the model classifies each outcome (positive or negative). The numbers reported below show that the model does about equally well in predicting positive versus negative cases.
Display C6.19. Model Classification Results from the Rule-Builder Node for Positive and Negative comments
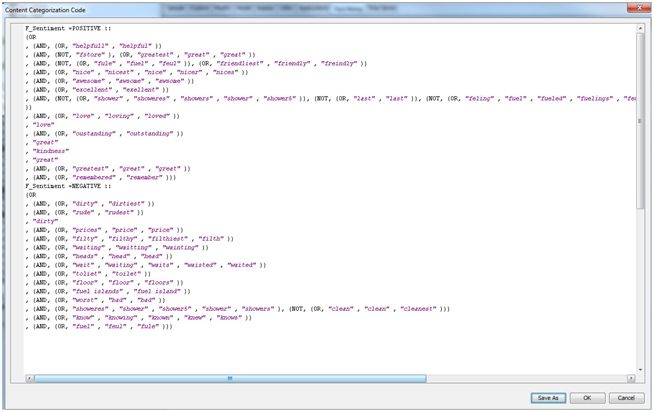
10. Click on the ellipsis button next to content categorization code in the properties panel of the text rule-builder node. You will see the rules that the text builder node has created from this data (as shown in Display C6.20). Being Boolean in nature, these rules are easy to understand.
Display C6.20 Content categorization code obtained from the text rule-builder node
11. Attach a score node to the text rule-builder node.
12. Drag the All_Test data source to the diagram workspace and connect it to the score node.
13. Run the score node and examine results.
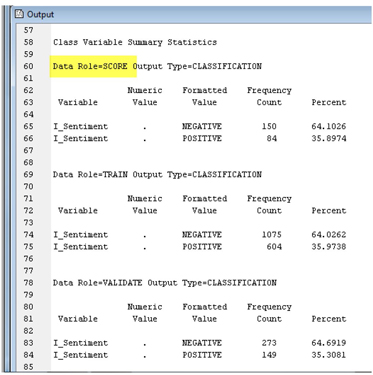
The scoring results shown below look reasonable, since the % of positive and negative in the scored data is similar to those from the training and validation data. However, in this data set (unlike in real scoring cases), you have the actual sentiment values, and those can be compared against the predicted sentiment from the text rule-builder model via a cross-tab. The cross-tab between the two results can be generated easily by using a SAS code node in this diagram space.
Display C6.21 Scoring results
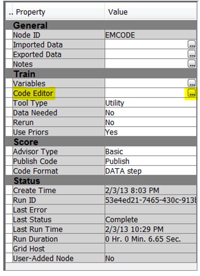
14. Attach a SAS Code node to the rule-builder node. In the property panel of ‘SAS Code’ node, click the ellipsis button next to ‘Code Editor.’
Display C6.22. SAS Code node property panel
15. In the pop-up code window, type the code as shown in the Training Code window in Display C6.23.
Display C6.23. Code editor window

16. Close the SAS code node (select save), then run it and examine results.
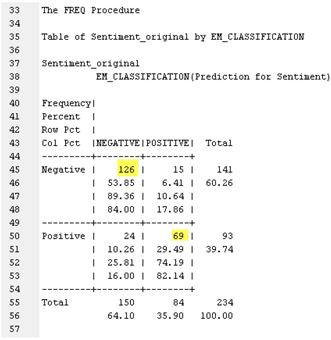
It seems that 126 out of 141 negative comments (89.36%) were correctly classified, and 69 out of 93 positive comments (74.19%) were also correctly classified. Overall, 195 out of 234 (83.33%) comments were correctly classified by the text rule builder model. These are pretty good results.
Display C6.24. Comparing scoring results with known values.
Analysis Using SAS® Sentiment Analysis Studio
SAS® Sentiment Analysis Studio classifies the feedback into positive and negative sentiments and categorizes them into features. SAS® Sentiment Analysis Studio has three different types of models: statistical model, rule based model, and hybrid model. Hybrid model is a combination of a statistical model and a rule based model. In practice, a statistical model is often used as a starting point in sentiment mining, because it provides a baseline model that can be set up quickly. Using it as a starting point, a rule based model can then be built, after which each lexicon rule can be modeled and analyzed over and over again. A successful rule based model often can explain results very intuitively for managers who may not like to delve deeply into detailed statistical analysis.
Building a Statistical Model
1. Create a new project in Sentiment Analysis Studio using the default settings for rule-based and statistical models.
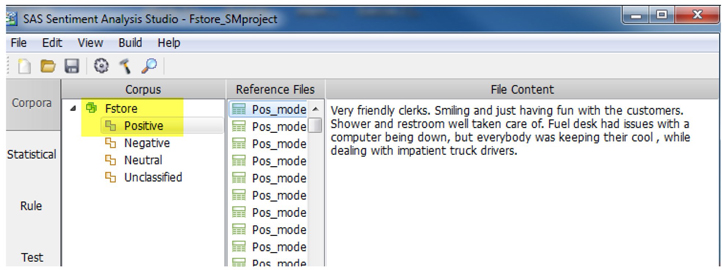
2. Select Corpora tab. Right-click in the white space in Corpus and select new corpus (name it as ‘Fstore’). Right-click Positive (as shown in Display C6.25) under Fstore and select Add a Directory. Point to the folder Case Studies ▸ Case Study 6 ▸ Fstore Sentiment Mining Data ▸ Model data ▸ Positive and click Select Folder.
Display C6.25. Sentiment Analysis Corpus view panel (Positive)Q
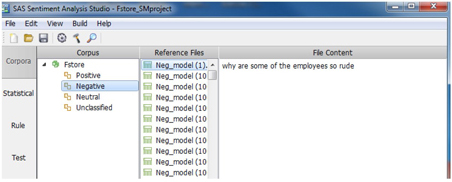
3. Right-click Negative (as shown in Display C6.26) under Fstore and select Add a Directory. Point to the folder Case Studies ▸ Case Study 6 ▸ Fstore Sentiment Mining Data ▸ Model Data ▸ Negative and click Select Folder.
Display C6.26. Sentiment Analysis Corpus view panel (Negative)
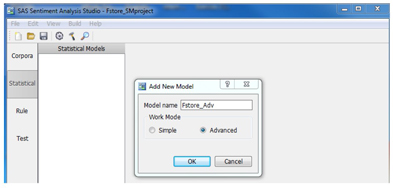
4. Select Statistical tab. Right-click in the white space and select New Model (as shown in Display C6.27). Create a new statistical model with advanced settings by selecting the ‘advanced’ option in the ‘Add New Model’ pop-up box. Click OK.
Display C6.27. Creating advanced statistical model
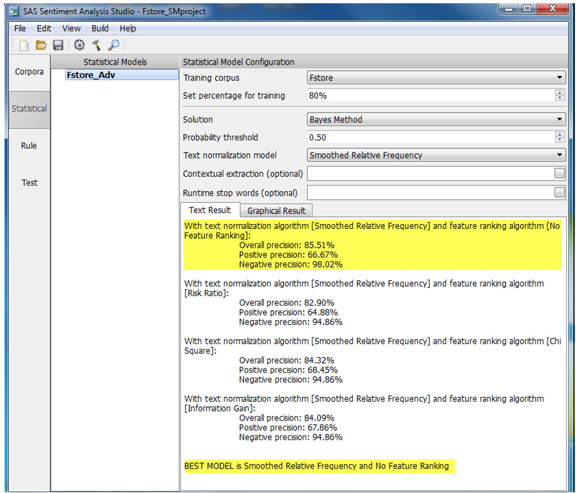
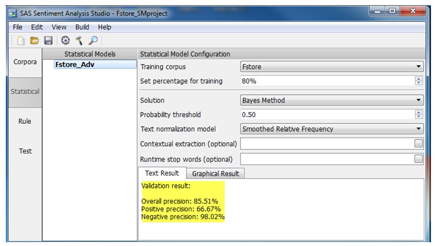
5. Right-click the newly created model in the Statistical Models and select the option “Train Model”. The results (as shown in Display C6.28) show good performance for the best model on the validation data.
Display C6.28. Statistical model training results
6. Right-click the model name one more time and select Validate Model. Note that these (as shown in Display C6.29) match the results reported for the best model in the earlier step.
Display C6.29. Statistical model validation results
7. Select the Test tab, right-click in the white space of Test Data, and select new test directory. Point to the negative folder in the Testing Data directory.
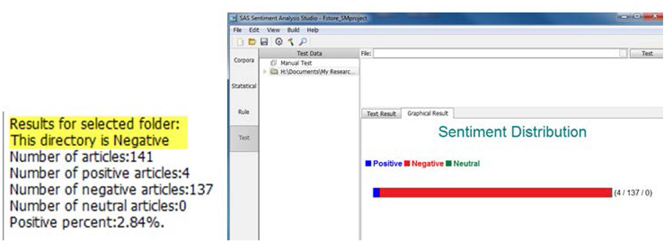
8. Right-click the folder under Manual Test and select Test, in Statistical Model. The results look good, as shown below.
Display C6.30. Statistical model testing results for negative directory
9. Repeat the testing steps with the positive directory. Results are as shown below.
Display C6.31. Statistical model testing results for negative directory

On the surface the statistical models seem to be performing well! But, when you extract the rules from the statistical model via import learned features, some of the rules are difficult to understand.
10. Click the Rule tab, and from the top menu, select Import Learned Features. Select the statistical model created in prior steps. Click on Tonal Keyword, then select Positive or Negative tab (as shown in Display C6.32) to get a sense of the rules.
Display C6.32. Imported learned features from a statistical model
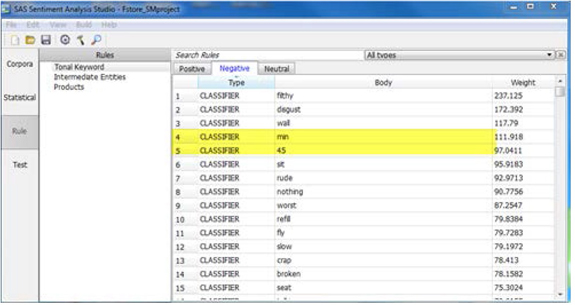
For example, numbers were classified as negative sentiment rules. The imported list was also very long and unwieldy. Generally speaking, these rules can be improved by editing/modifying imported rules from the statistical models. For the purpose of this case study, through trial and error, we have built a set of rules (filename: Fstore_CustomRule.xml) that you will use next.
Building a Rule-based Model
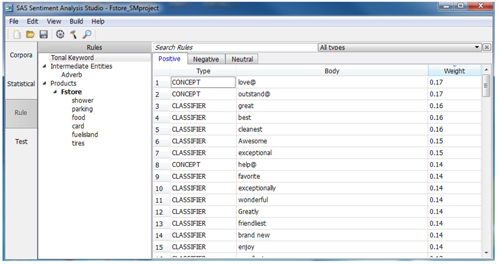
11. Import the rule file Fstore_CustomRule.xml from File Menu ▸ Case Study 6 folder.
Display C6.33. Imported rules from file Fstore_CustomRule.xml
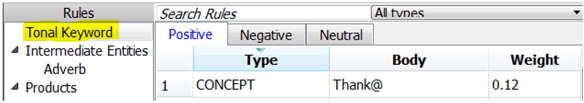
12. If you want to create your own rules, you can either create rules globally or create rules for each feature. To create rules globally, click “Tonal Keyword”. Under “Positive”, “Negative”, or “Neutral” tabs, first edit “Body”, and then change the “Type” and “Weight”. Note that the rules will not work if you do not select the “Type” of rules. An example of creating rules in “Tonal Keywords” follows. In this example, the term Thank@ will detect “thank”, “thanks”, “thanked”, and “thanking” and count for all features.
Display C6.34. Examples of positive tonal keyword
Another example of creating rules for a specific feature follows. In this example, the rule will be triggered only if the term “not clean” is mentioned with possible definitions of feature “shower” as defined within ‘Definitions’ in a single sentence.
Display C6.35. Example of creating concept rule for a specific feature

13. Build the rule-based model (Build-> Build Rule-based Model).
14. Now test the folders in Rule-based Model and examine the results.
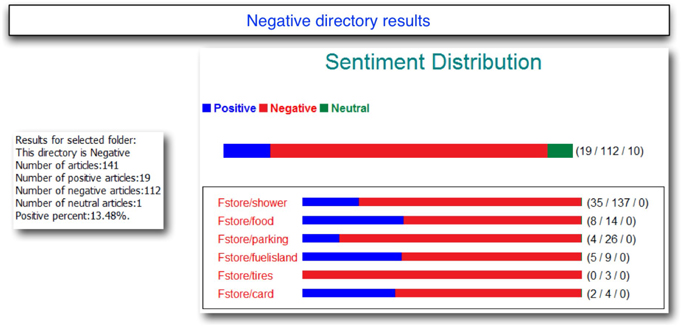
After scoring these rules on the negative test directory, which contains 141 negative comments, 112 comments were classified as negative, 19 comments as positive, and 10 as neutral, which is a very good result. As you carefully read all the comments in negative directory, you will find that company experts actually misclassified some of the mixed comments which the rule based model identified as neutral! You will also discover that most number of the complaints were regarding shower followed by food, parking, Fuel Island, tires, and card. Display C6.36 shows the exact number of comments that were classified for each feature.
Display C6.36. Testing results of negative feedbacks from a rule-based sentiment model
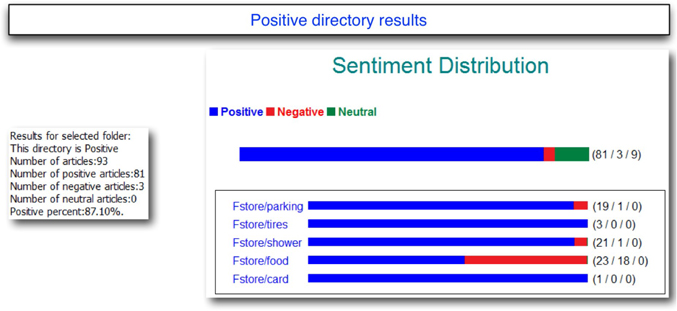
The rule-based model also did a good job in classifying positive comments. In the test directory containing 93 positive comments, 81 comments were classified correctly as positive which resulted in accuracy of 87.10 %( as shown in Display C6.37). “Food” received highest numbers of positive feedback followed by showers, parking, tires, and card.
Display C6.37. Testing results of positive feedbacks from a rule-based sentiment model
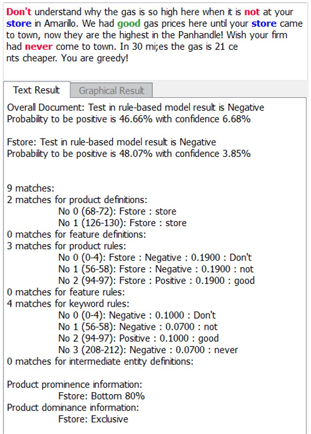
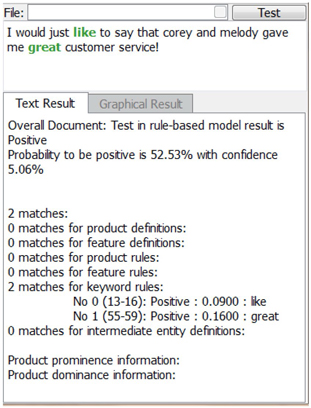
To know more granular details on the model performance, each comment can be individually tested and examined. The example below shows why a negative comment was classified as negative by the rule-based model. The model chooses an interesting color code. For instance, the words ‘Don’t’, ‘not’, ‘never’ are shown in red, which indicates they are negative, whereas word ‘good’ is shown in green, which indicates a positive word. Words in blue are features or attributes.
Display C6.38. Single Text File Testing Result (negative directory)
Display C6.39. Single Text File Testing Result (Positive directory)
Summary
Analyzing reviews from customers can provide insightful information, which in turn helps companies to improve their quality of service and help to differentiate their services from their competitors.
Prompt response is the key to win customer loyalty. This can only be done when there is an automatic system in place which can immediately classify customer’s feedback into positive and negative and provide appropriate response. Once the rules have been developed, it will be easy to set up an automatic scoring system for future comments that can be classified in real time when appropriate management interventions can happen.