The MEANS Procedure
What Does the MEANS Procedure Do?
The MEANS procedure
provides data summarization tools to compute descriptive statistics
for variables across all observations and within groups of observations.
For example, PROC MEANS does the following:
-
calculates descriptive statistics based on moments
-
estimates quantiles, which includes the median
-
calculates confidence limits for the mean
-
identifies extreme values
-
performs a t test
By default, PROC MEANS
displays output.
MEANS Procedure Syntax
The
MEANS procedure can include many statements and options for specifying
statistics.
|
Syntax, MEANS procedure:
PROC MEANS <DATA=SAS-data-set>
<statistic-keyword(s)> <option(s)>;
RUN;
|
Example: Default PROC MEANS Output
In its simplest form,
PROC MEANS prints the n-count
(number of non missing values), the mean, the standard deviation,
and the minimum and maximum values of every numeric variable in a
data set.
proc means data=cert.survey;
run;
Output 15.1 PROC MEANS Output of Cert.Survey

Specifying Descriptive Statistics Keywords
The
default statistics in the MEANS procedure are n-count
(number of nonmissing values), the mean, the standard deviation, and
the minimum and maximum values of every numeric variable in a data
set. However, you might need to compute a different statistic such
as median or range of the values. Use the statistic keyword option
in the PROC MEANS statement to specify one or more statistics to display
in the output.
Here
are the available keywords in the PROC statement:
|
Keyword
|
Description
|
|---|---|
|
CLM
|
The two-sided confidence
limit for the mean.
|
|
CSS
|
The sum of squares corrected
for the mean.
|
|
CV
|
The percent coefficient
of variation.
|
|
KURTOSIS | KURT
|
Measures the heaviness
of tails.
|
|
LCLM
|
The one-sided confidence
limit below the mean.
|
|
MAX
|
The maximum value.
|
|
MEAN
|
The arithmetic mean
or average of all the values.
|
|
MIN
|
The minimum value.
|
|
MODE
|
The value that occurs
most frequently.
|
|
N
|
The number of observations
with nonmissing values.
|
|
NMISS
|
The number of observations
with missing values.
|
|
RANGE
|
Calculated as the difference
between the maximum value and the minimum value.
|
|
SKEWNESS | SKEW
|
Measures the tendency
of the deviations to be larger in one direction than in the other.
|
|
STDDEV | STD
|
Is the standard deviation
s and is computed as the square root of the variance.
|
|
STDERR | STDMEAN
|
The standard error of
the mean.
|
|
SUM
|
Sum
|
|
SUMWGT
|
The sum of the weights.
|
|
UCLM
|
The one-sided confidence
limit above the mean
|
|
USS
|
The value of the uncorrected
sum of squares.
|
|
VAR
|
Variance.
|
|
Keyword
|
Description
|
|---|---|
|
MEDIAN | P50
|
The middle value or
the 50th percentile.
|
|
P1
|
1st percentile.
|
|
P5
|
5th percentile.
|
|
P10
|
10th percentile.
|
|
Q1 | P25
|
The lower quartile or
25th percentile.
|
|
Q3 | P75
|
The upper quartile or
75th percentile.
|
|
P90
|
90th percentile.
|
|
P95
|
95th percentile.
|
|
P99
|
99th percentile.
|
|
QRANGE
|
The interquartile range
and is calculated as the difference between the upper and lower quartile,
Q3– Q1.
|
|
Keyword
|
Description
|
|---|---|
|
PROBT | PRT
|
The two-tailed p-value
for Student's t statistic,
T, with
|
|
T
|
The Student’s t statistic
to test the null hypothesis that the population mean is equal to
 |
Example: Specifying Statistic Keywords
To determine the median
and range of Cert.Survey numeric values, add the MEDIAN and RANGE
keywords as options.
proc means data=cert.survey median range;
run;
Output 15.2 PROC MEANS Output of Cert.Survey Displays Only Median and Range

Limiting Decimal Places with MAXDEC= Option
By default, PROC MEANS uses the BESTw.
format to display numeric values in the report.
When there is no format specification,
SAS chooses the format that provides the most information about the
value according to the available field width. At times, this can result
in unnecessary decimal places, making your output hard to read. To limit
decimal places, use the MAXDEC= option in the PROC MEANS statement,
and set it equal to the length that you prefer.
|
Syntax, PROC MEANS statement
with MAXDEC= option:
PROC MEANS <DATA=SAS-data-set>
<statistic-keyword(s)> MAXDEC=n;
|
proc means data=cert.diabetes min max maxdec=0;
run;
Output 15.3 PROC MEANS Output of Cert.Diabetes with the MAXDEC= Option

Specifying Variables Using the VAR Statement
By default, the MEANS procedure generates statistics
for every numeric variable in a data set. But the typical focus is
on just a few variables, particularly if the data set is large. It
also makes sense to exclude certain types of variables. The values
of a numeric identifier variable ID, for example, are unlikely to
yield useful statistics.
To specify the variables that PROC MEANS analyzes, add
a VAR statement and list the variable names.
|
Syntax, VAR statement:
VAR variable(s);
|
proc means data=cert.diabetes min max maxdec=0;
  var age height weight;
run;
Output 15.4 Specifying Variables in the PROC MEANS Output of Cert.Diabetes

In addition to listing variables separately, you can
use a numbered range of variables.
proc means data=cert.survey mean stderr maxdec=2;
  var item1-item5;
run;
Output 15.5 PROC MEANS Output of Cert.Survey with Variable Range

Group Processing Using the CLASS Statement
You
often want statistics for groups of observations, rather than for
the entire data set. For example, census numbers are more useful when
grouped by region than when viewed as a national total. To produce
separate analyses of grouped observations, add a CLASS statement to
the MEANS procedure.
|
Syntax, CLASS statement:
CLASS variable(s);
|
CLASS variables are
used to categorize data. CLASS variables can be either character or
numeric, but they should contain a limited number of discrete values
that represent meaningful groupings. If a CLASS statement is used,
then the N Obs statistic is calculated. The N Obs statistic is based
on the CLASS variables, as shown in the output below.
The output of the program
shown below is grouped by values of the variables Survive and Sex.
The order of the variables in the CLASS statement determines their
order in the output table.
proc means data=cert.heart maxdec=1;
  var arterial heart cardiac urinary;
  class survive sex;
run;
Output 15.6 PROC MEANS Output Grouped by Values of Variables

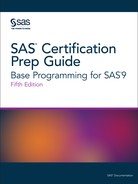
Group Processing Using the BY Statement
Like the CLASS statement, the BY statement specifies
variables to use for categorizing observations.
|
Syntax, BY statement:
BY variable(s);
|
But BY and CLASS differ
in two key ways:
-
Unlike CLASS processing, BY-group processing requires that your data already be sorted or indexed in the order of the BY variables. Unless data set observations are already sorted, you must run the SORT procedure before using PROC MEANS with any BY group.CAUTION:If you do not specify an output data set by using the OUT= option, PROC SORT overwrites the initial data set with newly sorted observations.
-
The layout of BY-group results differs from the layout of CLASS group results. Note that the BY statement in the program below creates four small tables; a CLASS statement would produce a single large table.
proc sort data=cert.heart out=work.heartsort;
  by survive sex;
run;
proc means data=work.heartsort maxdec=1;
  var arterial heart cardiac urinary;
  by survive sex;
run;
Figure 15.1 BY Groups Created by PROC MEANS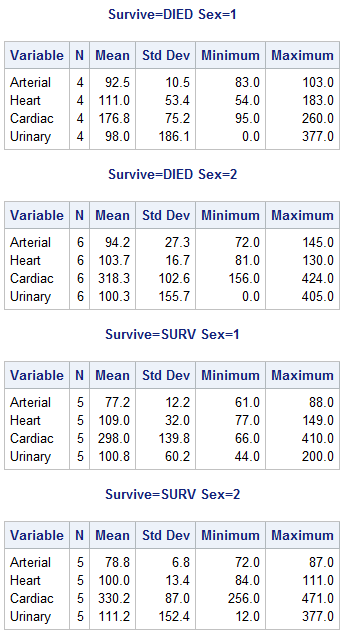 TipThe CLASS statement is easier to use than the BY statement because it does not require a sorting step. However, BY-group processing can be more efficient when your categories might contain many levels.
Creating a Summarized Data Set Using the OUTPUT Statement
To write summary statistics to a new data set, use the
OUTPUT statement in the MEANS procedure.
|
Syntax, OUTPUT statement:
OUTPUT OUT=SAS-data-set
statistic=variable(s);
Tip:You can use multiple OUTPUT
statements to create several OUT= data sets.
|
The OUTPUT statement writes statistics to a new SAS
data set. By default, the default summary statistics are produced
for all numeric variables or for the variables specified in the VAR
statement. To specify specific statistics to be produced in the new
SAS data set, specify output-statistic-specification= variable-name in
the OUTPUT statement.
The following example
creates a PROC MEANS report.
proc means data=cert.diabetes;
  var age height weight;                                /*#1*/
  class sex;                                            /*#2*/
  output out=work.diabetes_by_gender                    /*#3*/
    mean=AvgAge AvgHeight AvgWeight
    min=MinAge MinHeight MinWeight;
run;
proc print data=work.diabetes_by_gender noobs;          /*#4*/
  title1 'Diabetes Results by Gender';
run;
| 1 | Specify the analysis variables. The VAR statement specifies that PROC MEANS calculate the default statistics on the Age, Height, and Weight variables. |
| 2 | Specify subgroups for the analysis. The CLASS statement separates the analysis by the values of Sex. |
| 3 | Specify the output data set options. The OUTPUT statement creates the Work.Diabetes_By_Gender data set and writes the mean value to the new variables AvgAge, AvgHeight, and AvgWeight. The statement also writes the min value to the new variables, MinAge, MinHeight, and MinWeight. |
| 4 | Print the output data set Work.Diabetes_By_Gender. The NOOBS option suppresses the observation numbers. |
The following output
is of Cert.Diabetes from the MEANS procedure.
Output 15.7 PROC MEANS Output of Cert.Diabetes
In addition to the variables
that you specify, PROC MEANS adds the following variables to the output
set.
_FREQ_
contains the number
of observations that a given output level represents.
_STAT_
contains the names
of the default statistics if you omit statistic keywords.
_TYPE_
contains information
about the class variables. By default _TYPE_ is a numeric variable.
If you specify CHARTYPE in the PROC statement, then _TYPE_ is a character
variable. When you use more than 32 class variables, _TYPE_ is automatically
a character variable.
The following output
is of Work.Diabetes_By_Gender from the PRINT procedure.
Output 15.8 PROC PRINT Output of Work.Diabetes_By_Gender

Tip
You can use the NOPRINT option
in the PROC MEANS statement to suppress the default report.
Last updated: August 23, 2018
..................Content has been hidden....................
You can't read the all page of ebook, please click here login for view all page.