
6 ESTIMATING
LEARNING OUTCOMES
When you have completed this chapter you should be able to demonstrate an understanding of the following:
- the effects of over- and under-estimating;
- effort versus duration;
- the relationship between effort and cost;
- estimates and targets;
- use of expert judgement, including its advantages and disadvantages;
- the Delphi approach;
- top-down estimating
- bottom-up estimating;
- the use of analogy in estimating.
6.1 INTRODUCTION
In Chapter 2, we explained how to draw up a plan for a project. One of the things that we did was to allocate an estimated duration to each of the activities to be carried out. This allowed us to calculate the overall duration of the project and to identify when we would need to call upon the services of individuals to carry out their tasks. In this chapter, we will explore further the ways in which these estimates can be produced.
6.2 WHAT WE ESTIMATE AND WHY IT IS IMPORTANT
6.2.1 Effort versus duration
As well as estimating the time from the start to the end of an activity, it is also necessary to assess the amount of effort needed. Duration should not be confused with effort. For example, if it takes one worker two hours to clear a car park of snow then, all other things being equal, it takes two workers only one hour. In both cases, the effort is two hours but the activity duration is two hours in one case and only one hour in the other. There can be cases where the duration is longer: for example, where someone only works in the afternoons on a particular task. In fact, a problem is that activities often take longer than planned even though the effort has not increased. This may happen, for instance, when you have to wait for approval from a higher level of management before a job is signed off. This distinction between effort and duration can be particularly important when assessing the probable cost of a project, as on some projects staff costs are governed by the hours actually worked (typically where staff complete timesheets), while on others the costs are governed by the time in which people are employed on the project (even if there is not always work for them to do).
6.2.2 The effects of over- and under-estimating
If effort and duration are under-estimated, the project can fail because it has exceeded its budget or has been delayed beyond its agreed completion date. This may be so even when staff have worked efficiently and conscientiously. Allocating less time and money than is really needed can also affect the quality of the final project deliverables: team members may work hard to meet deadlines but, as a consequence, produce sub-standard work.
On the other hand, estimates that are too generous can also be a problem. If the estimate is the basis for a bid to carry out some work for an external customer, then an excessively high estimate may lead to the work being lost to a competitor. Parkinson’s Law (‘work expands to fill the time available’) means that an excessively generous estimate may lead to lower productivity. If a task is allocated four weeks when it really needs only three, there is a chance that, with the pressure removed, staff will take the planned time.
6.2.3 Estimates and targets
Identifying the exact time it will take to do something is very difficult because, if the same task is repeated a number of times, each instance of the task execution is likely to have a slightly different duration. Take going to work by car. It is unlikely that on any two days this will take exactly the same amount of time. The journey time will vary because of factors such as weather conditions and the pressure of traffic. This means that an estimate of effort or time is really a most likely effort/time with a range of possibilities on each side of it. Within this range of times we can choose a target – we can go for an ‘aggressive’ target which may get the job done quickly, but with a strong possibility of failure, or a more generous estimate which is likely to expand the length of time needed, but have a safer chance of the target being met. The target, if at all reasonable, can become a self-fulfilling prophecy – with the commuting example, if you know that you are going to be late you may take steps to speed up, perhaps by taking an alternative route if the normal one is congested. Estimating can thus have a ‘political’ aspect. Some managers may reduce estimates, either to gain acceptance for a proposed project, or as a means of pressurising developers to work harder. There are clearly risks involved in such an approach, as well as possible ethical issues.
6.3 EXPERT JUDGEMENT
6.3.1 Using expert judgement
Where do you start if you want to produce reasonable estimates? Although estimating is treated as a separate, isolated topic in project management and information systems development, it in fact depends on the completion of other tasks that provide information for estimates. For a start, you need to know:
- What activities are going to be carried out during the course of the project;
- How much work is going to have to be carried out by these activities.
For example, to work out how long it will take to install some software on all the workstations in an organisation, we need to know approximately how long it takes to install the software on a single workstation and how many workstations there are in the organisation. We may also need to know how geographically dispersed the workstations are. The best person to tell us about these things would be someone familiar with the tasks to be carried out and the environment in which they are done. As a general rule, the best people to estimate effort are those who are experts in the area. As a consequence, most guides to estimating identify expert opinion or expert judgement as an estimating method.
Although ‘phoning a friend’ can be a very sensible approach, there remains the question of how the experts themselves derive their estimates. There is a possibility that they have their own experts upon whom they can call, but at some point someone must sit down and work out the estimate based on their own judgement – and the likelihood is that they will end up using the analogy approach described below.
The advantages of using expert judgement include the following:
- It involves the people with the best experience of similar work in the past and the best knowledge of the work environment;
- The people who are most likely to be doing the work are involved with the estimating process – they will be more motivated to meet the targets set if they have had a hand in setting them in the first place.
There are, however, some balancing risks:
- The task to be carried out may be a new one of which there is no prior experience;
- Experts can be prone to human error – they may, for example, underestimate the time that they would need to carry out a task in case a larger figure suggests that they are less capable;
- It can be difficult for the project planner to evaluate the quality of an estimate that is essentially someone else’s guess;
- Large, complex tasks may require the expertise of several different specialists.
6.3.2 The Delphi approach
One method that attempts to improve the quality of expert judgement is the Delphi technique which originated in the Rand corporation in the USA. There are different versions of this, but the general principle is that a group of experts are asked to produce, individually and without consulting others, an estimate supported by some kind of rationale. These are all forwarded to a moderator who collates the replies and circulates them back to the group as a whole. Each member of the group can now read the anonymous estimates and supporting rationales of the other group members. They may now submit a revised opinion. Hopefully, the opinions of the experts should converge on a consensus.
The justification for the technique is that it should lead to people’s views being judged on their merits and undue deference will not be paid to more senior staff or the more dominant personalities.
6.4 APPROACHES TO ESTIMATING
We are now going to discuss key approaches to estimating. However, first we are going to explain the terms bottom-up and top-down. Note that these are not specific estimating methods, but describe a way of grouping estimating methods.
6.4.1 Bottom-up
In essence, we break the task for which an estimate is to be produced into component sub-tasks and then break the component sub-tasks into sub-sub-tasks and so on, until we get to elements that we think would not take one or two people more than a week to complete. The idea is that you can realistically imagine what can be accomplished in one or two weeks in a way that would not be possible for one or two months. To get an overall estimate of the effort needed for the project, you simply add up all the effort for the component tasks.
This method is also sometimes called analytical or activity-based estimating. Some people (especially those who are or who have been software developers) find the name ‘bottom-up’ confusing because the first part of the process is really top-down!
ACTIVITY 6.1
Which planning product identified in Chapter 2 could be the basis for an initial bottom-up estimate?
A bottom-up estimate is recommended where you have no accurate historical records of relevant past projects to guide you. A disadvantage of the method is that it is very time-consuming as you have, in effect, to draw up a detailed plan of how the project is to be carried out first. It could be argued that you are going to have to do this anyway. However, it may be a very tedious and speculative task if you have been asked for a rough estimate at the feasibility study stage of the project proposal.
ACTIVITY 6.2
You have been asked to organise the recruitment of staff for the new network support centre needed for the Canal Dreams ebooking enhancement. Identify the component activities in this overall task, as you would for the first stage of the bottom-up approach to estimating effort.
6.4.2 Top-down
With the top-down approach, we look for some overall characteristics of the job to be done and, from these, produce a global effort estimate. This figure is nearly always based on our knowledge of past cases.
An example of top-down estimating is when house owners have to make decisions about the sum for which they should insure their house. The question here is the probable cost of rebuilding the house in the event of it being destroyed, for example by fire. Most insurance companies produce a handy set of tables where you can look up such variables as the number of storeys your house has, the number of bedrooms, the area of floor-space, the material out of which it has been constructed and the region in which it is located. For each combination of these characteristics a rebuilding cost will be suggested. The insurance company can produce such tables as it has access to many historical records of the actual cost of rebuilding houses.
This is essentially a top-down approach because only one global figure is produced. In the unhappy case of a fire actually occurring, this figure would not help a builder to calculate how much effort would be needed to dig the foundations, build the walls, put on the roof and all the other individual components of the building operation. A builder may be able to use past experience of the proportion of total costs usually consumed by each type of activity, such as foundation digging.
6.5 A PARAMETRIC APPROACH
The base estimate created when using a top-down approach can be derived in a number of ways. In estimating the costs of rebuilding a house, a parametric method was used. This means that the estimate was based on certain variables or parameters (for example, the number of storeys in the house and the number of bedrooms). These parameters can be said to ‘drive’ the size of the house to be built: you would expect a house with three storeys and five bedrooms to be physically bigger than a bungalow with only two bedrooms. These parameters are therefore sometimes called size drivers. You would also expect the three-storey building to need more work, or effort, to build than the bungalow. These parameters are therefore also sometimes called effort drivers.
6.5.1 Size drivers and productivity
Earlier we had an example where a technician was allocated the job of installing a new piece of software on every workstation in an organisation. Clearly, the more workstations there are, the bigger the job and the longer its duration. Hence the number of workstations is a size driver and an effort driver for this activity.
ACTIVITY 6.3
Identify the possible size and effort drivers in the Canal Dreams ebooking enhancement for each of the following activities:
(a) Creating training material for users;
(b) Analysing business processes;
(c) Carrying out acceptance tests;
(d) Writing and testing software.
In order to produce an estimate of effort using this method, we also need a productivity rate. For example, in addition to the number of workstations we would need to know the average time needed to install the software on a single workstation. This time per workstation would be the productivity rate. If this rate was 12 minutes per workstation and there were 50 workstations then we could guess the overall duration of the job would be around 50 × 12 minutes – that is, about ten hours.
The usual way to obtain the productivity rate is from records of past projects. Where these are not available within an organisation, it is sometimes possible to obtain ‘industry’ data that relates not to projects in a single organisation, but to projects in a particular industrial sector. This kind of information can help managers compare the productivity in their organisation with that of others – this is sometimes called benchmarking. If they find that they have much lower productivity, this may spur them on to search for more productive ways of working. However, caution needs to be practised if the reason for using industry data is that local project data is missing: there can be large differences in productivity between organisations, because organisations and their businesses are so different.
ACTIVITY 6.4
In the earlier example about the time needed to drive to work, identify:
(a) the size driver;
(b) the productivity rate;
(c) other factors that may cause a variation in the time it takes to get to work.
The additional factors are called productivity drivers. A key productivity driver when it comes to developing and implementing IT systems is experience. When putting a figure on how long a technical activity like developing software code is going to take, more experienced estimators will try to find out who will be doing the work.
Productivity drivers vary from activity to activity, but other drivers often include:
- the availability of tools to assist in the work;
- communication overheads, including the time it takes to get requirements clarified and approved;
- the stability of the environment – that is, the extent to which the work has to cope with changes to requirements or resources;
- the size of the project team: there is a tendency for larger jobs involving lots of people to be less efficient than smaller ones because more time has to be spent on management, planning and co-ordination at the expense of ‘real work’.
The problems that can affect productivity are often considered at the same time as risks to the project in general (see Chapter 7).
6.5.2 Function points
There was a time when almost all IT projects involved writing software of some description. This is now increasingly less the case for many reasons, one of which is the tendency to use ‘off-the-shelf’ software applications. However, there are still many cases where software has to be written specially, and these situations can cause particular challenges for the estimation of development effort.
If we use a parametric approach, the first question is what to use as size drivers. If IT is old enough to have any real ‘traditions’, then one of the longest established of these would be to use lines of code as the size driver for software development. (When software is written, the programmer writes the instructions – as lines of code – in a form which is comprehensible to human experts. This ‘code’ is an electronic document which can be changed, added to and printed. When the code is to be executed by the computer, the document is ‘read’ by a special piece of software which converts it into a format that the computer can interpret automatically.)
From this very brief explanation it can be seen that:
- the code is a very technical product – it would need a software expert to estimate the number of lines of code;
- you will not know the exact number of lines of code until quite near the end of the project; most other size drivers are known at the beginning, or at least at an early stage, of the project.
Things are also complicated by there being many programming languages. Some are more ‘powerful’ than others – that is, they need fewer lines of code to carry out a particular procedure.
Rather than use this technical unit of size which is invisible to everyone except the software developers, it is more convenient to use as the size drivers counts externally apparent features of the software application. This would be rather like using the number of storeys, the floor space and so on to estimate the cost of a house, rather than the number of bricks. With software applications, this can be done with function points.
![]()
ADVANCED TOPIC Function points
For the purposes of the Foundation Certificate, you do not need to know the details of the rules of function point counting. There are at least two major systems of function point counting and some of the detailed rules are rather arcane, to say the least. The following description should be enough to give a general idea of the approach. (It is based on one particular version – Mark II, or Symons, function points – simply because this is, in our view, the simplest method for getting an understanding of the general principles of the approach.)
(a) The size drivers are features of the software that are apparent to the user. In general, users are aware of the transactions that they can carry out when using a software application. A transaction is where the user inputs something into the computer (normally by typing), the computer carries out a procedure and comes up with a response, normally in the form of an output, and the computer system is left in a consistent state. This is similar to a use case in UML.
When booking a boating holiday using the new Canal Dreams ebooking system, you make a mistake (for example, typing in an invalid date) and an error message is displayed. Although an input has been followed by an output (the error message), the system is not in a consistent state: only half the booking details have been set up. In this case the processing so far would not be regarded as a transaction: either the whole booking would be rejected or the processing would continue until a complete and correct set of booking details had been input.
(b) For each type of transaction, a count is made of the number of items of information that are input and output, and the number of tables of information that are accessed. In general, it can be assumed that the more of these there are, the more lines of code will have to be written, and the more work there will be for the system developers.
(c) The counts are weighted to take account of the relative difficulty of implementing each type of feature. For example, a simple output is normally easier to implement than an input. With inputs you often have to carry out error checking, which adds to the developer’s work. To take account of these differences in difficulty, the feature counts are weighted appropriately. In the Mark II method, inputs are weighted 0.58, outputs 0.26 and entity (or table) accesses 1.66. Effectively this means that the weighting between inputs, outputs and entity accesses is about 2:1:6. The use of such peculiar numbers is because the inventor of this method wanted the resulting function point counts to be about the same as for the American method (specified by the international function point user group, IFPUG) and hoped to achieve this by making the weightings add up to 2.50 (that is, 0.58 + 0.26 + 1.66).
A restriction on the use of function point counting is that it assumes that there is a human operator initiating transactions and receiving outputs from the system. COSMIC function points are an alternative approach that can be used to measure the size of embedded software which interfaces with other software and hardware layers rather than human users.
6.5.3 An example of function point counting
Within the Canal Dreams ebooking system, there is a transaction which records the final payment made by a customer for a booking for which they have already paid a deposit. There are three inputs for a new payment:
- date;
- customer account reference;
- amount.
There are four possible outputs from the transaction:
- payment reference, a number allocated automatically by the computer system;
- customer name;
- customer address;
- an error message.
To carry out this transaction, a CUSTOMER ACCOUNT table and a PAYMENT table are accessed, giving two entity accesses. The function point count for this transaction is therefore:
(3 × 0.58) + (4 × 0.26) + (2 × 1.66), that is, 6.10.
What does this 6.10 really represent? It is best regarded as an index value that gives an idea of the amount of processing carried out by the transaction. For a single, isolated transaction, this measure is not very accurate. However, if you were able to add up the function point counts for all the transactions in an information system, then it is likely that the count for the application as a whole would be a useful indicator of its size.
We can use a function point count to find out the relative productivity of development projects that have already been completed. We may find that the average number of function points implemented per day is around five. This may seem a rather small number, but ‘development effort’ here includes the whole development cycle, from requirements gathering to testing. When a new project proposal comes along, a preliminary investigation may suggest that the delivered system would have a count of about 250 function points. The estimated effort is therefore in the region of 250/5 days – that is, 50 days.
6.6 ESTIMATING BY ANALOGY
The function point approach (and, indeed, the more generic approach of using size drivers and productivity rates) is based on the assumption that we have the details of the size driver values and actual effort of past projects. Often, however, such records do not exist. For smaller organisations particularly, the IT projects that have been previously implemented may all seem to have their own peculiarities. For example, some may have involved the installation of off-the-shelf packages, others may have required specially written software, some a mixture of the two, and so on. This seems to suggest that previous experience is not a stable basis for estimating the effort for new projects. However, in this kind of situation the analogy or comparative approach could be used.
The main steps with this method are as follows.
(a) Identify the key characteristics of the new project.
(b) Search for a previous project which has similar characteristics.
(c) Use the actual effort recorded for the previous project as the base estimate for the new one.
(d) Identify the key differences between the old and the new projects (it is unlikely that the old project is an exact match for the new one).
(e) Adjust the base estimate to take account of the identified differences.
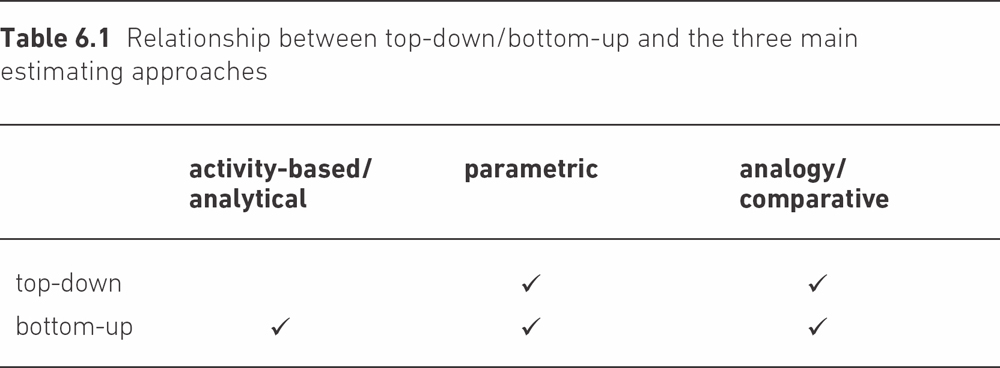
An analogy approach can be used to create a top-down estimate for a project. Where there is no past project which seems to be a useful analogy for the new project, an estimator can use analogy to select parts of old projects that seem similar to components of the current project (using analogy as part of a bottom-up approach).
As Table 6.1 shows, both analogy and the parametric approaches can be used either at the overall level of a project or for estimating the effort needed for components. The activity-based approach – breaking down the overall task into smaller components – seems almost by definition to be a bottom-up approach.
6.7 CHECKLIST
As a project planner you may often need to use the effort estimates produced by experts from technical areas in which you are not knowledgeable. Are there any ways in which you can realistically review these estimates? It may be possible to assess the plausibility of the estimates by asking the estimator the questions below.
- What methods were used to produce the estimates?
- How is the relative size of the job measured (in other words, what are the size/effort drivers)?
- How much effort was assumed would be required for each unit of the size driver (in other words, what productivity rates are you assuming)?
- Can a past project of about the same size be identified which had about the same effort?
- If a job with a comparable size cannot be identified, can past jobs which had similar productivity rates be found?
SAMPLE QUESTIONS
XYZ ORGANISATION SCENARIO
Staff have managed to develop information systems at a rate of five function points per staff day. A new system has been assessed as requiring 120 function points to implement, but the staff available are relatively inexperienced and are only 80% as productive as the staff usually used in such projects.
1. An under estimate of effort is MOST likely to lead to which of the following?
(a) decreased productivity
(b) decreased quality
(c) a less competitive bid for a contract
(d) a longer project duration
2. Which of the following estimating methods is MOST likely to be used bottom-up?
(a) parametric
(b) algorithmic
(c) Delphi
(d) activity-based
Both questions 3 and 4 use this scenario.
3. In the XYZ scenario, of which of the following is 80% of the value?
(a) a size driver
(b) an effort driver
(c) a productivity rate
(d) a productivity driver
4. In the XYZ scenario, what would be the best estimate of effort for the project?
(a) 30 days
(b) 25 days
(c) 24 days
(d) 20 days
ANSWERS TO SAMPLE QUESTIONS
1. (b) 2. (d) 3. (d) 4. (a)
POINTERS FOR ACTIVITIES
ACTIVITY 6.1
The work breakdown structure (or possibly the product breakdown structure).
ACTIVITY 6.2
Among the activities that may need to be carried out are:
- Create/agree job descriptions
- Create job advertisements
- Collect and assess applications and curricula vitae (CVs) from potential employees
- Invite selected candidates
- Interview candidates
- Notify successful and unsuccessful candidates
- Request, await and check references
- Confirm appointment
- Arrange induction
- Carry out induction processes
This set of activities offers some good illustrations of the difference between elapsed time and effort. There will be some points – for example where you are waiting for references – where little effort is expended but time will be passing.
ACTIVITY 6.3
The following are suitable answers:
(a) The number of functions that users need to be able to use.
(b) The number of different types of system user (as each will need to be interviewed for their requirements), and the number of different operations carried out in the system.
(c) The number of functions to be tested and the number of input and output data items to be tested.
(d) The number of different functions in the system, the number of inputs, outputs and tables accessed.
ACTIVITY 6.4
(a) The size driver would be the distance driven to work.
(b) The productivity rate would be the average speed of the car.
(c) We have already suggested that the weather and the amount of traffic congestion could have an effect on the travel time.
In this case, the weather and traffic do not increase the size of the job to be done – the distance to work remains the same. These factors are best seen as influences on the productivity rate. In order to assess more accurately the time it takes me to go to work, I could take account of these intermittent constraints on my speed. I may be aware, for instance, that the rush-hour traffic in the morning tends to be significantly less heavy during school holidays. I could therefore perhaps allow myself to start off to work a few minutes later when it is half-term. On the other hand, I may start earlier if the weather is foggy, as I know that this can slow down the traffic.