
The VSTOXX data file vstoxx.txt, which we downloaded earlier, consists of eight sub-indexes that represent the calculated volatility index from the EURO STOXX 50 options that expire in 1, 2, 3, 6, 9, 12, 18, and 24 months. The VSTOXX Index represents the volatility outlook for the next 30 days, and it is the option series with the nearest expiry date over the next 30 days that is taken into account for the calculation of the VSTOXX Index.
To help us examine the movement of the VSTOXX Index, we would need to study the movement of its component sub-index. To do so, we would need to refer to the OESX calls and put prices listed in the Eurex Exchange.
The Eurex Exchange website contains the daily historical call and put options prices for the past 30 days. Unfortunately, there is no direct method of downloading and obtaining the data directly. A Python utility function is needed to scrape data off the web page and store it in a pandas DataFrame object for our analysis. The data can be obtained from
http://www.eurexchange.com/exchange-en/market-data/statistics/market-statistics-online.
A screenshot of the option prices web page is given as follows:
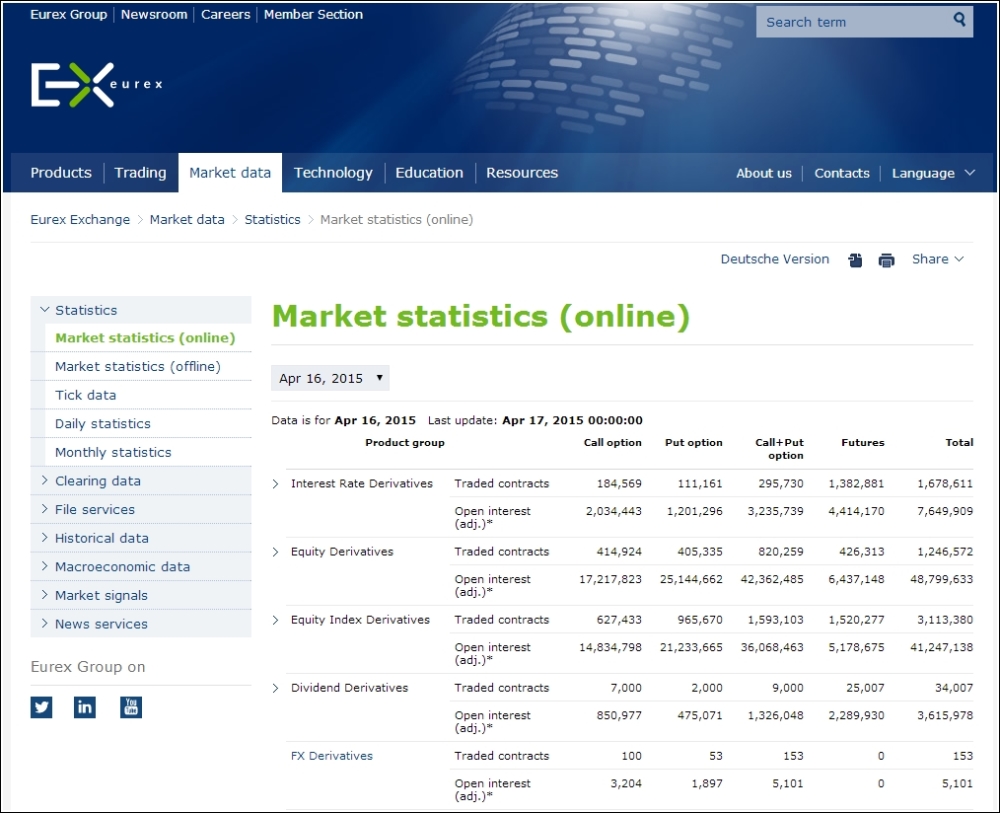
In the Market statistics (online) page, navigate to Equity Index Derivatives, then Blue Chip. Click on OESX. Some key information is presented on this page. Firstly, the drop-down box contains a list of available dates to choose from. Secondly, it contains the last updated date and time of the prices on the page. Thirdly, it contains a table that shows the option of the expiry month for the selected date. Selecting an option type and expiry month brings us to a page containing a table of the daily option prices.
The following screenshot shows the call prices for the selected date. The put prices are contained in a separate link:
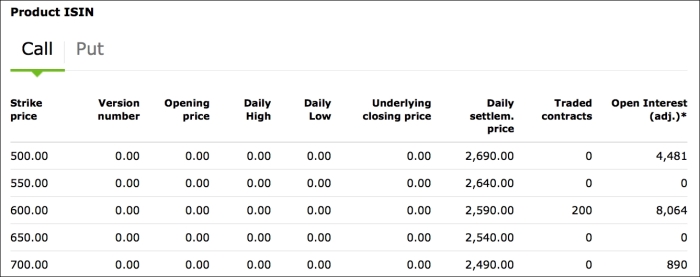
The table contains comprehensive information about the option prices. The two columns that we are interested in are Strike price and Daily settlem. price. From the values of these two columns, we can then derive the hypothetical sub-index value for the chosen expiry month.
The STOXX Strategy Index Guide is available on the STOXX website at http://www.stoxx.com/download/indices/rulebooks/stoxx_strategy_guide.pdf. This document contains details on the formulas used to calculate its indexes in the Eurex system.
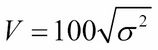
The value of the VSTOXX sub-index is given as:
Here:
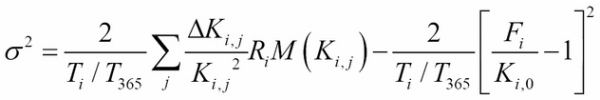
![]() is the time to maturity of the
is the time to maturity of the ![]() OESX instrument in terms of seconds, and
OESX instrument in terms of seconds, and ![]() is the number of seconds in a 365-day year.
is the number of seconds in a 365-day year.
![]() is the highest strike price that does not exceed the forward price
is the highest strike price that does not exceed the forward price ![]() .
.
![]() is the forward at-the-money price calculated from the price of the
is the forward at-the-money price calculated from the price of the ![]() OESX expiry date, where the absolute difference between the call prices (C) and put prices (P) is the smallest and can be written as:
OESX expiry date, where the absolute difference between the call prices (C) and put prices (P) is the smallest and can be written as:
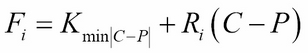
Should multiple identical price differences exist, ![]() will be the closest strike price below the average of these forward prices.
will be the closest strike price below the average of these forward prices.
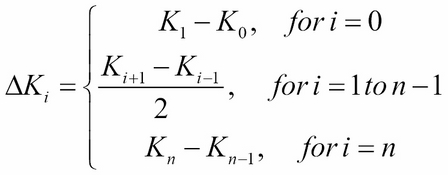
![]() is the mean distance between the lower and upper strike prices of
is the mean distance between the lower and upper strike prices of ![]() . At the maximum and minimum strike price boundaries,
. At the maximum and minimum strike price boundaries, ![]() is taken to be the difference of the highest and second highest strike price. This value can also be written as:
is taken to be the difference of the highest and second highest strike price. This value can also be written as:
![]() is the continuously compounded interest rate of the time remaining to maturity and can be written as:
is the continuously compounded interest rate of the time remaining to maturity and can be written as:
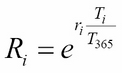
Here ![]() is the interpolated interest rate available for the
is the interpolated interest rate available for the ![]() OESX expiry date.
OESX expiry date.
![]() is the price of the out-of-the-money option. This value takes on the put prices for the strike prices below
is the price of the out-of-the-money option. This value takes on the put prices for the strike prices below ![]() and call prices for the strike prices above
and call prices for the strike prices above ![]() . At
. At ![]() , this value is the average of the sum of the call and put prices. This can also be written as:
, this value is the average of the sum of the call and put prices. This can also be written as:

Let's create the classes that will help us read data from the Eurex web page, parse the data, calculate the sub-index values, and save them in a CSV file.
The OptionUtility class contains a number of utility methods that will help us perform the date and time conversion functions between strings and Python date objects. The various OptionUtility classes are explained as follows:
- The
VSTOXXCalculatorclass contains thecalculate_sub_indexmethod that implements the formulas for calculating the sub-index for a particular option series. - The
EurexWebPageclass contains methods for interacting with the data on the Eurex web page. ThelxmlPython module is required. It can be obtained at http://lxml.de. - The
VSTOXXSubIndexclass contains the following methods for fetching the data and calculating the sub-indexes of an external file. The source code for all the classes are given at the end of this section:__init__(self, path_to_subindexes): This method contains the initialization of object instances used throughout this class. The final output values are stored in a CSV file, which is indicated by thepath_to_subindexesvariable.start(self, months=2, r=0.015): This is the main method to begin the process of downloading and calculating the data. By default, we are interested in calculating the sub-index, where the options expire in 2 months. An interest rate of 1.5 percent is assumed. Aforloop is used to process each particular historical data iteratively. Using theprintfunction within theforloop, helps us track our progress since it could take a while to read and calculate all the required sub-indexes.calculate_and_save_sub_indexes(self, selected_date, months_fwd, r): This method takes in a date selected from the drop-down list and fetches the option series data for the next month onwards till the expiry month, which is given by themonths_fwdvariable. For every expiry month information fetched, the sub-index is calculated and saved in a CSV file.save_vstoxx_sub_index_to_csv(self, current_dt, sub_index, month): This method saves a single sub-index value for a single expiry month for a single trading day in a CSV file in the form of a pandasDataFrameobject. If theDataFrameobject does not exist, one is created. Otherwise, the existing data is appended toDataFrameand saved.get_data(self, current_dt, expiry_dt): This method fetches the call and put option series data separately, which is then combined into a single pandasDataFrameobject. The dataset and the time of data, as shown in the web page, is returned.
To run the program, we simply call the start method to collect the historical option series data that expires in 2 months:
>>> vstoxx_subindex = VSTOXXSubIndex(
...     "data/vstoxx_sub_indexes.csv")
>>> vstoxx_subindex.start(2)
Collecting historical data for 20141030 ...
Collecting historical data for 20141031 ...
Collecting historical data for 20141103 ...
…
Collecting historical data for 20141126 ...
Completed.
The data will be saved in data/vstoxx_sub_indexes.csv in our working directory folder.
The following Python code is the full implementation of all the classes:
import calendar as cal
import datetime as dt


class OptionUtility(object):

    def get_settlement_date(self, date):
        """ Get third friday of the month """
        day = 21 - (cal.weekday(date.year, date.month, 1) + 2) % 7
        return dt.datetime(date.year, date.month, day, 12, 0, 0)

    def get_date(self, web_date_string, date_format):
        """  Parse a date from the web to a date object """
        return dt.datetime.strptime(web_date_string, date_format)

    def fwd_expiry_date(self, current_dt, months_fws):
        return self.get_settlement_date(
            current_dt + relativedelta(months=+months_fws))


import math


class VSTOXXCalculator(object):

    def __init__(self):
        self.secs_per_day = float(60*60*24)
        self.secs_per_year = float(365*self.secs_per_day)

    def calculate_sub_index(self, df, t_calc, t_settle, r):
        T = (t_settle-t_calc).total_seconds()/self.secs_per_year
        R = math.exp(r*T)

        # Calculate dK
        df["dK"] = 0
        df["dK"][df.index[0]] = df.index[1]-df.index[0]
        df["dK"][df.index[-1]] = df.index[-1]-df.index[-2]
        df["dK"][df.index[1:-1]] = (df.index.values[2:]-
                                    df.index.values[:-2])/2
        # Calculate the forward price
        df["AbsDiffCP"] = abs(df["Call"]-df["Put"])
        min_val = min(df["AbsDiffCP"])
        f_df = df[df["AbsDiffCP"]==min_val]
        fwd_prices = f_df.index+R*(f_df["Call"]-f_df["Put"])
        F = np.mean(fwd_prices)

        # Get the strike not exceeding forward price
        K_i0 = df.index[df.index <= F][-1]

        # Calculate M(K(i,j))
        df["MK"] = 0
        df["MK"][df.index < K_i0] = df["Put"]
        df["MK"][K_i0] = (df["Call"][K_i0]+df["Put"][K_i0])/2.
        df["MK"][df.index > K_i0] = df["Call"]

        # Apply the variance formula to get the sub-index
        summation = sum(df["dK"]/(df.index.values**2)*R*df["MK"])
        variance = 2/T*summation-1/T*(F/float(K_i0)-1)**2
        subindex = 100*math.sqrt(variance)
        return subindex


import urllib
from lxml import html


class EurexWebPage(object):

    def __init__(self):
        self.url = "%s%s%s%s%s" % (
            "http://www.eurexchange.com/",
            "exchange-en/market-data/statistics/",
            "market-statistics-online/180102!",
            "onlineStats?productGroupId=846&productId=19068",
            "&viewType=3")
        self.param_url = "&cp=%s&month=%s&year=%s&busDate=%s"
        self.lastupdated_dateformat = "%b %d, %Y %H:%M:%S"
        self.web_date_format = "%Y%m%d"
        self.__strike_price_header__ = "Strike price"
        self.__prices_header__ = "Daily settlem. price"
        self.utility = OptionUtility()

    def get_available_dates(self):
        html_data = urllib.urlopen(self.url).read()
        webpage = html.fromstring(html_data)

        # Find the dates available on the website
        dates_listed = webpage.xpath(
            "//select[@name='busDate']" +
            "/option")

        return [date_element.get("value")
                for date_element in reversed(dates_listed)]

    def get_date_from_web_date(self, web_date):
        return self.utility.get_date(web_date,
                                     self.web_date_format)

    def get_option_series_data(self, is_call,
                               current_dt, option_dt):
        selected_date = current_dt.strftime(self.web_date_format)
        option_type = "Call" if is_call else "Put"
        target_url = (self.url +
                      self.param_url) % (option_type,
                                         option_dt.month,
                                         option_dt.year,
                                         selected_date)
        html_data = urllib.urlopen(target_url).read()
        webpage = html.fromstring(html_data)
        update_date = self.get_last_update_date(webpage)
        indexes = self.get_data_headers_indexes(webpage)
        data = self.__get_data_rows__(webpage,
                                      indexes,
                                      option_type)
        return data, update_date

    def __get_data_rows__(self, webpage, indexes, header):
        data = pd.DataFrame()
        for row in webpage.xpath("//table[@class='dataTable']/" +
                                 "tbody/tr"):
            columns = row.xpath("./td")
            if len(columns) > max(indexes):
                try:
                    [K, price] =
                        [float(columns[i].text.replace(",",""))
                         for i in indexes]
                    data.set_value(K, header, price)
                except:
                    continue
        return data

    def get_data_headers_indexes(self, webpage):
        table_headers = webpage.xpath(
            "//table[@class='dataTable']" +
            "/thead/th/text()")
        indexes_of_interest = [
            table_headers.index(
                self.__strike_price_header__),
            table_headers.index(
                self.__prices_header__)]
        return indexes_of_interest

    def get_last_update_date(self, webpage):
        return dt.datetime.strptime(webpage.
                                    xpath("//p[@class='date']/b")
                                    [-1].text,
                                    self.lastupdated_dateformat)


import pandas as pd

from dateutil.relativedelta import relativedelta
import numpy as np
import thread

class VSTOXXSubIndex:

    def __init__(self, path_to_subindexes):
        self.sub_index_store_path = path_to_subindexes
        self.utility = OptionUtility()
        self.webpage = EurexWebPage()
        self.calculator = VSTOXXCalculator()
        self.csv_date_format = "%m/%d/%Y"

    def start(self, months=2, r=0.015):
        # For each date available, fetch the data
        for selected_date in self.webpage.get_available_dates():
            print "Collecting historical data for %s..." %
                  selected_date
            self.calculate_and_save_sub_indexes(
                selected_date, months, r)

        print "Completed."

    def calculate_and_save_sub_indexes(self, selected_date,
                                       months_fwd, r):
        current_dt = self.webpage.get_date_from_web_date(
            selected_date)

        for i in range(1, months_fwd+1):
            # Get settlement date of the expiring month
            expiry_dt = self.utility.fwd_expiry_date(
                current_dt, i)

            # Get calls and puts of expiring month
            dataset, update_dt = self.get_data(current_dt,
                                               expiry_dt)
            if not dataset.empty:
                sub_index = self.calculator.calculate_sub_index(
                    dataset, update_dt, expiry_dt, r)
                self.save_vstoxx_sub_index_to_csv(
                    current_dt, sub_index, i)

    def save_vstoxx_sub_index_to_csv(self, current_dt,
                                     sub_index, month):
        subindex_df = None
        try:
            subindex_df = pd.read_csv(self.sub_index_store_path,
                                      index_col=[0])
        except:
            subindex_df = pd.DataFrame()

        display_date = current_dt.strftime(self.csv_date_format)
        subindex_df.set_value(display_date,
                              "I" + str(month),
                              sub_index)
        subindex_df.to_csv(self.sub_index_store_path)

    def get_data(self, current_dt, expiry_dt):
        """ Fetch and join calls and puts option series data """
        calls, dt1 = self.webpage.get_option_series_data(
            True, current_dt, expiry_dt)
        puts, dt2 = self.webpage.get_option_series_data(
            False, current_dt, expiry_dt)
        option_series = calls.join(puts, how='inner')
        if dt1 != dt2:
            print "Error: 2 different underlying prices."

return option_series, dt1In the data folder of our working directory, we should have the following two files by now: vstoxx.csv and vstoxx_sub_indexes.csv. The sub-indexes file contains the computed values of the sub-index. Using the following Python code, we can plot the values of 2 months to expiry sub-index values:
import pandas as pd

vstoxx_sub_indexes = pd.read_csv('data/vstoxx_sub_indexes.csv',
                                 index_col=[0],
                                 parse_dates=True, dayfirst=False)
vstoxx = pd.read_csv('data/vstoxx.csv', index_col=[0],
                     parse_dates=True, dayfirst=False)

start_dt = min(vstoxx_sub_indexes.index.values)
vstoxx = vstoxx[vstoxx.index >= start_dt]

from pylab import *
new_pd = pd.DataFrame(vstoxx_sub_indexes["I2"])
new_pd = new_pd.join(vstoxx["V6I2"], how='inner')
new_pd.plot(figsize=(10, 6), grid=True)
Let's compare these values of the 2 months to expiry option values to see how well our model performs:
>>> show()
Populating the interactive namespace from numpy and matplotlib
<matplotlib.axes.AxesSubplot at 0x10f090c10>
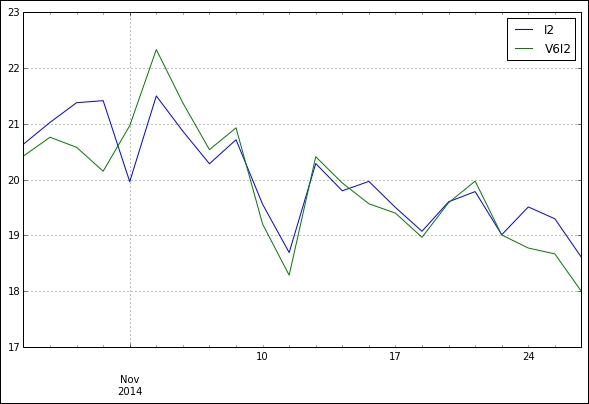
We can see that the calculated values tend to move in the same direction as the actual V6I2 values.