
The heart of a water flow sensor consists of a Hall effect sensor (https://en.wikipedia.org/wiki/Hall_effect_sensor) that outputs pulses for magnetic field changes. Inside the housing, there is a small pinwheel with a permanent magnet attached to it. When the water flows through the housing, the pinwheel begins to spin, and the magnet attached to it passes very close to the Hall effect sensor in every cycle. The Hall effect sensor is covered with a separate plastic housing to protect it from the water. The result generates an electric pulse that transitions from low voltage to high voltage, or high voltage to low voltage, depending on the attached permanent magnet's polarity. The resulting pulse can be read and counted using the Arduino.
For this project, we will use a Liquid Flow sensor from Futurlec (http://www.futurlec.com/FLOW25L0.shtml). The following image shows the external view of a Liquid Flow Sensor:

Liquid flow sensor – the flow direction is marked with an arrow
The following image shows the inside view of the liquid flow sensor. You can see a pinwheel that is located inside the housing.
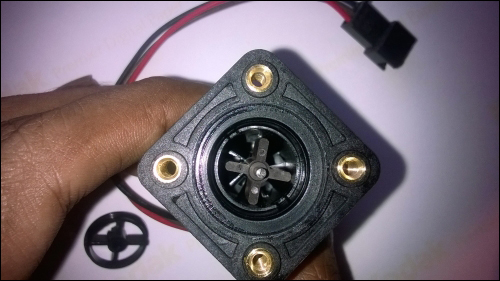
Pinwheel attached inside the water flow sensor
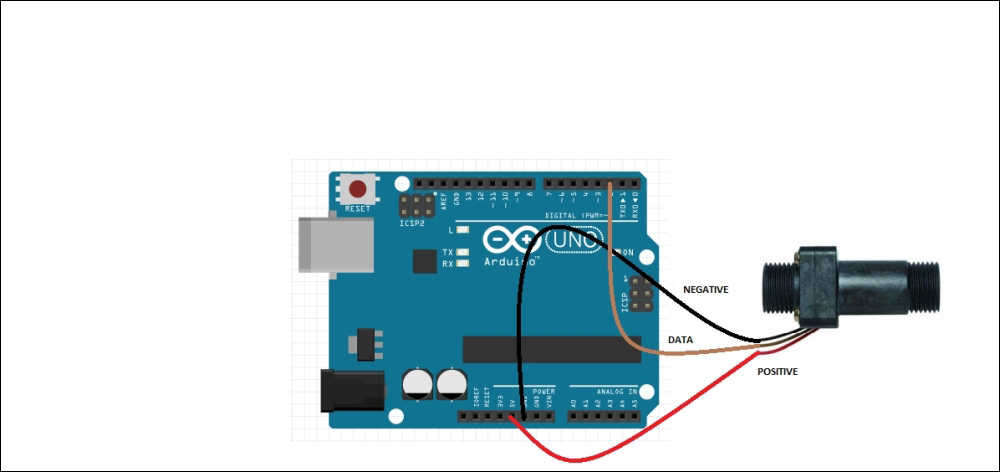
The water flow sensor that we are using with this project has three wires, which are the following:
- Red (or it may be a different color) wire, which indicates the Positive terminal
- Black (or it may be a different color) wire, which indicates the Negative terminal
- Brown (or it may be a different color) wire, which indicates the DATA terminal
All three wire ends are connected to a JST connector. Always refer to the datasheet of the product for wiring specifications before connecting them with the microcontroller and the power source.
When you use jumper wires with male and female headers, do the following:
- Connect positive terminal of the water flow sensor to Arduino 5V.
- Connect negative terminal of the water flow sensor to Arduino GND.
- Connect DATA terminal of the water flow sensor to Arduino digital pin 2.
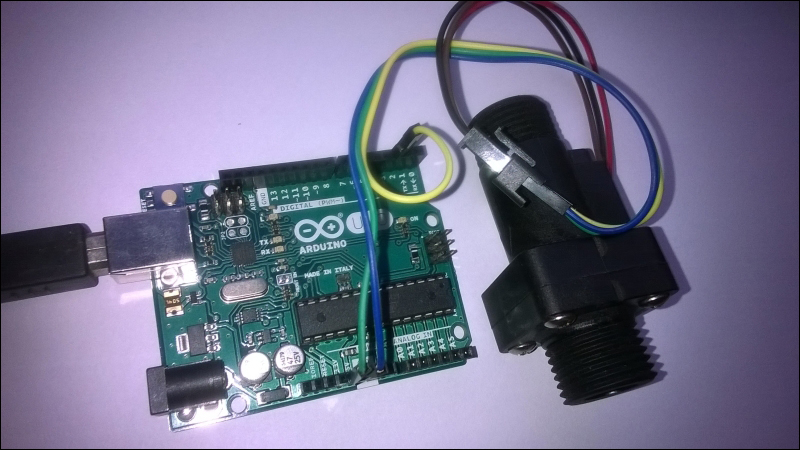
Water flow sensor connected with Arduino Ethernet Shield using three wires
You can directly power the water flow sensor using Arduino since most residential type water flow sensors operate under 5V and consume a very low amount of current. Read the product manual for more information about the supply voltage and supply current range to save your Arduino from high current consumption by the water flow sensor. If your water flow sensor requires a supply current of more than 200mA or a supply voltage of more than 5v to function correctly, then use a separate power source with it.
The following image illustrates jumper wires with male and female headers:
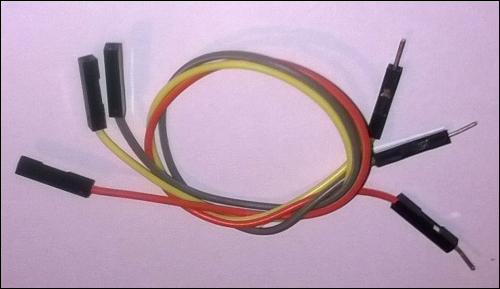
Jumper wires with male and female headers
The water flow sensor produces and outputs digital pulses that denote the amount of water flowing through it. These pulses can be detected and counted using the Arduino board.
Let's assume the water flow sensor that we are using for this project will generate approximately 450 pulses per liter (most probably, this value can be found in the product datasheet). So 1 pulse approximately equals to [1000 ml/450 pulses] 2.22 ml. These values can be different depending on the speed of the water flow and the mounting polarity of the water flow sensor.
Arduino can read digital pulses generating by the water flow sensor through the DATA line.
There are two type of pulses, as listed here:
- Positive-going pulse: In an idle state, the logic level is normally LOW. It goes HIGH state, stays there for some time, and comes back to the LOW state.
- Negative-going pulse: In an idle state, the logic level is normally HIGH. It goes LOW state, stays LOW state for time, and comes back to the HIGH state.
The rising and falling edges of a pulse are vertical. The transition from LOW state to HIGH state is called rising edge and the transition from HIGH state to LOW state is called falling edge.
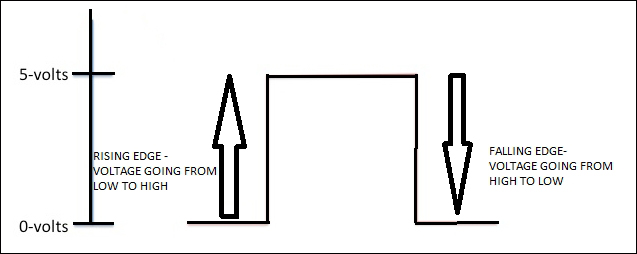
Representation of Rising edge and Falling edge in digital signal
You can capture digital pulses using either the rising edge or the falling edge. In this project, we will use the rising edge.
In the previous step, you attached the water flow sensor to Arduino UNO. The generated pulse can be read by Arduino digital pin 2 and the interrupt 0 is attached to it.
The following Arduino sketch will count the number of pulses per second and display it on the Arduino Serial Monitor:
- Open a new Arduino IDE and copy the sketch named
B04844_03_01.inofrom theChapter 3sample code folder. - Change the following pin number assignment if you have attached your water flow sensor to a different Arduino pin:
int pin = 2;
- Verify and upload the sketch on the Arduino board:
int pin = 2; //Water flow sensor attached to digital pin 2 volatile unsigned int pulse; const int pulses_per_litre = 450; void setup() { Serial.begin(9600); pinMode(pin, INPUT); attachInterrupt(0, count_pulse, RISING); } void loop() { pulse = 0; interrupts(); delay(1000); noInterrupts(); Serial.print("Pulses per second: "); Serial.println(pulse); } void count_pulse() { pulse++; } - Open the Arduino Serial Monitor and blow air through the water flow sensor using your mouth.
- The number of pulses per second will print on the Arduino Serial Monitor for each loop, as shown in the following screenshot:
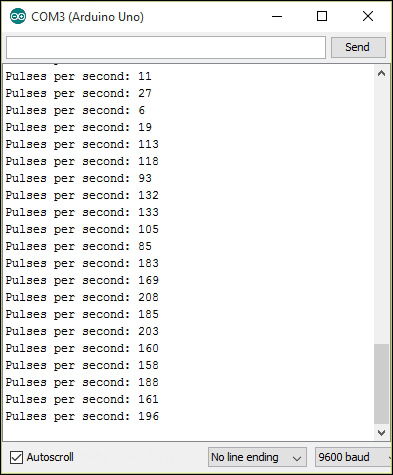
Pulses per second in each loop
The attachInterrupt() function is responsible for handling the count_pulse() function. When the interrupts() function is called, the count_pulse() function will start to collect the pulses generated by the liquid flow sensor. This will continue for 1000 milliseconds, and then the noInterrupts() function is called to stop the operation of count_pulse() function. Then, the pulse count is assigned to the pulse variable and prints it on the serial monitor. This will repeat again and again inside the loop() function until you press the reset button or disconnect the Arduino from the power.
The water flow rate is the amount of water flowing in at a given point of time and can be expressed in gallons per second or liters per second. The number of pulses generated per liter of water flowing through the sensor can be found in the water flow sensor's specification sheet. Let's say there are m pulses per liter of water.
You can also count the number of pulses generated by the sensor per second: Let's say there are n pulses per second.
The water flow rate R can be expressed as:
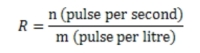
In liters per second
Also, you can calculate the water flow rate in liters per minute using the following formula:
For example, if your water flow sensor generates 450 pulses for one liter of water flowing through it, and you get 10 pulses for the first second, then the elapsed water flow rate is:
10/450 = 0.022 liters per second or 0.022 * 1000 = 22 milliliters per second.
The following steps will explain you how to calculate the water flow rate using a simple Arduino sketch:
- Open a new Arduino IDE and copy the sketch named
B04844_03_02.inofrom theChapter 3sample code folder. - Verify and upload the sketch on the Arduino board.
- The following code block will calculate the water flow rate in milliliters per second:
Serial.print("Water flow rate: "); Serial.print(pulse * 1000/pulses_per_litre); Serial.println("milliliters per second"); - Open the Arduino Serial Monitor and blow air through the water flow sensor using your mouth.
- The number of pulses per second and the water flow rate in milliliters per second will print on the Arduino Serial Monitor for each loop, as shown in the following screenshot:

Pulses per second and water flow rate in each loop
The water flow volume can be calculated by summing up the product of flow rate and the time interval:
Volume = ∑ Flow Rate * Time_Interval
The following Arduino sketch will calculate and output the total water volume since the device startup:
- Open a new Arduino IDE and copy the sketch named
B04844_03_03.inofrom theChapter 3sample code folder. - The water flow volume can be calculated using following code block:
volume = volume + flow_rate * 0.1; //Time Interval is 0.1 second Serial.print("Volume: "); Serial.print(volume); Serial.println(" milliliters"); - Verify and upload the sketch on the Arduino board.
- Open the Arduino Serial Monitor and blow air through the water flow sensor using your mouth.
- The number of pulses per second, water flow rate in milliliters per second, and total volume of water in milliliters will be printed on the Arduino Serial Monitor for each loop, as shown in the following screenshot:
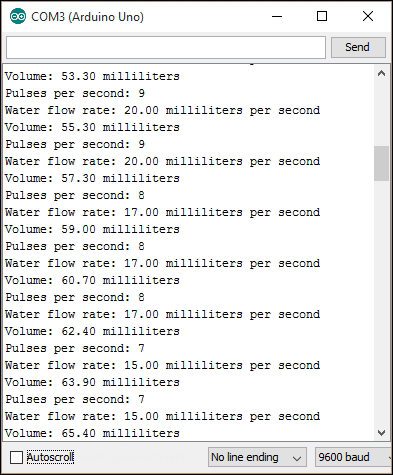
Pulses per second, water flow rate and in each loop and sum of volume
Note
To accurately measure water flow rate and volume, the water flow sensor needs to be carefully calibrated. The hall effect sensor inside the housing is not a precision sensor, and the pulse rate does vary a bit depending on the flow rate, fluid pressure, and sensor orientation. This topic is beyond the scope of this book.