
Use the following chart to find the time zone for your device. The following two examples will show you how to find the correct time zone value:
- Example 1: Let's assume your device is located in Sri Jayawardenepura, the time zone is 5.5, that is, UTC +05:30 (Chennai, Kolkata, Mumbai, New Delhi, Sri Jayawardenepura)
- Example 2: If it is located in Newfoundland, the time zone is -3.5, that is, UTC -03:30 Newfoundland
Now, we will look at how to display the temperature data on a web page using HTML and JavaScript by connecting to the Xively cloud.
- Copy the following
index.htmlfile from the code folder ofChapter 5to your computer's hard drive. - Using a text editor (Notepad or Notepad++), open the file and edit the highlighted code snippets using your NearBus and Xively device configuration values. Modify the device ID, user, and password:
var device_id = "NB101706"; // Your device ID
var user = "****"; // Your NearBus Web user
var pass = "****"; // Your NearBus Web password
Following are the variables:
device_id: Your NearBus device IDuser: Your NearBus user namepass: Your NearBus password
- Replace
1with your NearBus channel ID:ret = NearAPIjs( "ADC_INPUT", device_id , 1, 0, "RONLY" ); - Replace
1910481586with your Xively device Feed ID,1.pngwith your NearBus channel ID (only replace the number part) and5.5with your time zone.<div id="div_temp_chart_cm"> <img src="https://api.cosm.com/v2/feeds/1910481586/datastreams/1.png?width=750&height=400&colour=%23f15a24&duration=3hours&show_axis_labels=true&detailed_grid=true&timezone=5.5" > </div>
You can also modify the cosm to Xively in the preceding URL because both are working. The modified URL can be written as follows:
<div id="div_temp_chart_cm"> <img src="https://api.xively.com/v2/feeds/1910481586/datastreams/1.png?width=750&height=400&colour=%23f15a24&duration=3hours&show_axis_labels=true&detailed_grid=true&timezone=5.5" > </div>
- Now, save and close the file. Then, open the file using your preferred web browser. You will see a graph displaying the real-time voltage values against the time which is continuously updating.
- Also, you can copy the file into your smart phone's SD card or its internal memory, and then open it with the mobile web browser to see the real time graph.
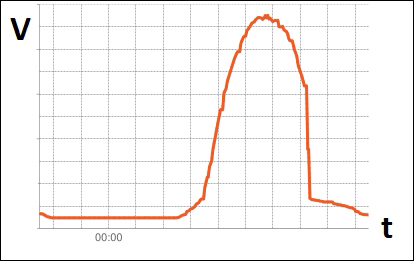
- The following image shows a real time graph that is plotting the output voltage of a solar cell, where the x axis represents the time (t) and the y axis represents the voltage (V):
..................Content has been hidden....................
You can't read the all page of ebook, please click here login for view all page.