 Spring Boot actuators
by Ravi Kant Soni, Rajesh RV, Amuthan Ganeshan
Spring: Developing Java Applications for the Enterprise
Spring Boot actuators
by Ravi Kant Soni, Rajesh RV, Amuthan Ganeshan
Spring: Developing Java Applications for the Enterprise
- Spring: Developing Java Applications for the Enterprise
- Table of Contents
- Spring: Developing Java Applications for the Enterprise
- Spring: Developing Java Applications for the Enterprise
- Credits
- Preface
- 1. Module 1
- 1. Introducing the Spring Framework
- 2. Inversion of Control in Spring
- Understanding Inversion of Control
- Dependency Injection
- Bean definition inheritance
- Autowiring in Spring
- The bean's scope
- The Spring bean life cycle
- Exercise
- Summary
- 3. DAO and JDBC in Spring
- Overview of database
- The DAO design pattern
- JDBC without Spring
- Spring JDBC packages
- JDBC with Spring
- What is JdbcTemplate
- JDBC batch operation in Spring
- Calling a stored procedure
- Exercise
- Summary
- 4. Hibernate with Spring
- Why Object/Relational Mapping?
- Introducing ORM, O/RM, and O/R mapping
- Introducing Hibernate
- Integrating Hibernate with the Spring Framework
- Sample data model for example code
- Integrating Hibernate
- Required JARs for the Spring-Hibernate project
- Configuring Hibernate SessionFactory in Spring
- Annotated domain model class
- The Hibernate sessions
- Persistence layer – implement DAOs
- Service layer – implement services
- Directory structure of the application
- Running the application
- Hibernate Query Language
- Hibernate Criteria Query Language
- Exercise
- Summary
- 5. Spring Security
- 6. Spring Testing
- 7. Integrating JavaMail and JMS with Spring
- E-mail support in Spring
- Spring Java Messaging Service
- Exercise
- Summary
- A. Solutions to Exercises
- B. Setting up the Application Database – Apache Derby
- 2. Module 2
- 1. Configuring a Spring Development Environment
- 2. Spring MVC Architecture – Architecting Your Web Store
- Dispatcher servlet
- Understanding the Dispatcher servlet configuration
- Servlet mapping versus request mapping
- Web application context
- View resolvers
- Understanding the web application context configuration
- Model View Controller
- Overview of the Spring MVC request flow
- The web application architecture
- The Domain layer
- The Persistence layer
- The Service layer
- An overview of the web application architecture
- Summary
- 3. Control Your Store with Controllers
- 4. Working with Spring Tag Libraries
- 5. Working with View Resolver
- 6. Internalize Your Store with Interceptor
- 7. Incorporating Spring Security
- 8. Validate Your Products with a Validator
- 9. Give REST to Your Application with Ajax
- 10. Float Your Application with Web Flow
- 11. Template with Tiles
- 12. Testing Your Application
- A. Using the Gradle Build Tool
- B. Pop Quiz Answers
- Chapter 2, Spring MVC Architecture - Architecting Your Web Store
- Chapter 3, Control Your Store with Controllers
- Chapter 4, Working with Spring Tag Libraries
- Chapter 5, Working with View Resolver
- Chapter 6, Internalize Your Store with Interceptor
- Chapter 7, Incorporating Spring Security
- Chapter 10, Float Your Application with Web Flow
- Chapter 11, Template with Tiles
- 3. Module 3
- 1. Demystifying Microservices
- The evolution of microservices
- What are microservices?
- Microservices – the honeycomb analogy
- Principles of microservices
- Characteristics of microservices
- Microservices examples
- Microservices benefits
- Supports polyglot architecture
- Enabling experimentation and innovation
- Elastically and selectively scalable
- Allowing substitution
- Enabling to build organic systems
- Helping reducing technology debt
- Allowing the coexistence of different versions
- Supporting the building of self-organizing systems
- Supporting event-driven architecture
- Enabling DevOps
- Relationship with other architecture styles
- Relations with SOA
- Relations with Twelve-Factor apps
- A single code base
- Bundling dependencies
- Externalizing configurations
- Backing services are addressable
- Isolation between build, release, and run
- Stateless, shared nothing processes
- Exposing services through port bindings
- Concurrency to scale out
- Disposability with minimal overhead
- Development and production parity
- Externalizing logs
- Package admin processes
- Microservice use cases
- Summary
- 2. Building Microservices with Spring Boot
- Setting up a development environment
- Developing a RESTful service – the legacy approach
- Moving from traditional web applications to microservices
- Using Spring Boot to build RESTful microservices
- Getting started with Spring Boot
- Developing the Spring Boot microservice using the CLI
- Developing the Spring Boot Java microservice using STS
- Developing the Spring Boot microservice using Spring Initializr – the HATEOAS example
- What's next?
- The Spring Boot configuration
- Changing the default embedded web server
- Implementing Spring Boot security
- Enabling cross-origin access for microservices
- Implementing Spring Boot messaging
- Developing a comprehensive microservice example
- Spring Boot actuators
- Configuring application information
- Adding a custom health module
- Documenting microservices
- Summary
- 3. Applying Microservices Concepts
- Patterns and common design decisions
- Establishing appropriate microservice boundaries
- Designing communication styles
- Orchestration of microservices
- How many endpoints in a microservice?
- One microservice per VM or multiple?
- Rules engine – shared or embedded?
- Role of BPM and workflows
- Can microservices share data stores?
- Setting up transaction boundaries
- Service endpoint design consideration
- Handling shared libraries
- User interfaces in microservices
- Use of API gateways in microservices
- Use of ESB and iPaaS with microservices
- Service versioning considerations
- Design for cross origin
- Handling shared reference data
- Microservices and bulk operations
- Microservices challenges
- The microservices capability model
- Summary
- Patterns and common design decisions
- 4. Microservices Evolution – A Case Study
- Reviewing the microservices capability model
- Understanding the PSS application
- Death of the monolith
- Microservices to the rescue
- The business case
- Plan the evolution
- Migrate modules only if required
- Target architecture
- Target implementation view
- Summary
- 5. Scaling Microservices with Spring Cloud
- Reviewing microservices capabilities
- Reviewing BrownField's PSS implementation
- What is Spring Cloud?
- Setting up the environment for BrownField PSS
- Spring Cloud Config
- What's next?
- Setting up the Config server
- Understanding the Config server URL
- Handling configuration changes
- Spring Cloud Bus for propagating configuration changes
- Setting up high availability for the Config server
- Monitoring the Config server health
- Config server for configuration files
- Completing changes to use the Config server
- Feign as a declarative REST client
- Ribbon for load balancing
- Eureka for registration and discovery
- Zuul proxy as the API gateway
- Streams for reactive microservices
- Summarizing the BrownField PSS architecture
- Summary
- 6. Autoscaling Microservices
- 7. Logging and Monitoring Microservices
- 8. Containerizing Microservices with Docker
- Reviewing the microservice capability model
- Understanding the gaps in BrownField PSS microservices
- What are containers?
- The difference between VMs and containers
- The benefits of containers
- Microservices and containers
- Introduction to Docker
- Deploying microservices in Docker
- Running RabbitMQ on Docker
- Using the Docker registry
- Microservices on the cloud
- Running BrownField services on EC2
- Updating the life cycle manager
- The future of containerization – unikernels and hardened security
- Summary
- 9. Managing Dockerized Microservices with Mesos and Marathon
- Reviewing the microservice capability model
- The missing pieces
- Why cluster management is important
- What does cluster management do?
- Relationship with microservices
- Relationship with virtualization
- Cluster management solutions
- Cluster management with Mesos and Marathon
- Implementing Mesos and Marathon for BrownField microservices
- A place for the life cycle manager
- The technology metamodel
- Summary
- 10. The Microservices Development Life Cycle
- Reviewing the microservice capability model
- The new mantra of lean IT – DevOps
- Meeting the trio – microservices, DevOps, and cloud
- Practice points for microservices development
- Understanding business motivation and value
- Changing the mindset from project to product development
- Choosing a development philosophy
- Using the concept of Minimum Viable Product
- Overcoming the legacy hotspot
- Addressing challenges around databases
- Establishing self-organizing teams
- Building a self-service cloud
- Building a microservices ecosystem
- Defining a DevOps-style microservice life cycle process
- Automating the continuous delivery pipeline
- Development
- Continuous integration
- Automated testing
- Different candidate tests for automation
- Automated sanity tests
- Regression testing
- Automated functional testing
- Automated acceptance testing
- Performance testing
- Real user flow simulation or journey testing
- Automated security testing
- Exploratory testing
- A/B testing, canary testing, and blue-green deployments
- Other nonfunctional tests
- Testing in production
- Antifragility testing
- Target test environments
- Different candidate tests for automation
- Continuous deployment
- Monitoring and feedback
- Automated configuration management
- Microservices development governance, reference architectures, and libraries
- Summary
- 1. Demystifying Microservices
- Bibliography
- Index
The previous sections explored most of the Spring Boot features required to develop a microservice. In this section, some of the production-ready operational aspects of Spring Boot will be explored.
Spring Boot actuators provide an excellent out-of-the-box mechanism to monitor and manage Spring Boot applications in production:
- Create another Spring Starter Project and name it
chapter2.bootactuator. This time, select Web and Actuators under Ops. Similar to thechapter2.bootrestproject, add aGreeterControllerendpoint with thegreetmethod. - Start the application as Spring Boot app.
- Point the browser to
localhost:8080/actuator. This will open the HAL browser. Then, review the Links section.A number of links are available under the Links section. These are automatically exposed by the Spring Boot actuator:
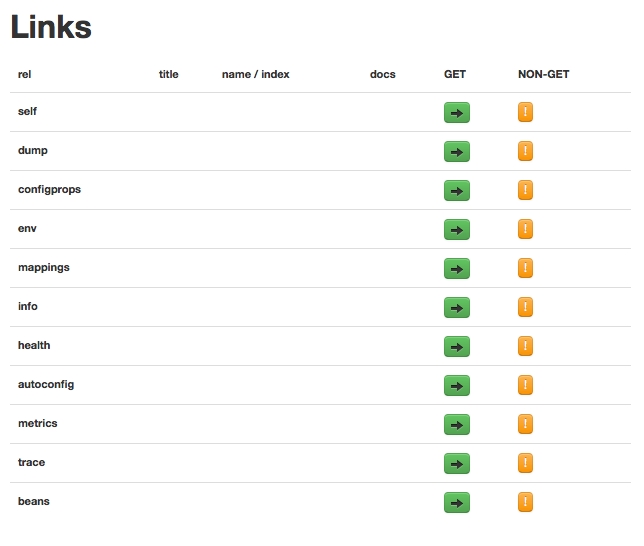
Some of the important links are listed as follows:
dump: This performs a thread dump and displays the resultmappings: This lists all the HTTP request mappingsinfo: This displays information about the applicationhealth: This displays the application's health conditionsautoconfig: This displays the autoconfiguration reportmetrics: This shows different metrics collected from the application
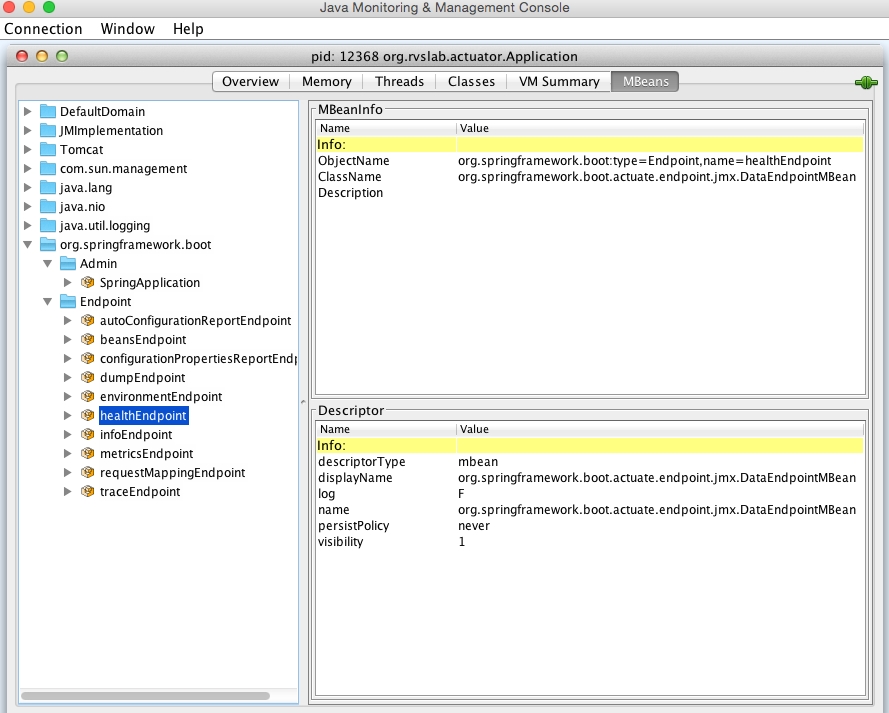
Alternately, we can use the JMX console to see the Spring Boot information. Connect to the remote Spring Boot instance from JConsole. The Boot information will be shown as follows:
Spring Boot provides remote access to the Boot application using SSH. The following command connects to the Spring Boot application from a terminal window:
$ ssh -p 2000 user@localhost
The password can be customized by adding the shell.auth.simple.user.password property in the application.properties file. The updated application.properties file will look similar to the following:
shell.auth.simple.user.password=admin
When connected with the preceding command, similar actuator information can be accessed. Here is an example of the metrics information accessed through the CLI:
help: This lists out all the options availabledashboard: This is one interesting feature that shows a lot of system-level information
-
No Comment