In this section, we will examine how to enhance microservices developed in Chapter 5, Scaling Microservices with Spring Cloud, for autoscaling. We need a component to monitor certain performance metrics and trigger autoscaling. We will call this component the life cycle manager.
The service life cycle manager, or the application life cycle manager, is responsible for detecting scaling requirements and adjusting the number of instances accordingly. It is responsible for starting and shutting down instances dynamically.
In this section, we will take a look at a primitive autoscaling system to understand the basic concepts, which will be enhanced in later chapters.
A typical autoscaling system has capabilities as shown in the following diagram:
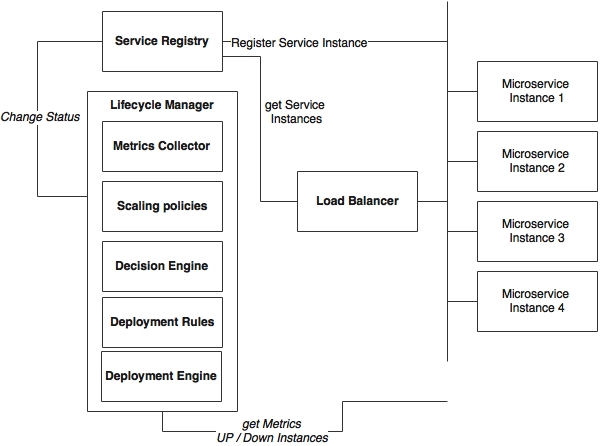
The components involved in the autoscaling ecosystem in the context of microservices are explained as follows:
- Microservices: These are sets of the up-and-running microservice instances that keep sending health and metrics information. Alternately, these services expose actuator endpoints for metrics collection. In the preceding diagram, these are represented as Microservice 1 through Microservice 4.
- Service Registry: A service registry keeps track of all the services, their health states, their metadata, and their endpoint URI.
- Load Balancer: This is a client-side load balancer that looks up the service registry to get up-to-date information about the available service instances.
- Lifecycle Manager: The life cycle manger is responsible for autoscaling, which has the following subcomponents:
- Metrics Collector: A metrics collection unit is responsible for collecting metrics from all service instances. The life cycle manager will aggregate the metrics. It may also keep a sliding time window. The metrics could be infrastructure-level metrics, such as CPU usage, or application-level metrics, such as transactions per minute.
- Scaling policies: Scaling policies are nothing but sets of rules indicating when to scale up and scale down microservices—for example, 90% of CPU usage above 60% in a sliding window of 5 minutes.
- Decision Engine: A decision engine is responsible for making decisions to scale up and scale down based on the aggregated metrics and scaling policies.
- Deployment Rules: The deployment engine uses deployment rules to decide which parameters to consider when deploying services. For example, a service deployment constraint may say that the instance must be distributed across multiple availability regions or a 4 GB minimum of memory required for the service.
- Deployment Engine: The deployment engine, based on the decisions of the decision engine, can start or stop microservice instances or update the registry by altering the health states of services. For example, it sets the health status as "out of service" to take out a service temporarily.
The life cycle manager introduced in this section is a minimal implementation to understand autoscaling capabilities. In later chapters, we will enhance this implementation with containers and cluster management solutions. Ansible, Marathon, and Kubernetes are some of the tools useful in building this capability.
In this section, we will implement an application-level autoscaling component using Spring Boot for the services developed in Chapter 5, Scaling Microservices with Spring Cloud.
The following diagram shows a sample deployment topology of BrownField PSS microservices:
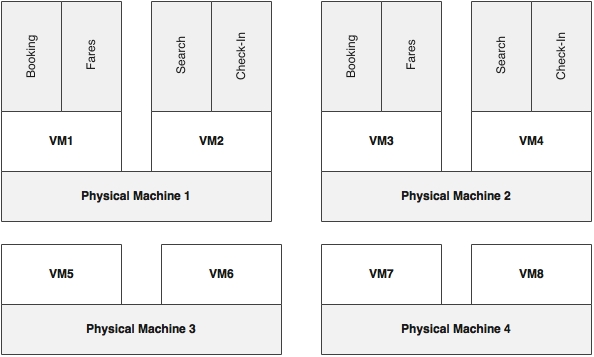
As shown in the diagram, there are four physical machines. Eight VMs are created from four physical machines. Each physical machine is capable of hosting two VMs, and each VM is capable of running two Spring Boot instances, assuming that all services have the same resource requirements.
Four VMs, VM1 through VM4, are active and are used to handle traffic. VM5 to VM8 are kept as reserve VMs to handle scalability. VM5 and VM6 can be used for any of the microservices and can also be switched between microservices based on scaling demands. Redundant services use VMs created from different physical machines to improve fault tolerance.
Our objective is to scale out any services when there is increase in traffic flow using four VMs, VM5 through VM8, and scale down when there is not enough load. The architecture of our solution is as follows.
Have a look at the following flowchart:
As shown in the preceding diagram, the following activities are important for us:
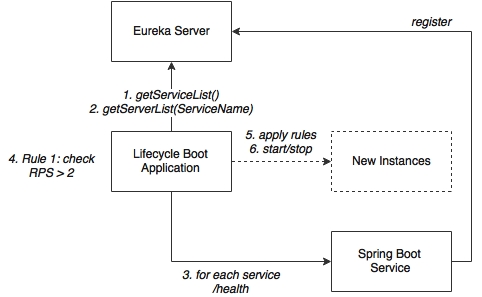
- The Spring Boot service represents microservices such as Search, Book, Fares, and Check-in. Services at startup automatically register endpoint details to the Eureka registry. These services are actuator-enabled, so the life cycle manager can collect metrics from the actuator endpoints.
- The life cycle manager service is nothing but another Spring Boot application. The life cycle manager has a metrics collector that runs a background job, periodically polls the Eureka server, and gets details of all the service instances. The metrics collector then invokes the actuator endpoints of each microservice registered in the Eureka registry to get the health and metrics information. In a real production scenario, a subscription approach for data collection is better.
- With the collected metrics information, the life cycle manager executes a list of policies and derives decisions on whether to scale up or scale down instances. These decisions are either to start a new service instance of a particular type on a particular VM or to shut down a particular instance.
- In the case of shutdown, it connects to the server using an actuator endpoint and calls the shutdown service to gracefully shut down an instance.
- In the case of starting a new instance, the deployment engine of the life cycle manager uses the scaling rules and decides where to start the new instance and what parameters are to be used when starting the instance. Then, it connects to the respective VMs using SSH. Once connected, it executes a preinstalled script (or passes this script as a part of the execution) by passing the required constraints as a parameter. This script fetches the application library from a central Nexus repository in which the production binaries are kept and initiates it as a Spring Boot application. The port number is parameterized by the life cycle manager. SSH needs to be enabled on the target machines.
In this example, we will use TPM (Transactions Per Minute) or RPM (Requests Per Minute) as sampler metrics for decision making. If the Search service has more than 10 TPM, then it will spin up a new Search service instance. Similarly, if the TPM is below 2, one of the instances will be shut down and released back to the pool.
When starting a new instance, the following policies will be applied:
- The number of service instances at any point should be a minimum of 1 and a maximum of 4. This also means that at least one service instance will always be up and running.
- A scaling group is defined in such a way that a new instance is created on a VM that is on a different physical machine. This will ensure that the services run across different physical machines.
These policies could be further enhanced. The life cycle manager ideally provides options to customize these rules through REST APIs or Groovy scripts.
We will take a look at how a simple life cycle manager is implemented. This section will be a walkthrough of the code to understand the different components of the life cycle manager.
Perform the following steps to implement the custom life cycle manager:
- Create a new Spring Boot application and name it
chapter6.lifecyclemanager. The project structure is shown in the following diagram: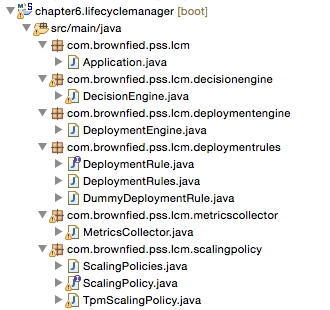
The flowchart for this example is as shown in the following diagram:
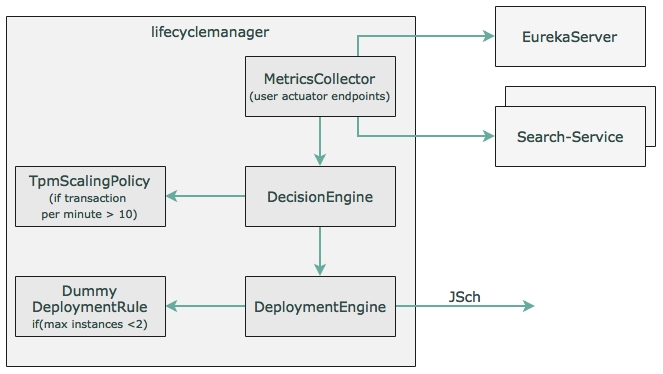
The components of this diagram are explained in details here.
- Create a
MetricsCollectorclass with the following method. At the startup of the Spring Boot application, this method will be invoked usingCommandLineRunner, as follows:public void start(){ while(true){ eurekaClient.getServices().forEach(service -> { System.out.println("discovered service "+ service); Map metrics = restTemplate.getForObject("http://"+service+"/metrics",Map.class); decisionEngine.execute(service, metrics); }); } }The preceding method looks for the services registered in the Eureka server and gets all the instances. In the real world, rather than polling, the instances should publish metrics to a common place, where metrics aggregation will happen.
- The following
DecisionEnginecode accepts the metric and applies certain scaling policies to determine whether the service requires scaling up or not:public boolean execute(String serviceId, Map metrics){ if(scalingPolicies.getPolicy(serviceId).execute(serviceId, metrics)){ return deploymentEngine.scaleUp(deploymentRules.getDeploymentRules(serviceId), serviceId); } return false; } - Based on the service ID, the policies that are related to the services will be picked up and applied. In this case, a minimal TPM scaling policy is implemented in
TpmScalingPolicy, as follows:public class TpmScalingPolicy implements ScalingPolicy { public boolean execute(String serviceId, Map metrics){ if(metrics.containsKey("gauge.servo.tpm")){ Double tpm = (Double) metrics.get("gauge.servo.tpm"); System.out.println("gauge.servo.tpm " + tpm); return (tpm > 10); } return false; } } - If the policy returns
true,DecisionEnginethen invokesDeploymentEngineto spin up another instance.DeploymentEnginemakes use ofDeploymentRulesto decide how to execute scaling. The rules can enforce the number of min and max instances, in which region or machine the new instance has to be started, the resources required for the new instance, and so on.DummyDeploymentRulesimply makes sure the max instance is not more than 2. DeploymentEngine, in this case, uses the JSch (Java Secure Channel) library from JCraft to SSH to the destination server and start the service. This requires the following additional Maven dependency:<dependency> <groupId>com.jcraft</groupId> <artifactId>jsch</artifactId> <version>0.1.53</version> </dependency>- The current SSH implementation is kept simple enough as we will change this in future chapters. In this example,
DeploymentEnginesends the following command over the SSH library on the target machine:String command ="java -jar -Dserver.port=8091 ./work/codebox/chapter6/chapter6.search/target/search-1.0.jar";Integration with Nexus happens from the target machine using Linux scripts with Nexus CLI or using
curl. In this example, we will not explore Nexus. - The next step is to change the Search microservice to expose a new gauge for TPM. We have to change all the microservices developed earlier to submit this additional metric.
We will only examine Search in this chapter, but in order to complete it, all the services have to be updated. In order to get the
gauge.servo.tpmmetrics, we have to addTPMCounterto all the microservices.The following code counts the transactions over a sliding window of 1 minute:
class TPMCounter { LongAdder count; Calendar expiry = null; TPMCounter(){ reset(); } void reset (){ count = new LongAdder(); expiry = Calendar.getInstance(); expiry.add(Calendar.MINUTE, 1); } boolean isExpired(){ return Calendar.getInstance().after(expiry); } void increment(){ if(isExpired()){ reset(); } count.increment(); } } - The following code needs to be added to
SearchControllerto set thetpmvalue:class SearchRestController { TPMCounter tpm = new TPMCounter(); @Autowired GaugeService gaugeService; //other code - The following code is from the get REST endpoint (the search method) of
SearchRestController, which submits thetpmvalue as a gauge to the actuator endpoint:tpm.increment(); gaugeService.submit("tpm", tpm.count.intValue());
Perform the following steps to run the life cycle manager developed in the previous section:
- Edit
DeploymentEngine.javaand update the password to reflect the machine's password, as follows. This is required for the SSH connection:session.setPassword("rajeshrv"); - Build all the projects by running Maven from the root folder (
Chapter 6) via the following command:mvn -Dmaven.test.skip=true clean install - Then, run RabbitMQ, as follows:
./rabbitmq-server - Ensure that the Config server is pointing to the right configuration repository. We need to add a property file for the life cycle manager.
- Run the following commands from the respective project folders:
java -jar target/config-server-0.0.1-SNAPSHOT.jar
java -jar target/eureka-server-0.0.1-SNAPSHOT.jar
java -jar target/lifecycle-manager-0.0.1-SNAPSHOT.jar
java -jar target/search-1.0.jar
java -jar target/search-apigateway-1.0.jar
java -jar target/website-1.0.jar
- Once all the services are started, open a browser window and load
http://localhost:8001. - Execute the flight search 11 times, one after the other, within a minute. This will trigger the decision engine to instantiate another instance of the Search microservice.
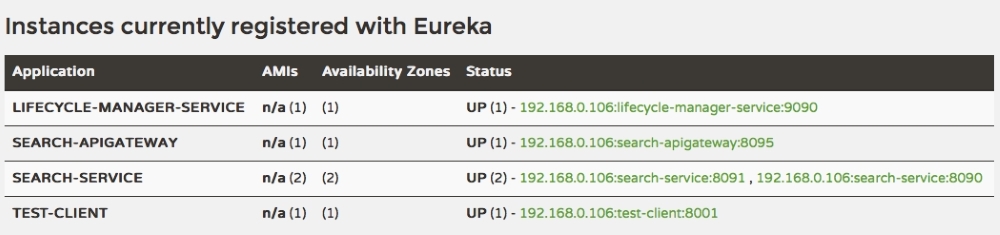
- Open the Eureka console (
http://localhost:8761) and watch for a second SEARCH-SERVICE. Once the server is started, the instances will appear as shown here: