
Microservices are truly distributed systems with a fluid deployment topology. Without sophisticated monitoring in place, operations teams may run into trouble managing large-scale microservices. Traditional monolithic application deployments are limited to a number of known services, instances, machines, and so on. This is easier to manage compared to the large number of microservices instances potentially running across different machines. To add more complication, these services dynamically change their topologies. A centralized logging capability only addresses part of the issue. It is important for operations teams to understand the runtime deployment topology and also the behavior of the systems. This demands more than a centralized logging can offer.
In general application, monitoring is more a collection of metrics, aggregation, and their validation against certain baseline values. If there is a service-level breach, then monitoring tools generate alerts and send them to administrators. With hundreds and thousands of interconnected microservices, traditional monitoring does not really offer true value. The one-size-fits-all approach to monitoring or monitoring everything with a single pane of glass is not easy to achieve in large-scale microservices.
One of the main objectives of microservice monitoring is to understand the behavior of the system from a user experience point of view. This will ensure that the end-to-end behavior is consistent and is in line with what is expected by the users.
Similar to the fragmented logging issue, the key challenge in monitoring microservices is that there are many moving parts in a microservice ecosystem.
The typical issues are summarized here:
- The statistics and metrics are fragmented across many services, instances, and machines.
- Heterogeneous technologies may be used to implement microservices, which makes things even more complex. A single monitoring tool may not give all the required monitoring options.
- Microservices deployment topologies are dynamic, making it impossible to preconfigure servers, instances, and monitoring parameters.
Many of the traditional monitoring tools are good to monitor monolithic applications but fall short in monitoring large-scale, distributed, interlinked microservice systems. Many of the traditional monitoring systems are agent-based preinstall agents on the target machines or application instances. This poses two challenges:
- If the agents require deep integration with the services or operating systems, then this will be hard to manage in a dynamic environment
- If these tools impose overheads when monitoring or instrumenting the application, it may lead to performance issues
Many traditional tools need baseline metrics. Such systems work with preset rules, such as if the CPU utilization goes above 60% and remains at this level for 2 minutes, then an alert should be sent to the administrator. It is extremely hard to preconfigure these values in large, Internet-scale deployments.
New-generation monitoring applications learn the application's behavior by themselves and set automatic threshold values. This frees up administrators from doing this mundane task. Automated baselines are sometimes more accurate than human forecasts:
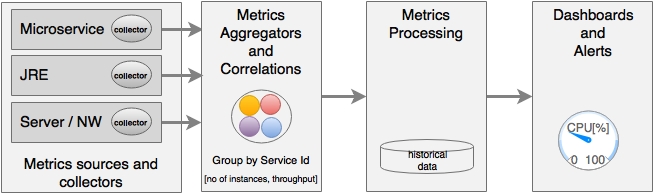
As shown in the diagram, the key areas of microservices monitoring are:
- Metrics sources and data collectors: Metrics collection at the source is done either by the server pushing metrics information to a central collector or by embedding lightweight agents to collect information. Data collectors collect monitoring metrics from different sources, such as network, physical machines, containers, software components, applications, and so on. The challenge is to collect this data using autodiscovery mechanisms instead of static configurations.
This is done by either running agents on the source machines, streaming data from the sources, or polling at regular intervals.
- Aggregation and correlation of metrics: Aggregation capability is required for aggregating metrics collected from different sources, such as user transaction, service, infrastructure, network, and so on. Aggregation can be challenging as it requires some level of understanding of the application's behavior, such as service dependencies, service grouping, and so on. In many cases, these are automatically formulated based on the metadata provided by the sources.
Generally, this is done by an intermediary that accept the metrics.
- Processing metrics and actionable insights: Once data is aggregated, the next step is to do the measurement. Measurements are typically done using set thresholds. In the new-generation monitoring systems, these thresholds are automatically discovered. Monitoring tools then analyze the data and provide actionable insights.
These tools may use big data and stream analytics solutions.
- Alerting, actions, and dashboards: As soon as issues are detected, they have to be notified to the relevant people or systems. Unlike traditional systems, the microservices monitoring systems should be capable of taking actions on a real-time basis. Proactive monitoring is essential to achieving self-healing. Dashboards are used to display SLAs, KPIs, and so on.
Dashboards and alerting tools are capable of handling these requirements.
Microservice monitoring is typically done with three approaches. A combination of these is really required for effective monitoring:
- Application performance monitoring (APM): This is more of a traditional approach to system metrics collection, processing, alerting, and dashboard rendering. These are more from the system's point of view. Application topology discovery and visualization are new capabilities implemented by many of the APM tools. The capabilities vary between different APM providers.
- Synthetic monitoring: This is a technique that is used to monitor the system's behavior using end-to-end transactions with a number of test scenarios in a production or production-like environment. Data is collected to validate the system's behavior and potential hotspots. Synthetic monitoring helps understand the system dependencies as well.
- Real user monitoring (RUM) or user experience monitoring: This is typically a browser-based software that records real user statistics, such as response time, availability, and service levels. With microservices, with more frequent release cycle and dynamic topology, user experience monitoring is more important.
There are many tools available to monitor microservices. There are also overlaps between many of these tools. The selection of monitoring tools really depends upon the ecosystem that needs to be monitored. In most cases, more than one tool is required to monitor the overall microservice ecosystem.
The objective of this section is to familiarize ourselves with a number of common microservices-friendly monitoring tools:
- AppDynamics, Dynatrace, and New Relic are top commercial vendors in the APM space, as per Gartner Magic Quadrant 2015. These tools are microservice friendly and support microservice monitoring effectively in a single console. Ruxit, Datadog, and Dataloop are other commercial offerings that are purpose-built for distributed systems that are essentially microservices friendly. Multiple monitoring tools can feed data to Datadog using plugins.
- Cloud vendors come with their own monitoring tools, but in many cases, these monitoring tools alone may not be sufficient for large-scale microservice monitoring. For instance, AWS uses CloudWatch and Google Cloud Platform uses Cloud Monitoring to collect information from various sources.
- Some of the data collecting libraries, such as Zabbix, statd, collectd, jmxtrans, and so on operate at a lower level in collecting runtime statistics, metrics, gauges, and counters. Typically, this information is fed into data collectors and processors such as Riemann, Datadog, and Librato, or dashboards such as Graphite.
- Spring Boot Actuator is one of the good vehicles to collect microservices metrics, gauges, and counters, as we discussed in Chapter 2, Building Microservices with Spring Boot. Netflix Servo, a metric collector similar to Actuator, and the QBit and Dropwizard metrics also fall in the same category of metric collectors. All these metrics collectors need an aggregator and dashboard to facilitate full-sized monitoring.
- Monitoring through logging is popular but a less effective approach in microservices monitoring. In this approach, as discussed in the previous section, log messages are shipped from various sources, such as microservices, containers, networks, and so on to a central location. Then, we can use the logs files to trace transactions, identify hotspots, and so on. Loggly, ELK, Splunk, and Trace are candidates in this space.
- Sensu is a popular choice for microservice monitoring from the open source community. Weave Scope is another tool, primarily targeting containerized deployments. Spigo is one of the purpose-built microservices monitoring systems closely aligned with the Netflix stack.
- Pingdom, New Relic Synthetics, Runscope, Catchpoint, and so on provide options for synthetic transaction monitoring and user experience monitoring on live systems.
- Circonus is classified more as a DevOps monitoring tool but can also do microservices monitoring. Nagios is a popular open source monitoring tool but falls more into the traditional monitoring system.
- Prometheus provides a time series database and visualization GUI useful in building custom monitoring tools.
When there are a large number of microservices with dependencies, it is important to have a monitoring tool that can show the dependencies among microservices. It is not a scalable approach to statically configure and manage these dependencies. There are many tools that are useful in monitoring microservice dependencies, as follows:
- Mentoring tools such as AppDynamics, Dynatrace, and New Relic can draw dependencies among microservices. End-to-end transaction monitoring can also trace transaction dependencies. Other monitoring tools, such as Spigo, are also useful for microservices dependency management.
- CMDB tools such as Device42 or purpose-built tools such as Accordance are useful in managing the dependency of microservices. Veritas Risk Advisor (VRA) is also useful for infrastructure discovery.
- A custom implementation with a Graph database, such as Neo4j, is also useful. In this case, a microservice has to preconfigure its direct and indirect dependencies. At the startup of the service, it publishes and cross-checks its dependencies with a Neo4j database.
This section will explore Spring Cloud Hystrix as a library for a fault-tolerant and latency-tolerant microservice implementation. Hystrix is based on the fail fast and rapid recovery principles. If there is an issue with a service, Hystrix helps isolate it. It helps to recover quickly by falling back to another preconfigured fallback service. Hystrix is another battle-tested library from Netflix. Hystrix is based on the circuit breaker pattern.
Note
Read more about the circuit breaker pattern at https://msdn.microsoft.com/en-us/library/dn589784.aspx.
In this section, we will build a circuit breaker with Spring Cloud Hystrix. Perform the following steps to change the Search API Gateway service to integrate it with Hystrix:
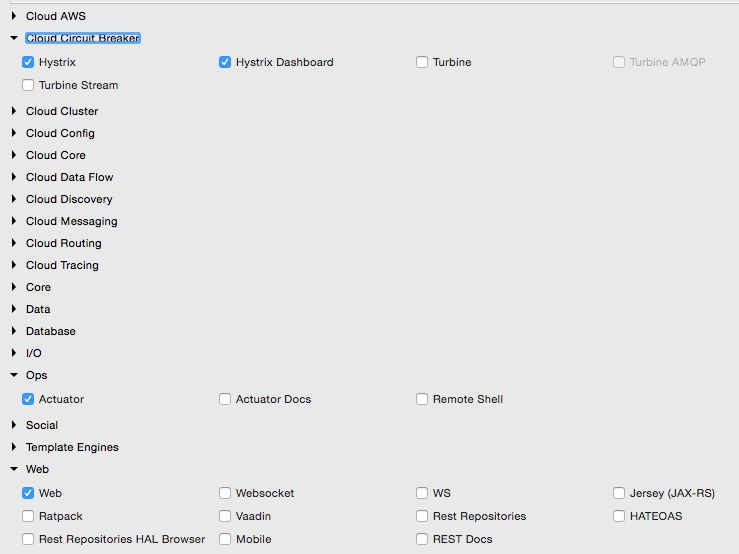
- Update the Search API Gateway service. Add the Hystrix dependency to the service. If developing from scratch, select the following libraries:
- In the Spring Boot Application class, add
@EnableCircuitBreaker. This command will tell Spring Cloud Hystrix to enable a circuit breaker for this application. It also exposes the/hystrix.streamendpoint for metrics collection. - Add a component class to the Search API Gateway service with a method; in this case, this is
getHubannotated with@HystrixCommand. This tells Spring that this method is prone to failure. Spring Cloud libraries wrap these methods to handle fault tolerance and latency tolerance by enabling circuit breaker. The Hystrix command typically follows with a fallback method. In case of failure, Hystrix automatically enables the fallback method mentioned and diverts traffic to the fallback method. As shown in the following code, in this case,getHubwill fall back togetDefaultHub:@Component class SearchAPIGatewayComponent { @LoadBalanced @Autowired RestTemplate restTemplate; @HystrixCommand(fallbackMethod = "getDefaultHub") public String getHub(){ String hub = restTemplate.getForObject("http://search-service/search/hub", String.class); return hub; } public String getDefaultHub(){ return "Possibily SFO"; } } - The
getHubmethod ofSearchAPIGatewayControllercalls thegetHubmethod ofSearchAPIGatewayComponent, as follows:@RequestMapping("/hubongw") String getHub(){ logger.info("Search Request in API gateway for getting Hub, forwarding to search-service "); return component.getHub(); } - The last part of this exercise is to build a Hystrix Dashboard. For this, build another Spring Boot application. Include Hystrix, Hystrix Dashboard, and Actuator when building this application.
- In the Spring Boot Application class, add the
@EnableHystrixDashboardannotation. - Start the Search service, Search API Gateway, and Hystrix Dashboard applications. Point the browser to the Hystrix Dashboard application's URL. In this example, the Hystrix Dashboard is started on port
9999. So, open the URLhttp://localhost:9999/hystrix. - A screen similar to the following screenshot will be displayed. In the Hystrix Dashboard, enter the URL of the service to be monitored.
In this case, Search API Gateway is running on port
8095. Hence, thehystrix.streamURL will behttp://localhost:8095/hytrix.stream, as shown: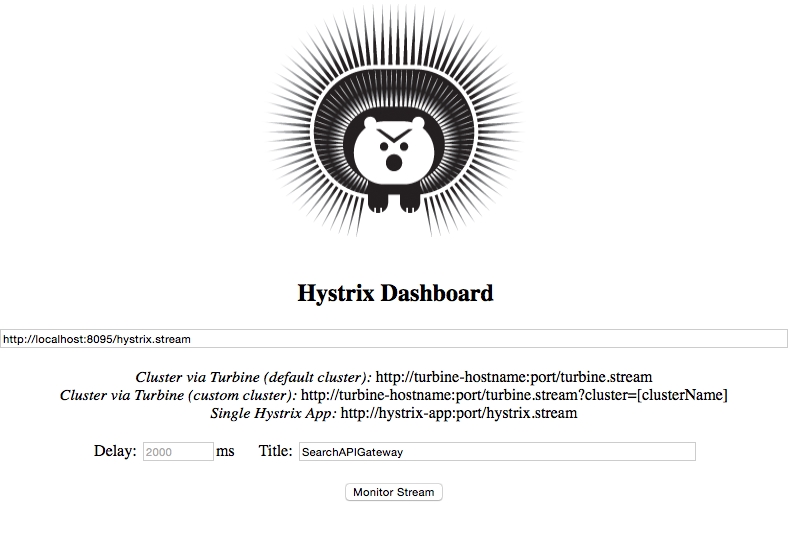
- The Hystrix Dashboard will be displayed as follows:
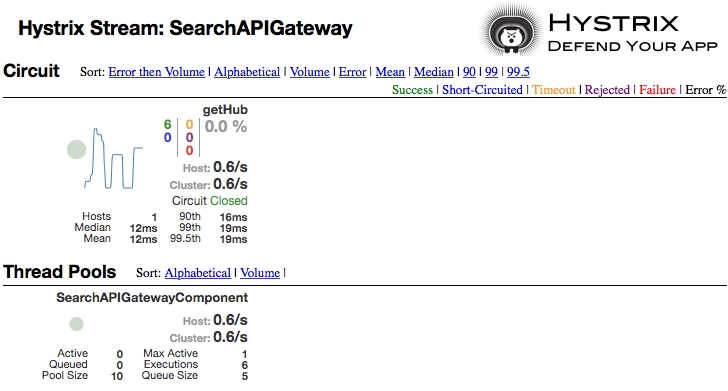
- Create a failure scenario by shutting down the Search service. Note that the fallback method will be called when hitting the URL
http://localhost:8095/hubongw. - If there are continuous failures, then the circuit status will be changed to open. This can be done by hitting the preceding URL a number of times. In the open state, the original service will no longer be checked. The Hystrix Dashboard will show the status of the circuit as Open, as shown in the following screenshot. Once a circuit is opened, periodically, the system will check for the original service status for recovery. When the original service is back, the circuit breaker will fall back to the original service and the status will be set to Closed:
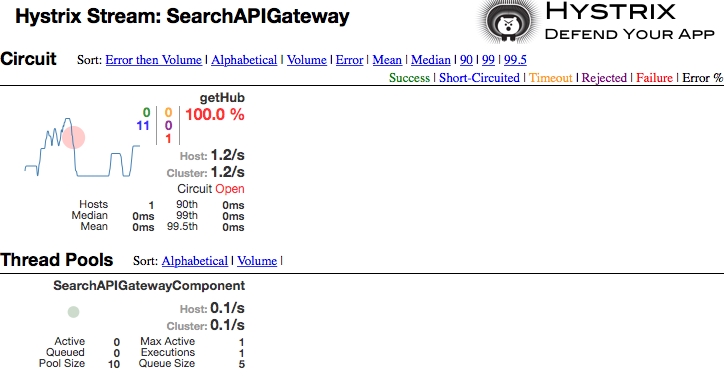
Note
To know the meaning of each of these parameters, visit the Hystrix wiki at https://github.com/Netflix/Hystrix/wiki/Dashboard.
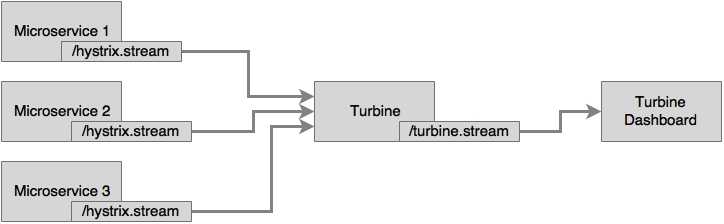
In the previous example, the /hystrix.stream endpoint of our microservice was given in the Hystrix Dashboard. The Hystrix Dashboard can only monitor one microservice at a time. If there are many microservices, then the Hystrix Dashboard pointing to the service has to be changed every time we switch the microservices to monitor. Looking into one instance at a time is tedious, especially when there are many instances of a microservice or multiple microservices.
We have to have a mechanism to aggregate data coming from multiple /hystrix.stream instances and consolidate it into a single dashboard view. Turbine does exactly the same thing. Turbine is another server that collects Hystrix streams from multiple instances and consolidates them into one /turbine.stream instance. Now, the Hystrix Dashboard can point to /turbine.stream to get the consolidated information:
Tip
Turbine currently works only with different hostnames. Each instance has to be run on separate hosts. If you are testing multiple services locally on the same host, then update the host file (/etc/hosts) to simulate multiple hosts. Once done, bootstrap.properties has to be configured as follows:
eureka.instance.hostname: localdomain2
This example showcases how to use Turbine to monitor circuit breakers across multiple instances and services. We will use the Search service and Search API Gateway in this example. Turbine internally uses Eureka to resolve service IDs that are configured for monitoring.
Perform the following steps to build and execute this example:
- The Turbine server can be created as just another Spring Boot application using Spring Boot Starter. Select Turbine to include the Turbine libraries.
- Once the application is created, add
@EnableTurbineto the main Spring Boot Application class. In this example, both Turbine and Hystrix Dashboard are configured to be run on the same Spring Boot application. This is possible by adding the following annotations to the newly created Turbine application:@EnableTurbine @EnableHystrixDashboard @SpringBootApplication public class TurbineServerApplication { - Add the following configuration to the
.yamlor property file to point to the instances that we are interested in monitoring:spring: application: name : turbineserver turbine: clusterNameExpression: new String('default') appConfig : search-service,search-apigateway server: port: 9090 eureka: client: serviceUrl: defaultZone: http://localhost:8761/eureka/ - The preceding configuration instructs the Turbine server to look up the Eureka server to resolve the
search-serviceandsearch-apigatewayservices. Thesearch-serviceandsearch-apigatewaysservice IDs are used to register services with Eureka. Turbine uses these names to resolve the actual service host and port by checking with the Eureka server. It will then use this information to read/hystrix.streamfrom each of these instances. Turbine will then read all the individual Hystrix streams, aggregate all of them, and expose them under the Turbine server's/turbine.streamURL. - The cluster name expression is pointing to the default cluster as there is no explicit cluster configuration done in this example. If the clusters are manually configured, then the following configuration has to be used:
turbine: aggregator: clusterConfig: [comma separated clusternames] - Change the Search service's
SearchComponentto add another circuit breaker, as follows:@HystrixCommand(fallbackMethod = "searchFallback") public List<Flight> search(SearchQuery query){ - Also, add
@EnableCircuitBreakerto the main Application class in the Search service. - Add the following configuration to
bootstrap.propertiesof the Search service. This is required because all the services are running on the same host:Eureka.instance.hostname: localdomain1
- Similarly, add the following in
bootstrap.propertiesof the Search API Gateway service. This is to make sure that both the services use different hostnames:eureka.instance.hostname: localdomain2
- In this example, we will run two instances of
search-apigateway: one onlocaldomain1:8095and another one onlocaldomain2:8096. We will also run one instance ofsearch-serviceonlocaldomain1:8090. - Run the microservices with command-line overrides to manage different host addresses, as follows:
java -jar -Dserver.port=8096 -Deureka.instance.hostname=localdomain2 -Dserver.address=localdomain2 target/chapter7.search-apigateway-1.0.jar
java -jar -Dserver.port=8095 -Deureka.instance.hostname=localdomain1 -Dserver.address=localdomain1 target/chapter7.search-apigateway-1.0.jar
java -jar -Dserver.port=8090 -Deureka.instance.hostname=localdomain1 -Dserver.address=localdomain1 target/chapter7.search-1.0.jar
- Open Hystrix Dashboard by pointing the browser to
http://localhost:9090/hystrix. - Instead of giving
/hystrix.stream, this time, we will point to/turbine.stream. In this example, the Turbine stream is running on9090. Hence, the URL to be given in the Hystrix Dashboard ishttp://localhost:9090/turbine.stream. - Fire a few transactions by opening a browser window and hitting the following two URLs:
http://localhost:8095/hubongwandhttp://localhost:8096/hubongw.Once this is done, the dashboard page will show the getHub service.
- Run
chapter7.website. Execute the search transaction using the websitehttp://localhost:8001.After executing the preceding search, the dashboard page will show search-service as well. This is shown in the following screenshot:
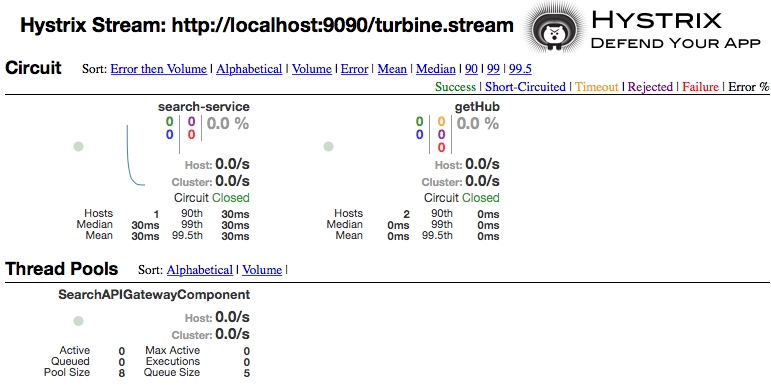
As we can see in the dashboard, search-service is coming from the Search microservice, and getHub is coming from Search API Gateway. As we have two instances of Search API Gateway, getHub is coming from two hosts, indicated by Hosts 2.