
Previously, in Chapter 12, Automating Processes with ModelBuilder and Python, you learned about two programming languages that can be used to automate processes within ArcGIS Pro—ModelBuilder and Python. As you learned, ModelBuilder is considered a graphic or visual programming language, while Python is a syntax-driven scripting language. With the release of ArcGIS Pro 2.0 and ArcGIS Enterprise 10.7, Esri has introduced a new language called Arcade. Arcade is a new lightweight expression language that has many uses within the ArcGIS Platform as you will learn throughout this chapter.
This chapter will introduce you to the basic uses and syntax for Arcade. After completing this chapter, you will be able to create expressions that can generate text labels or control symbology.
In this chapter, you will learn about the following topics:
- Learning about Arcade
- Understanding labeling expressions
- Understanding symbology expressions
Technical requirements
As with previous chapters of this book, you will need ArcGIS Pro 2.6 or later to complete the exercises included in this chapter.
Learning about Arcade
As mentioned previously, Arcade is a lightweight expression language for ArcGIS. It is compatible with ArcGIS Pro, ArcGIS Enterprise, and ArcGIS Online. This means the expressions that you create in one application will successfully render the same way in the others. Because it is lightweight, meaning it does not require as much processing power to execute, it performs faster than other languages, making it perfect for web maps, as well as for working with large datasets.
Each new release of ArcGIS includes increased use and capability of Arcade throughout the platform, including ArcGIS Pro. Initially, Arcade was used to create labeling expressions and control symbology, as you will learn in this chapter. It has since been expanded so that it can also be used to create fields on the fly that appear in information pop-up windows, establish attribute rules within your GIS database, create expressions in various geoprocessing tools, and more.
It should be noted, for those who have used the older applications that ArcGIS Pro is now replacing, that Arcade is not compatible withArcMaporArcCatalog, nor does it appear that Esri has any intention of making Arcade compatible with these older applications.
You may ask yourself what is the difference between Arcade and other languages such as Python? That is a very good question. The primary difference is that as an expression language, Arcade cannot be run externally from one of its parent applications, such as ArcGIS Pro. Languages such as Python don't have this same limitation. You can run a Python script from outside of ArcGIS using Windows Scheduler, the command line, and more. One thing that Arcade has in common with other languages is that it has its own syntax. So, let's explore some of Arcade's general syntax, which is used to create expressions, in this section.
Understanding Arcade syntax
The syntax for Arcade has many things in common with other languages, such as Python or Structured Query Language (SQL). The first thing that we should define is its syntax. The syntax is the way that the code must be formatted in order for the expression, script, or application to run successfully. Now, you will examine specific examples of the syntax used in Arcade.
Understanding the text string syntax
When creating an expression using Arcade, if you want something to be treated as text, you must enclose it in single quotes, as in the following Arcade expression:
'Owners Name is '+$feature['Parcels.Owner_Name']
This will create text labels on a map that looks as in the following diagram:
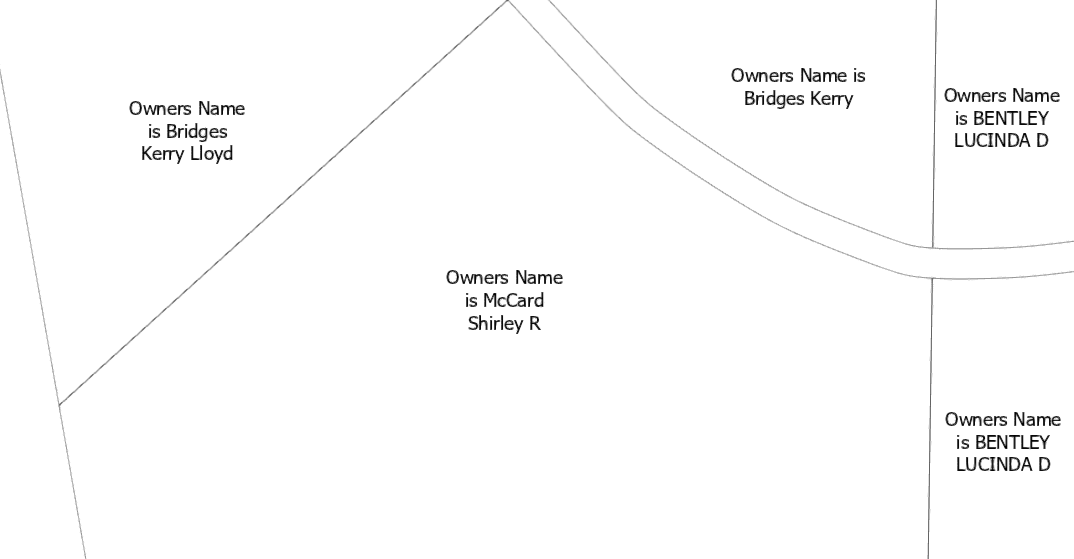
As you can see in the preceding screenshot, the expression creates text labels that appear on the map for each parcel. The phrase Owners Nameis appears from the part of the expression that is enclosed in single quotes to indicate a text string. The actual owner's name, which is displayed in the map, is pulled from the attribute table associated with the Parcels layer.
Next, we will explore how to add comments to your expressions.
Inserting comments into expressions
When writing any code, be it with Arcade, Python, or another programming language, it is considered best practice to add comments within your code that explain the function of a section within the code or provide descriptive information about the code, such as who created it, when it waswritten, the date it was created, and more.
Arcade supports both single-line and multiple-line comments in your Arcade expressions. To add a single-line comment to your code, use //, as in the following code snippet:
//The following line labels a parcel with its owner's name.
When ArcGIS Pro, ArcGIS Enterprise, or ArcGIS Online processes the Arcade code, it will ignore any line that starts with // as if it does not exist and will automatically proceed to the next line in the Arcade expression.
Often, you will need to add more comments within your code that require multiple lines. To add multiple-line comments in Arcade, you must start the first comment line with /* and end the last line with */, as in the following code:
/*
This expression was built using Arcade for ArcGIS Pro 2.5 and ArcGIS Enterprise 10.8.
It will label each parcel with its Parcel Identification Number and the Owner Name.
*/
Applications will ignore everything between /* and */ and go to the next line of code in the expression.
Comments provide valuable information within your expression so that you and others can understand the purpose of the code used. This can be very helpful if, in the future, you or someone else needs to make updates to the expressions.
Adding text string values and comments are very useful, but what if you need to use data found in a table in your expression to label a feature or apply specific symbology? We will explore the syntax required for that in the next section.
Adding data from a table
As you are creating expressions to generate labels or symbology, you will need to pull data from the layer's attribute table. This is done by using a syntax that starts with $feature, as in the following code:
$feature.Land_Value
As you can see from the preceding code, $feature is an example of a global variable. This is followed by a period and then the field name that you wish to retrieve the value from.
This would return a label displaying the land value for a feature or generate a symbol for each land value.
In the next section, we will introduce variables in Arcade expressions.
Defining a variable
When writing code for expressions, scripts, or applications, a variable is something that you can assign a value to and then use the variable in place of the value. This makes it easier to type as you write your code because the variable that you create is often shorter than the real value.
For example, you could create a variable called X and then say that it equals Peachtree Industrial Boulevard. So, any time in your code that you need to reference the Peachtree Industrial Boulevardvalue, you could just type X in the code and the application would know that that meant Peachtree Industrial Boulevard.
In Arcade, to create a variable, you must declare it using a Var statement. The following code is an example of a variable in an Arcade expression:
Var owner = "Tripp"
Return owner;
The preceding code will return a value of Tripp to the application running the expressions. One other thing that you need to know about Arcade when creating a variable is that it is not case sensitive like other languages, such as Python. So, to Arcade, a variable called owner is the same as Owner or OWNER.
So, you now know about some of the common Arcade syntaxes that are used when creating various types of expressions. It is important to understand the syntax if you are going to successfully create expressions on your own. The syntax forms the foundation for any expression that you wish to create.
Now, it is time to look at specific types of expressions, starting with labeling in the next section.
Understanding labeling expressions
As you learned in Chapter 3, Creating 2D Maps, labeling is a method to display text in a map based on attribute values connected to the features being labeled. However, in that chapter, you were only shown how to label each feature using a single attribute field. What if you wanted to label features with values found in multiple fields? For example, say you wanted to label each parcel with its parcel identification number and the owner's name. How would you do that?
Arcade allows you to create expressions that can do just that and more. You can label based on multiple fields and even split values on to multiple lines. You can even add descriptive text to the label as well. This section will teach you how to create expressions that will allow you to create labels that do all of these.
Now, we will examine how to label features using multiple field values.
Configuring expressions to label with multiple field values
Creating an Arcade expression that labels features with values pulled from more than one field in its attribute table is pretty straightforward, meaning the syntax is not complicated. It could be as simple as using the following code, for example:
$feature.Parcel_No+$feature.Acre
The preceding code would label each feature in the layer with its parcel number (Parcel_No) and its area in acres (Acre), as in the following screenshot:
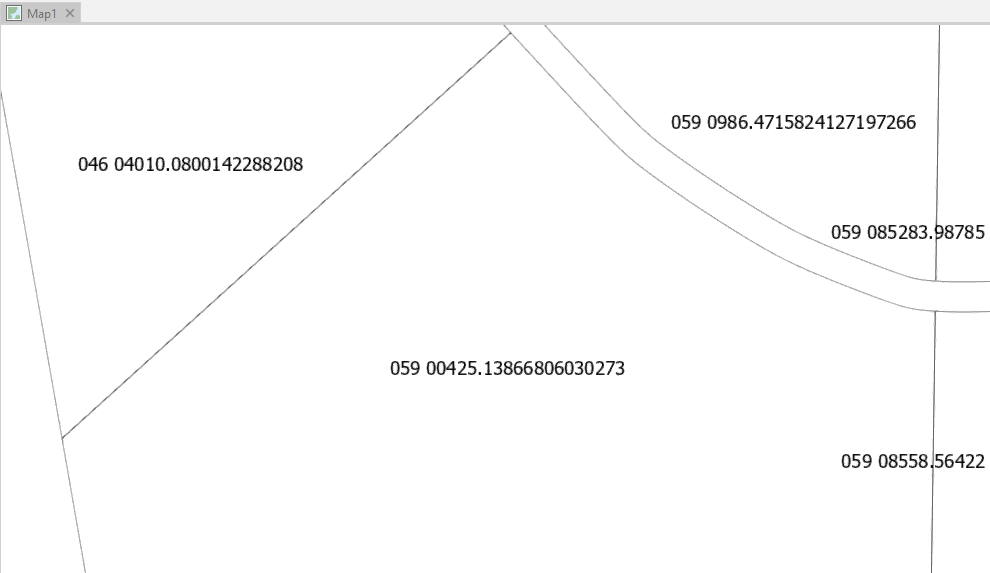
As you can see from the preceding screenshot, while each feature is labeled with both the parcel number and its acreage, it is hard to tell where one stops and the other begins. Adding a space between the two values would certainly help. To add a space between the two values, see the sample code that follows:
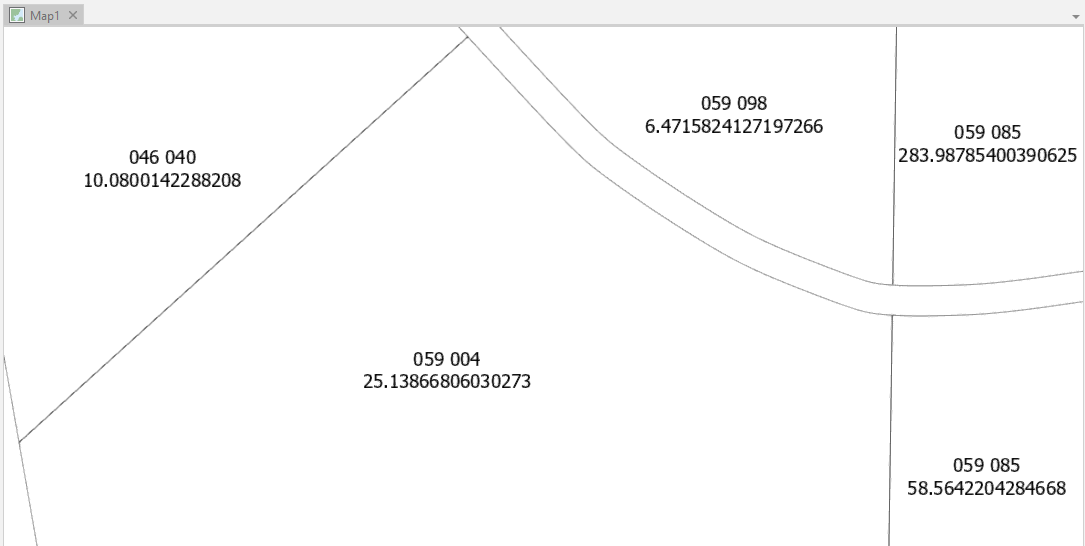
$feature.Parcel_No+' '+$feature.Acre
Here, we added +, followed by a single quotation mark with a space, and then another single quotation mark. This is then followed by another +, before the syntax for the Acre field. This results in labels that look like the following:

As you can see from the preceding screenshot, the labels are a bit clearer now that a space has been added between the value for the parcel number and the acres. However, it could still be made better. So, next, we will look at a method to split the values on to their own line and add more descriptive text.
Making labels more readable
While it can be extremely useful to label features with values from multiple fields, as you have seen, the label can be confusing or hard to read. Splitting those values on to separate lines and adding some descriptive text that explains what the values represent can make the label much easier to understand.
To split a label into multiple lines, you will need to use the Textformatting.Newline command in your expression. If we use the expression that we created in the previous section to split the parcel number and acre values on to separate lines, the new expression would look like this:
$feature.Parcel_No+Textformatting.Newline+$feature.Acre
This results in labels that look as follows:
As you can see from the preceding screenshot, the parcel number is displayed on the top line and the acreage is on the bottom line. You know this because you created the expression. However, someone else viewing the map may not understand what the two values are because there is no context or description. So, how do you add descriptive text to the labels?
You have already seen an example of that in the Understanding the text string syntax section of this chapter. You simply add your desired descriptive text enclosed in single quotes, as in the following code:
'Parcel ID Num = '+$feature.Parcel_No+Textformatting.Newline+'Area in Acres = '+$feature.Acre
This will result in labels that look as in the following screenshot:
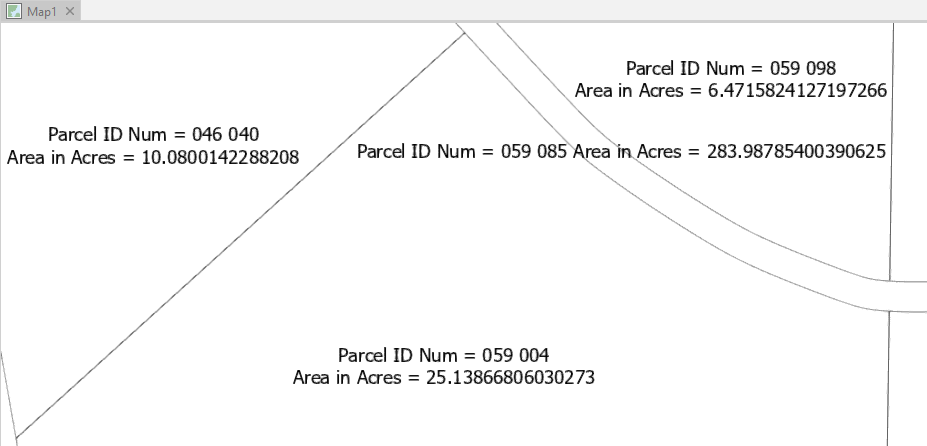
As you can see in the preceding screenshot, these labels are now much easier to read and understand. Now, it is your turn to put the knowledge that you have just learned into practice via a hands-on exercise.
Exercise 14A – Creating an Arcade label expression
The public works director has asked you to create a map that labels each sewer line with its size and the material that the pipe is made of. The attribute data for the city's sewer lines includes this information, but it is split between two fields. So, you will need to create an Arcade expression to accomplish this request.
In this exercise, you will create an Arcade labeling expression that will label each sewer line with both its size and material. You will then work to make the label easier to understand by adding descriptive text.
Step 1 – Opening your project and reviewing the available data
In this step, you will open an existing project that already has a map that contains the sewer line data as a layer. You will then review the data available for the sewer lines to verify which fields you will need to use for the labels that you need to display:
- Start ArcGIS Pro and open the Ex14A.aprx project file, located in C:StudentIntroArcProChapter14. When the project opens, you should see the sewer system map, which contains the Sewer Lines layer that the public works director wants to be labeled with the size and pipe material.
- Next, you will examine the attribute table for the sewer lines to verify that the required data exists. Right-click on the Sewer Lines layer in the Contents pane, then select Attribute Table from the menu that appears, as in the following screenshot:
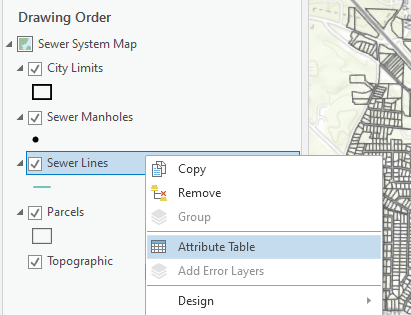
The attribute table for the Sewer Lines layer should open below the map view area. It's now time to review the table.
- Take a few moments to review the attribute table for the Sewer Lines layer. Notice what fields are included in the table. Locate the two fields that might contain the data requested by the director.
- Once you have identified the two fields that contain the data needed to create the labels requested by the director, close the attribute table.
You have now verified that you have the data required to create the requested labels for the sewer lines by reviewing the attribute table for that layer. Now, it is time to start building the labeling expression that will label the sewer line features.
Step 2 – Creating a simple label expression
In this step, you will use the two fields that you identified in the last step to create an Arcade labeling expression. This will result in the sewer line features being labeled with text indicating their size and pipe material:
- Click on the Map tab in the ribbon. Then, click on the Bookmark button in the Navigate group. Select the Sewer Labeling Area bookmark, as in the following screenshot, to zoom the map to a better scale for viewing labels:

- Select the Sewer Lines layer in the Contents pane. The Feature Layer group contextual tab should appear in the ribbon.
- Click on the Labeling tab in the Feature Layer group contextual tab.
- Click on the Label button in the Layer group on the far left-hand side of the Labeling tab to turn on labels for the Sewer Line layer.
When you turn on the labels, you should see some text appear just above each feature in the Sewer Line layer. The text that appears is not the value that the director had asked for. You will start building the expression next, which will display the requested values.
- Click on the Expression button to the right of the Field cell, as shown in the following screenshot. This will open the Label Class pane:

- In the Label Class pane, verify that the Language field is set to Arcade using the drop-down arrow.
- In the Expression panel of the Label Class pane, delete the existing expression by selecting the entire expression with your mouse and pressing the Delete key on your keyboard.
- In the Fields panel, locate and double-click on PIPE SIZE. That value should appear in the Expression panel, as in the following screenshot:
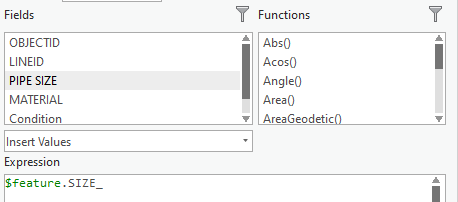
Notice how the $feature syntax is automatically added and the SIZE_ field appears instead of PIPE SIZE. The $feature syntax was automatically added because you double-clicked in the Fields panel to add that selection to the expression.
- Next, type + after $feature.SIZE_ in the expression panel and type ‘ ‘. There is a space between the two single quotation marks. This will add a space after the pipe size in the displayed label.
- Type another + character after the last quotation mark and then double-click on MATERIAL in the Fields panel so that it is added to the expression. Your expression should now look as in the following code:
$feature.SIZE_+' '+DomainName($feature, 'MATERIAL')
Notice that the syntax for the MATERIAL field is a bit different than what was used for the PIPE SIZE field. That is because the MATERIAL field has been assigned a domain, which is a list of acceptable values that limits the user's ability to place any values otherthan those on the list into that field. This helps improve data accuracy.
- Click on the Apply button. The text in the map should change so that you can now see that the sewer lines are labeled with their size and material, as shown in the following screenshot:

- Save your project by clicking on the Save Project button on the Quick Access Toolbar.
You have created a label expression that meets the minimum requirements requested by the public works director. However, you could improve on it a bit more. For example, the pipe size is just a number; there is nothing to indicate the units associated with that number. It could be inches, centimeters, or something else. So, let's add to your expression to clarify the units for the pipe size.
- In the Expression panel in the Label Class pane, click with your mouse just after $feature.SIZE_ in the expression that you have created. Then, type +’in’ so that your expression should now look as follows:
$feature.SIZE_+'in'+' '+DomainName($feature, 'MATERIAL')
- Once you have verified that your expression is correct, click the Apply button to apply the change to your expression. The labels should update to now include the text after the pipe size number. This indicates the sizes are in inches.
- Save your project and close ArcGIS Pro.
In this exercise, you learned how to create an Arcade labeling expression that labels features based on values found in two different fields. You also learned how to format that expression to include a text string to indicate the units and add a space between values. Next, you will look at how Arcade expressions can be created so that they can control the symbology for a layer.
Understanding symbology expressions
Now that you understand how Arcade expressions can be used to label features, it is time to look at another use for Arcade. You can also use Arcade expressions to control the symbology for features within a layer.
You can use Arcade expressions to generate symbology categories or ranges based on equations, functions, or data logic. This can provide much greater flexibility with your data and how you can display it. For example, you might have a road that is attributed with the traffic count values. However, you want to symbolize them with a simple low, medium, or high volume for those who may not know about low, medium, or high traffic count numbers. An Arcade expression will allow you to do that.
This section will show you how to create a symbology expression, along with some common operators.
Now that you have a general idea of what a symbology expression can be used for, it is time to create one.
Creating a symbology expression
As mentioned, symbology expressions allow you to create symbology categories or ranges based on a function, equation, or data logic. So, how do you do that? Well, one of the common ways is to use if statements.
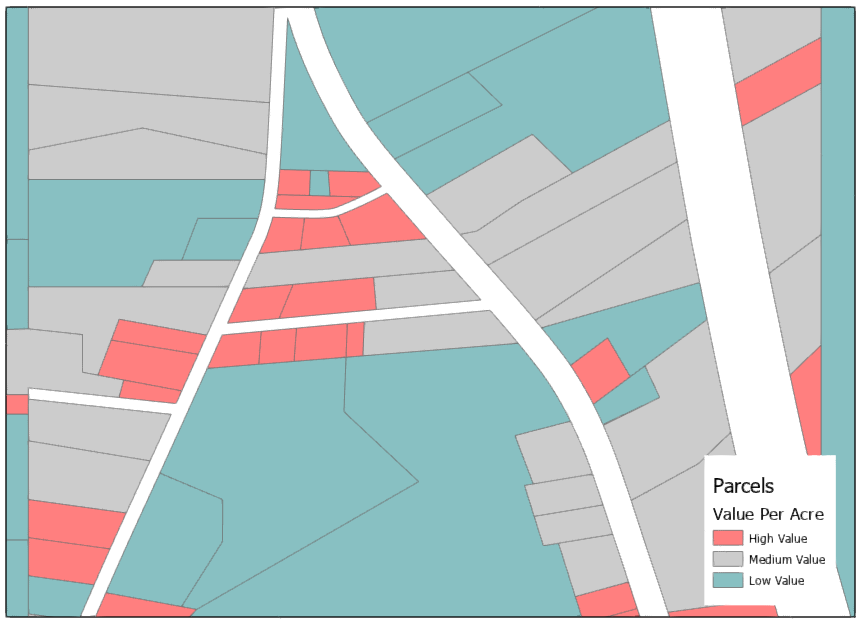
if statements are used to create conditional logic. That means the statements make use of operators, such as equal to, not equal to, greater than, or less than, to group data. For example, if you wanted to symbolize parcels based on land value by identifying them as having a high, medium, or low value per acre, you might create an expression that looks like this:
var value = ($feature['Parcel_Polygon.par_val']
  /$feature['Parcel_Polygon.Acre'])
if (value <= 10000){
    return 'Low Value';}
if (value > 10000 && value <= 50000){
    return 'Medium Value';}
else {
    return 'High Value';}
The first line in this expression defines a variable named value. This is the value of the parcel divided by the area of the parcel in acres. This represents the value per acre for each parcel.
The next lines then evaluate whether the result is Low Value, Medium Value, or High Value, which becomes the display category for the parcels. A low value is any number less than or equal to 10,000. A medium value is any number that is greater than 10,000 and less than or equal to 50,000. A high value is any number that does not meet the other two criteria—so, any number greater than 50,000.
You can see the results in the following map screenshot:
Next, we will look at some of the common operators that you might use in your expressions.
Understanding the common operators
Arcade supports many operators. Operators are logical functions that are included in an expression, such as equal to or not equal to. These operators are typically represented by a symbolic character or multiple symbolic characters. Some of the common operators you will use are as follows:
- Basic operators
- Logical operators
The basic operators are as follows:
- The + operator: This adds two numbers or concatenates two strings.
- The - operator: This subtracts two numbers.
- The *operator: This multiplies two numbers.
- The /operator: This divides two numbers.
- The ++operator: This increments a number variable by 1.
The logical operators are as follows:
- The ||operator: This means or.
- The &&operator: This means and.
- The ==operator: This means equal to.
- The !=operator: This means not equal to.
- The <operator: This means less than.
- The <=operator: This means less than or equal to.
- The >operator: This means greater than.
- The >=operator: This means greater than or equal to.
Now, it is your turn to create a symbology expression with a hands-on exercise.
Exercise 14B – Creating a symbology expression
The road superintendent recently completed an inspection of all the roads in the city, giving them a score between 1 and 100. The higher the score, the better condition the road is in. They would now like you to create a map showing the results of their inspections that they can present to the city council. However, instead of displaying the actual score for each road, they would like the roads symbolized as good, fair, or poor based on the score. A score of 1 to 40 would be considered poor. A score of 41 to 70 would be considered fair. A score of 71 or above would be considered good.
In this exercise, you will create a symbology expression that will evaluate the score for each road segment and return whether it is poor, fair, or good.
Step 1 – Evaluating the Street_Centerlines layer
In this step, you will open the project that contains the map showing the street centerline data. You will then open the attribute table for that data and review the information to determine where the inspection scores are located and what values are present:
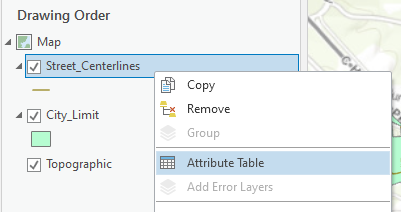
- Start ArcGIS Pro and open the Ex14B.aprx project file located in C:StudentIntroArcProChapter14. When the project opens, you should see a map containing two layers—Street_Centerlines and City_limit—and a basemap.
- Right-click on the Street_Centerlines layer in the Contents pane and select Attribute Table from the menu that appears, as in the following screenshot:
- Review the available fields in the attribute table for the Street_Centerlines layer.
- Take a moment to scroll down and review the values in the Inspection Score field that you just identified.
- Now, you need to determine what type of field Inspection Score is and what its true name is. Right-click on the Inspection Score field and select Fields from the menu that appears, as in the following screenshot:

You may ask yourself how we knew that Inspection Score was not the true name of the field. Field names in databases have specific limitations. First, they must start with a character and not a number. Second, they cannot contain special characters, such as spaces, &, @, and so on. Note that underscores are allowed.
Depending on the type of database, there may be other restrictions as well. Since the name displayed was Inspection Score, which contains a space, we know this is not the true name but is rather an alias.
- The Fields window should now be open. Review the information displayed in the window.
It is important to know these two things. The true name for the field is what you will need to use in the Arcade expression that you will build. The data type will also impact the syntax and what you can do with the values contained in the field.
- Close the Fields window and the Street_Centerlines attribute table.
Now that you know which field you will need to use to build your symbology expression and what its data type is, it is time for you to create the expression.
Step 2 – Creating a symbology expression
In this step, you will create an Arcade expression that will generate the symbology requested by the street superintendent. This expression will evaluate the score for each street segment and place it into the desired categories of poor, fair, and good:
- In the Catalog pane, select the Street_Centerline layer so that the Feature Layer contextual group tab appears, containing the Appearance, Labeling, and Data tabs.
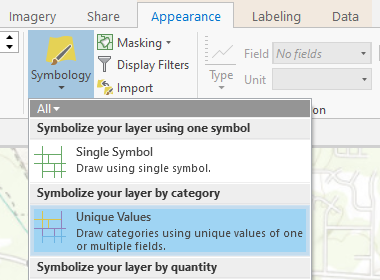
- Click on the Appearance tab in the ribbon. Then, click on the Symbology drop-down arrow and select Unique Values, as in the following screenshot. This will open the Symbology pane:
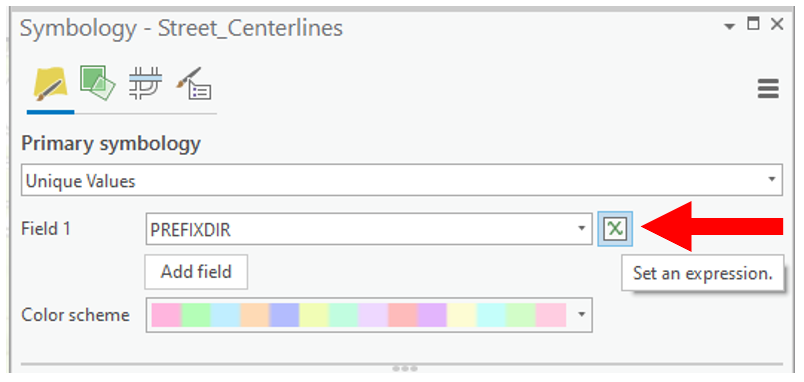
- Next, click on the Set an expression button, located to the far right of the Field 1 options, as illustrated in the following screenshot. This will open the Expression Builder window:
- In the cell located to the right of Title, type Overall Condition. This will be the title that appears in the Contents pane and the legend.
Under the title that you just changed, there are two panels—Fields and Functions. The Fields panel contains a list of all the fields present in the attribute table for the Street_Centerlines layer. The Functions panel contains a list of general math, spatial analysis, and other functions that you can use in your expression. You will use the Fields panel later in this exercise.
Under these two panels is the Expression panel. It is here that you will create your expression. This should already contain a simple expression calling on a single field. You will need to delete the current expression and build your own new one next.
- Use your mouse to select the current expression displayed in the Expression panel. Once selected, press the Delete key on your keyboard to erase the current expression.
- Start your new expression by defining a variable that references the inspection score for each segment. In the Expression pane, type the following code, and then press Enter:
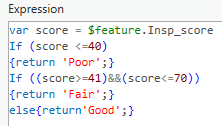
Var score = $feature.Insp_score
You have now associated the scorevariable with the inspection score found in the database for each street centerline segment. So, when you need to reference that field in your expression code, all you need to do is use score.
Next, you will use If statements to evaluate the inspection score for the segment so that they can be placed into the desired symbology categories.
- In the Expression panel, add the following code and press Enter to move to the next line. This first line will segregate all the street segments that have an inspection score of 40 or less:
If (score <=40)
- Next, you will add a line of code to your expression that tells it what to do with any street segments with an inspection score less than or equal to 40. Add the following code after the last line of code that you wrote:
{return 'Poor';}
Your expression should now look as in the following screenshot:

You have created your first If statement. You still have more to write, though.
- In the Expression panel, add the following code to your expression:
If ((score>=41)&&(score<=70))
    {return 'Fair';}
This If statement evaluates all the road segments with an inspection score greater than or equal to 41 and less than or equal to 70. Then, it puts them into the Fair category. Remember that the && expression is the Arcade syntax for and in the expression.
Now, you need to create the code that handles the values that are greater than 70, which will be placed in the Good category.
- In the Expression panel, add the following code to your expression for those features that have an inspection score that is greater than 70:
else{return'Good';}
- Verify that your expression looks as in the following screenshot, then click OK to apply the new expression that you just created:
- Close the Symbology pane so that you can see the map.
Your map should now look similar to the one in the following screenshot. Your colors may be a bit different, but you should now see the three categories that your Arcade expression generated, plus the <all other values> category, which appears by default. Also, notice above the symbology categories that the title that you entered has appeared as well, as follows:

- Save your project and close ArcGIS Pro.
Congratulations! You have just created your first symbology Arcade expression. This will allow you to create more useful maps based on logical statements and equations. This further increases the flexibility of your geographical information system.
Summary
In this chapter, you have learned how Arcade expression can allow you to create maps that contain more descriptive labels and logical symbology. This further enhances your ability to use your GIS data by allowing you to create even more useful and detailed maps.
As you have seen, Arcade, like Python, has its own syntax. You now have a general understanding of this new syntax and what it requires.
This chapter just touched the surface of what you can do with Arcade in the ArcGIS platform. With each new release of ArcGIS Pro, ArcGIS Enterprise, and ArcGIS Online, Esri is adding more capability to the Arcade expression language.
Further reading
For more information about Arcade syntax and capability, go to https://developers.arcgis.com/arcade/.