
One of the favorite questions I often hear from administrators, directors, and elected officials is When will our GIS be done? The honest answer is never. Much of the information that we store in a Geographic Information System (GIS) is constantly changing – new roads are built, parcels are split and sold, new sewer lines are installed, and more. All of these changes need to be incorporated into our GIS databases. To do this, you must be able to edit your GIS data.
ArcGIS Pro allows you to edit your GIS data, both spatial and tabular. You can add new features or modify existing ones. You can also edit the structure of your GIS database. With ArcGIS Pro, you can create new feature classes, add new attribute fields, create new tables, add domains, and more. It also supports the editing of both 2D and 3D data.
Since ArcGIS Pro was released in 2015, Esri has continually improved the editing capabilities of ArcGIS Pro. Most of the tools that were available in the older ArcMap application are now included in ArcGIS Pro. However, there are still a few data types, such as personal geodatabases and geometric networks, that cannot be edited with ArcGIS Pro. These most likely will never be supported in ArcGIS Pro. The old ArcMap Parcel Fabric is also not editable with ArcGIS Pro. Esri has developed a new version of Parcel Fabric for ArcGIS Pro.
It is now time for you to start exploring how to edit spatial data in ArcGIS Pro. In this chapter, you will learn the following topics:
- Understanding the editable data formats
- Editing data using ArcGIS Pro
- Learning what types of data can be edited
- Creating and managing feature templates
- Creating and updating spatial data
- Knowing which data types can be edited
The skills that you will learn while working through these topics will provide you with a basic understanding of the editing workflow in ArcGIS Pro and how to use many of the most commonly used tools to maintain and update your GIS data.
Technical requirements
Like the other chapters in this book, you will need to have ArcGIS Pro 2.6 or newer installed. A basic license should be sufficient to complete the exercises contained in this chapter. You might find it helpful to have multiple monitors, although this is not mandatory.
Understanding the editable data formats
ArcGIS Pro allows users to access and use a lot of data formats to make maps, perform queries, and more. However, using and accessing is very different from being able to edit. It is important to know the limits of ArcGIS Pro with certain common data formats.
In this section, you will learn what data storage formats you can edit in ArcGIS Pro and how you can tell what format your data is stored in while working in ArcGIS Pro. This section will also provide you with a short introduction to the Esri geodatabase storage format, which is the preferred format for ArcGIS Pro.
Data formats – editable or not
The more you work in GIS, the greater the number of different data formats you will encounter. Esri's ArcGIS platform supports many of the most frequently used formats. However, as we said earlier, there is a big difference between being able to view and query data, and being able to edit it.
ArcGIS Pro has various data storage formats that you are likely to encounter on a regular basis. The following table outlines some of the limits that ArcGIS Pro has when using some of these various storage formats:
|
Data format |
Display |
Edit |
Comments |
|
Personal geodatabase |
No |
Yes |
Esri has said they will never support this format in ArcGIS Pro. |
|
File and Enterprise (also known as Spatial Database Engine (SDE)) geodatabase |
Yes |
Yes |
Enterprise geodatabases require a standard license or above. Geometric Networks and ArcMap Parcel Fabric editing are currently not supported, but ArcGIS Pro Utility Network and Parcel Fabric are supported. |
|
Shapefiles |
Yes |
Yes |
|
|
CAD files (.dwg, .dxf, or .dgn) |
Yes |
No |
ArcGIS Pro may have some issues displaying newer versions of AutoCAD's .dwg format. |
|
ArcGIS Feature Layer Service |
Yes |
Yes |
Published with ArcGIS Server, ArcGIS Enterprise, or ArcGIS Online. It must have editing enabled on the service. |
|
Web Map Service |
Yes |
No |
ArcGIS Pro can access web map services, including ArcGIS Server/Enterprise, ArcGIS Online, Warehouse Management System (WMS), and Web Map Tile Service (WMTS). |
|
Excel spreadsheet |
Yes |
No |
|
|
DBF file |
Yes |
Yes |
|
|
Text files (.txt or .csv) |
Yes |
No |
The preceding list is just those data types that are most frequently encountered with a focus on vector or tabular data. There are many other GIS data formats. Shapefiles and geodatabases are the primary spatial formats that ArcGIS Pro is designed to interact with in their entirety.
Understanding geodatabases
It is important to note that the Personal geodatabase format is not supported in ArcGIS Pro. Esri has been slowly reducing support for this type of geodatabase, which is built on top of Microsoft Access Database technology. This is largely due to the limitations of Microsoft Access, which is restricted to 2 gigabytes in size and whose performance slows down as the database gets larger. This is the reason why Esri developed the file geodatabase.
It is strongly recommended that if you are still using personal geodatabases, you migrate them to a file or enterprise geodatabase, especially if you wish to begin using ArcGIS Pro or ArcGIS Online. File and enterprise geodatabases offer much better performance and storage capacity. The following table is a general comparison between the three general types of geodatabases that can be created with the ArcGIS platform:
|
|
Personal |
File |
Enterprise/SDE |
|
Supporting database |
Microsoft Access |
Individual files designed by Esri |
SQL Server Express, SQL Server, Oracle, DB2, Informix, SAP HANA, SQLite, Teradata Data Warehouse, and PostgreSQL |
|
Storage limit |
2 GB (performance degrades as size increases) |
1 TB at the base of the database, plus 1 TB per feature dataset up to the maximum limit allowed by the hardware. |
10 GB plus depending on the supporting database |
|
Number of editors |
1 |
1 per feature dataset (if the map references layers from multiple feature datasets, each dataset will be locked when editing) |
10 or more depending on the supporting database |
Now that you know that ArcGIS Pro allows you to work with multiple data storage formats, but that you can only edit a few, how do you tell what format the data you are using is stored as? That is a good question. The next section will help you answer this question.
Identifying your data format
Just as ArcGIS Pro allows you to visualize your data, it also provides visual clues about the data you are working with. Different icons are displayed next to various types of data to help you easily identify the type of data you are working with. The following screenshot illustrates some of the icons used by ArcGIS Pro to identify different types of data:
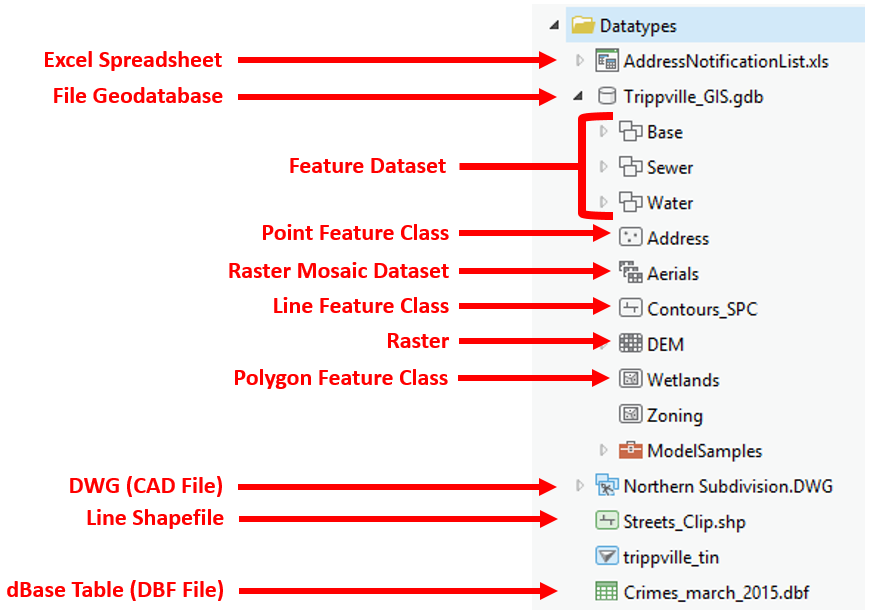
As you can see in the preceding screenshot, ArcGIS Pro uses different icons to indicate the data type. For example, shapefiles use green icons with a graphic to tell whether the shapefile contains points, lines, or polygons. Computer Aided Designing (CAD) files are identified with blue icons; .dwg, .dxf, and .dgn files all use the same blue icons. ArcGIS does not distinguish between files created with AutoCAD, MicroStation, or one of the other many drafting and design software packages used by engineers and surveyors.
Notice that some data formats support the storage of multiple data and feature types, while others only allow users to store a single data type. For example, the geodatabase allows you to store points, lines, polygons, raster, and more within a single database, whereas a shapefile will only allow you to store a single data type. A shapefile will be a point or a line or a polygon shapefile. It cannot contain more than one data type in a single shapefile.
It is important for you to know what data formats you are working with as this will determine what they store and what you are able to do with the data in ArcGIS Pro. As you have seen, some formats allow for the storage of multiple feature types while others only allow for one. With some formats, you can only display the data in ArcGIS Pro, and with others you can also edit the data.
Now that you are aware of some of the various data formats you might encounter while using ArcGIS Pro, it is time to start exploring how to edit your GIS data so that it stays up to date.
Editing data using ArcGIS Pro
The world is ever-changing, so your GIS needs to keep up with those changes. Whether it is splitting a parcel, adding a road, adding a new attribute field, or creating a new layer of data, it is important that your GIS data reflects the most current conditions of the real-world features it represents and meets the needs of your organization.
ArcGIS Pro contains tools that allow you to do all of this. You can add new features to an existing layer. You can modify existing features to show changes. You can create new layers and tables. In other words, ArcGIS Pro allows your GIS to grow, change, and flourish as reality changes.
In this section, we will learn the workflow required to edit data in ArcGIS Pro. You will examine the steps and some of the basic tools that are commonly used to maintain GIS data. We will start with the steps required to prepare ArcGIS Pro to edit data.
How to start editing features and attributes
To begin editing data in ArcGIS Pro is fairly easy. The first step is to open a project that contains layers that reference data that is stored in an editable format, such as a shapefile or geodatabase. From there, all you need to do is click on the Edit tab in the ribbon assuming you are using the default application editing option settings. It is that easy.
For those who have been using ArcMap, this may seem too easy. What happened to start editing? In ArcGIS Pro, you no longer need to start editing. You can immediately start editing once your project is open. This has changed somewhat with the release of ArcGIS Pro 2.6. With this release, Esri did introduce an option such that if enabled it does require you to start an editing session before you are able to make changes to your data. By default, this option is not enabled. ArcGIS Pro also does not limit you to editing data in one workspace at a time. If your map contains layers that point to data stored in a geodatabase and as shapefiles, you can edit them all at the same time. You no longer need to start and stop editing each time you need to switch between workspaces.
What is a workspace? A workspace is a location in which your data is stored. It can be a database or a folder. Hence, a geodatabase is considered a single workspace. A folder that contains shapefiles or other data files would be another workspace.
Let's now move on to learn about preparing ArcGIS Pro for editing.
Preparing ArcGIS Pro to edit data
Before you start editing your data, you need to take some time to prepare both your data and ArcGIS Pro. Generally speaking, you should take the time to do the following before you start editing:
- Ensure that all the spatial data that you plan to edit is in the same coordinate system. This avoids errors that can be the result of transformation issues.
- Add and symbolize all layers that you wish to edit to your map. The simpler you can keep the symbology for each layer in the map, the faster it will redraw as you pan and zoom during editing. Also, save the complex symbology for printing. Since ArcGIS Pro supports multiple maps in a single project, you may want to have one map that you can use to edit data and another to include in a layout for printing.
- Simplify your attribute fields so that only those you wish to edit, or that are needed to verify whether the proper features selected, and that you have, are visible. This will increase your efficiency and reduce the chance that you will mistakenly edit an attribute value that should not be changed.
- Adjust the Project Option settings for editing from the Project tab:
- Ensure that proper units are set for distance, angle, direction, and area.
- Ensure that edit option settings are set as desired, such as, allow editing to be enabled or disabled from the Edit tab, or how and when to save your edits.
- Set which layers you wish to edit in List by Edits within the Contents pane.
- Set the snapping options.
Taking the time to go through the preceding steps before editing for the first time in a project will make editing easier and reduce the chance of errors.
After you have configured your editing options, the next step to edit data is to go to the Edit tab on the ribbon.
Learning about the Edit tab
In the Edit tab, you will find many of your most commonly used editing tools. These will allow you to modify existing features or help create new features. In addition to editing spatial data, you can also edit attribute values and standalone tables.
The following screenshot shows us the visual of the Edit tab:

As you can see in the preceding screenshot, the Edit tab contains nine group tabs:
- The Clipboard group tab
- The Manage Editsgroup tab
- The Snappinggroup tab
- The Featuresgroup tab
- The Selectiongroup tab
- The Toolsgroup tab
- The Elevationgroup tab
- The Correctionsgroup tab
- The Data Reviewergroup tab
Each of these groups contains tools related to their function. For example, the Manage Edits group contains tools that allow you to save, discard, or apply topology to your edits.
Let's now look more closely at some of these groups and the tools they contain.
Clipboard group
The Clipboard group contains tools that will copy or paste to and from your computer’s clipboard. The following screenshot shows you the Clipboard group tab:
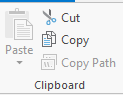
As you can see in the preceding screenshot, using these tools, you can copy features in one layer to another, or cut them from one layer and paste them into another. You can also use these tools to duplicate features in the same layer.
Manage Edits group
The Manage Edits group helps you control your edits. Here you can save your edits or discard them. If you discard edits, ArcGIS Pro will revert all your data back to the way it was prior to the last time you saved. The following screenshot shows you the Manage Edits group tab:

By default, ArcGIS Pro does not automatically save your data edits. If you want to have your data edits automatically saved, you must enable this option under your Project Editing Options. You can choose to automatically save at specific time intervals or after a number of operations. Setting up an automatic save can help ensure that you don't lose edits you have performed if your system or ArcGIS Pro were to crash.
Two things to remember when saving. First, you can only undo back to the point of your last save. Second saving data edits and saving changes to your project are two different things. To save data edits, you must either enable the autosave function or click the Save button on the Edit tab. To save changes to your project, such as the addition of a new layer or changes to symbology, you must click on the Save button in the Quick Access toolbar or from the Project tab.
From this group, you can also select any topology that you want to apply to your data when editing, and if it is a geodatabase topology, then you can also use the Error Inspector to locate topological errors in your data.
Topology is a model of how features in one or more layers of data are related to one another spatially. In ArcGIS Pro, there were two types of topology, namely, Map and geodatabase.
Geodatabase topologies allow you to assign rules to your data, such as the fact that parcels must not overlap, or a manhole must be connected to a utility line. This allows you to easily find and fix errors in your data.
A Map topology does not have rules, but does allow you to edit data so that any existing spatial relationships are maintained. If you want to learn more about topologies and how they work, you might want to look at Chapter 5 of the ArcGIS Pro 2.x Cookbook.
Snapping group
The next group is Snapping. It includes a single button with a drop-down menu that controls snapping and snapping options. Snapping allows you to easily draw features so that they maintain connections to other features on the same or a different layer while editing. From the Snapping group, you can set where you want to snap to new features or sketches to existing features.
A sketch is something you create while editing. It can represent a new feature, such as a new street centerline or parcel polygon. Sketches can also be shapes you draw to modify or reshape existing features, such as a line drawn to split a polygon. Sketches are temporary and only exist in the memory of your computer.
If the sketch represents an update or change to one of your layers, it is not committed back to your GIS data until you save your edits. Once you save your sketch, it becomes a true feature. This is why you should save often.
With Snapping enabled, you can snap to the end, edge, midpoint, intersections, and vertex of other features, as shown in the following screenshot:
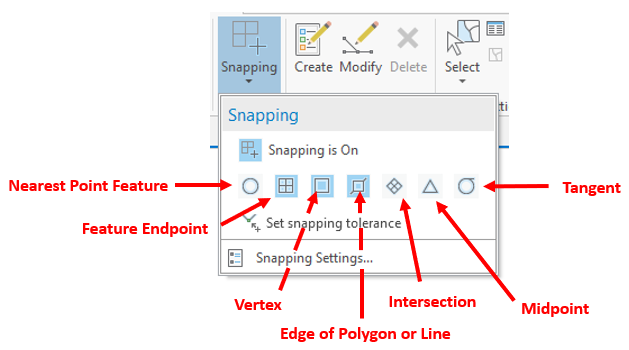
As you can see in the preceding screenshot, from the Snapping dropdown, you can also enable and disable snapping. Holding down your space bar will also temporarily disable snapping as long as it is held down.
Features group
The Features group contains tools for creating and editing features. You access the Create or Modify panes from here. You can also delete selected features or records using the Delete button, as shown in the following screenshot:
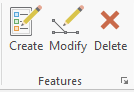
Clicking on the Create button opens the Create Features pane. The Create Features pane contains the feature templates used to create new features in your layers.
The Modify button opens the Modify pane, which includes tools for changing existing features, such as move, rotate, split, and more. Many of these same tools are also found in the Tools group. The Tools group just provides a quicker way to access them.
Selection group
The Selection group includes the tools for selecting features interactively within your map, viewing attributes, and clearing your selection. The Select tool includes five different shapes that can be drawn to select features for editing, as shown in the following screenshot:
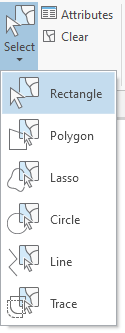
As you can see from the preceding screenshot, most of these are self-explanatory, with the exception of Lasso. The Lasso select tool allows you to draw a freeform polygon shape. The drawing follows the movement of your mouse pointer as long as you hold the left mouse button down. Releasing the mouse button completes the shape.
Now that you have learned all about the Edit tab and all its components, let's move on to the next section about creating new features as an editing task.
Creating new features
Creating a new feature is a very common editing task. It might be adding a new road, a new sewer manhole, or a new stormwater detention pond. As new things are built, we need to add them to our GIS. Creating new features requires a feature template.
Learning about feature templates
Feature templates define the properties required to create a new feature. This includes the target layer, default construction tool, default attribute values, and symbology, as you can see in the following screenshot:

The General Properties associated with a feature template allows you to define metadata for the template and indicates where the layer's new features will be inserted. This is called the target layer.
As you can see in the preceding screenshot, the Tools tab in the template properties allows you to set properties associated with editing tools you can use to create new features using the template. Here, you can select which tools users are allowed to use to create new features and which tool will be the default tool that users will automatically start with when creating a new feature.
Lastly, the Attributes tab allows you to set default attribute properties for the fields contained in the attribute table for the target layer identified on the General tab. On this tab, you can input a default value for each field, which will automatically be populated into the indicated field, and which fields are required by the user to enter a value in when creating a new feature.
These templates are tied to your map's contents. So, for each layer in your map, you will have a matching feature template. If you symbolize a layer with unique values, graduated colors, or graduated symbols, you will have a feature template for each unique symbol associated with that layer.
For example, if you symbolize a parcel layer based on its zoning classification and there are three zoning classes, namely, Residential, Commercial, and Industrial, you will have three feature templates for that layer, as illustrated in the following screenshot:

When you add a layer to your map or adjust the symbology, then your available feature templates are adjusted to match it. You can also manually create feature templates, adjust the properties of existing templates, and delete templates. This is all accomplished in the Manage Templates pane.
Now, let's move on to the exercise about creating new features.
Exercise 8A – Creating new features
In this exercise, you will update several layers based on a plat you have been given for a new subdivision that has been built in the city of Trippville. This is part of your normal duties as the city's GIS specialist. The plat is from a local surveyor and has been scanned.
Using the information shown in the plat, you will need to update the sewer system layers, road centerlines, and parcels.
Step 1 – Opening your project and preparing to edit
In this step, you will take some time to make sure everything is ready to begin editing. You will open your project to verify that the layers you need to update are editable. You will ensure there are not any warnings or messages that might cause problems while you update the data. You will also verify other editing option settings:
- Open ArcGIS Pro.
- Using the skills you have learned in previous chapters and exercises throughout the book, open Creating new features.aprx, located in C:StudentIntroArcProChapter8.
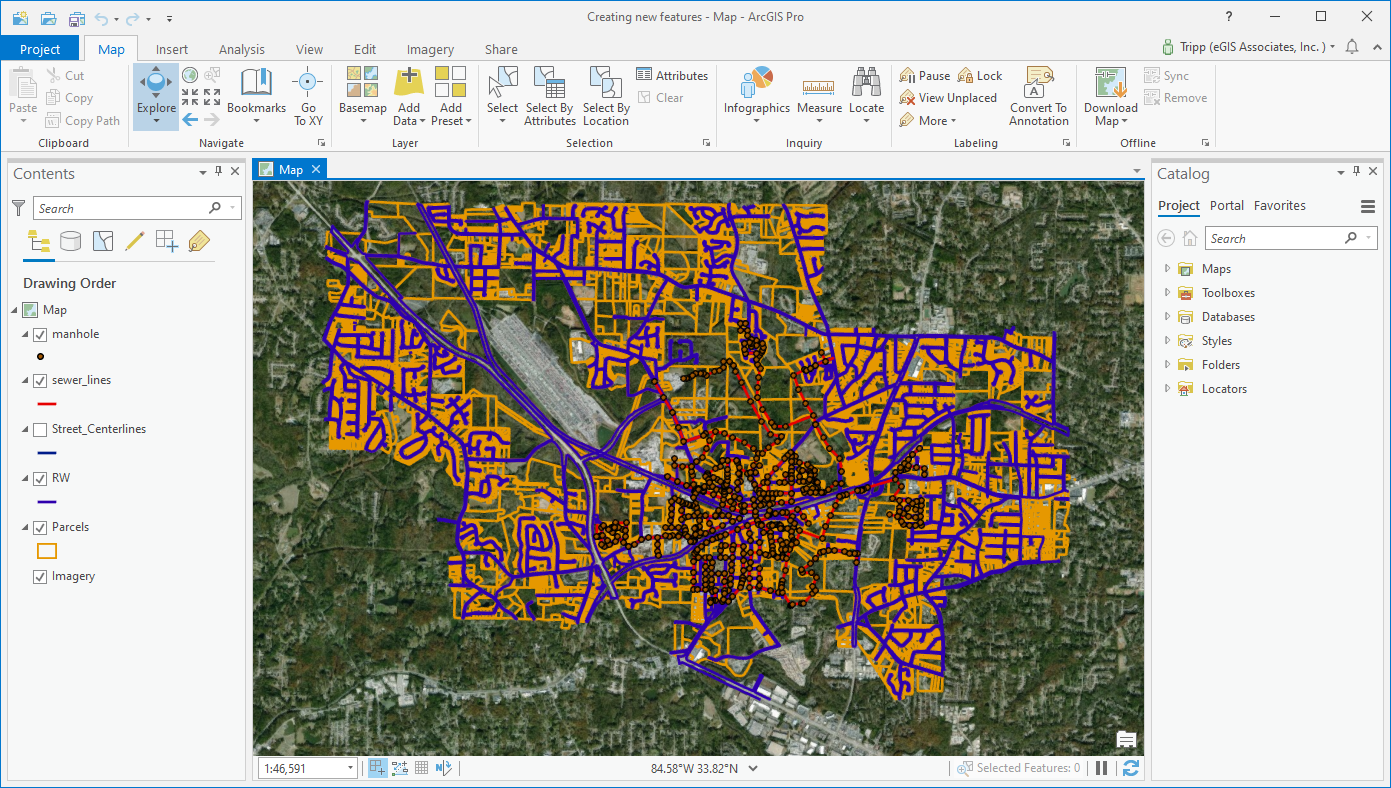
When the project opens, you should see a single map that contains the layers you will be updating. It should look very similar to the following screenshot:
Now that your project is open, you need to verify a few settings.
- Click on the List by Source button in the Contents pane to verify the location of the source data for the layers in your map.
- Right-click on the Parcels layer and select Properties.
- Select Source from the pane on the left side of the Layer Properties window.
- Scroll down in the right-side pane until you see Spatial Reference and expand it by clicking on the open arrowhead located next to it. This will show you what coordinate system this layer is in.
- Using that same method, check the remainder of the layers within the map. See that coordinate system they are in.
Now it is time to set up the symbology for the layers you will be editing.
For the most part, the current symbology will work. However, the Public Works Director wants the new sewer lines entered with the correct size and material. To make that process more efficient, it would be good to have a feature template with those default values defined ahead of time. Since feature templates are linked to the layers in your Contents pane, you will change the symbology for the sewer lines to be based on the pipe’s size and material.
Luckily there is already a layer file that has the symbology settings already defined. You will be able to import those settings from the layer file without having to configure the symbology for the sewer_lines layer from the outset.
- Select the sewer_lines layer in the Contents pane.
- Select the Appearance tab.
- Click on the Import tool located in the Drawing group tab. This will open the Geoprocessing pane on the right side of the interface.
- Click on the Browse button located at the end of Symbology Layer.
- In the Symbology Layer window, click on Folders, located in the left pane of the window.
- Double-click on the Chapter8 folder.
- Click on the Sewer Lines.lyrx file and then the OK button.
Your Geoprocessing pane should now look like this:

- Once you have verified that everything is filled out correctly, click Run.
- When the process has completed successfully, close the Geoprocessing pane.
You have just used a layer file to import predefined symbology for your sewer layer, which allows you to distinguish between each sewer pipe's size and material. If, for some reason, this did not work, you can right-click on the existing sewer layer and select Remove. Then, go to the Catalog pane and the Folders connection. In the Chapter8 folder, you can right-click on the Sewer Lines.lyrx file and choose Add to Current Map.
You are almost ready to start editing. However, there are a couple of other settings you need to check beforehand:
- Click on the Project tab in the ribbon and select Options.
- Select Units and verify that the following settings are chosen. If they are not, then select the correct units:
- In the Distance Units field, select Foot_US.
- In the Angular Units field, selectDegrees Minutes Seconds.
- In theArea Units field, select Square_Foot_US.
- In theLocation Units field, selectFoot.
- In theDirection Units field, select Quadrant Bearing.
- In all others fields, just accept assigned values.
- Select Editing in the left side panel of the Options window, as illustrated in the following screenshot:
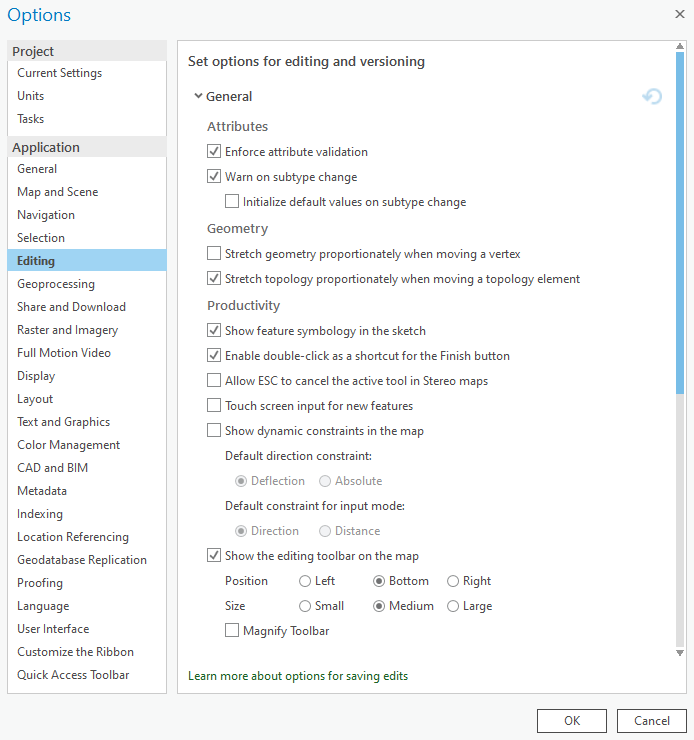
- If needed, expand the Session section in the right-side pane.
- Ensure theenable and disable editing from theEdittab is not enabled.
For those that have used the older ArcMap application, this is similar to starting and stopping an edit session. If this option is not enabled, users are able to make changes to data at any time.
- Ensure that Automatically save edits is not enabled. Since you are new to ArcGIS Pro, you don't want edits to be saved until you have verified them to be correct.
- Also, make sure Save edits when saving project is not enabled.
- Feel free to examine the other Editing options that are available. Once you are done exploring, click OK. Click on the back arrow located in the Project window to return to the main ArcGIS Pro interface.
You have one last thing to verify. You need to make sure Snapping is enabled and what will be snapped to. You also need to verify the snapping tolerance.
- Click on the Edit tab in the ribbon.
- Click on the small drop-down arrow located below Snapping.
- Select Snapping options.
- Set your x,y tolerance to 10 Map Units.
- Set your Snap tip color to Mars Red as shown in the following screenshot and click OK:

- Click on the arrow below Snapping once more. Verify what snapping position options are enabled.
You can change the snapping tolerance and snapping positions as required while you edit. As a new user, you will need to change those settings frequently as you try to find a happy medium that will work in most cases. Once you figure out what works best for you, you will not need to change the tolerance as often. The snapping positions will be changed much more frequently because they depend largely on what you are editing.
- Set your snapping positions to endpoint and edge as illustrated in the following screenshot:

- Save your project.
You are now ready to begin editing. You have taken the time to ensure that your editing environment has been set up properly.
Step 2 – Adding your source data
The surveyor has provided you with a paper copy of the plat for the new subdivision. The plat shows the layout of the parcels, streets, sewer, and water features in the new subdivision. Luckily, one of your other staff members scanned and georeferenced the scanned plat so that you can easily add it to your map:
- Click on the Map tab in the ribbon, and then select Bookmarks.
- Choose the New Subdivision 1 bookmark to zoom you to the location of the new subdivision, as illustrated in the following screenshot:

- In the Catalog pane, expand Folders and the Chapter8 connection.
- Right-click on Forrest Park Subdivision.jpg and choose Add to Current Map. Depending on your computer, it might take a moment for the file to display on your map.
Your map should now look like this. Your zoom scale and display area may be slightly different depending on the size of your monitor and its resolution:

- There is no need to have the Imagery basemap visible at this time. It will only slow you down as you pan and zoom during editing. So, turn off the Imagery layer by unchecking the box next to the layer.
You have just added the scanned plat as a layer to your map. This will allow you to use it as a guide for adding new features and updating your GIS database. This is just one example of a data source you can use. There are many other ways in which you may acquire new information to use in your GIS.
Step 3 – Drawing a new sewer line
Now that you have the plat added to your map to use as a guide, you will start drawing new features. You will start with simple lines and points that make up the sewer system:
- Zoom into the north-east corner of the new subdivision so that you can see where the new sewer line connects to the existing sewer line.
- Click on the Edit tab in the ribbon.
- Click on the Create button to open the Create Features pane on the right side of the interface.
You will now add a new sewer line and manhole by tracing the features shown in the plat. Before you do that though, you will examine a feature template.
- Right-click on the 8 inch PVC template in the Create Features pane and select Properties. This should open the Template Properties window for that template.
- Under Attributes, look at the values next to Pipe Size and Material.
- Since you are adding new pipes that were recently constructed, you will set the value for the Condition field to Good for this template. Click in the cell next to the condition and select Good from the drop-down list.
- Click OK to close the Template Properties window.
The reason you were presented with a drop-down list for the condition field is that it had a coded values domain assigned to that field. A coded values domain is a list of predefined accepted values that can be entered into a field. When editing, you can only select a value that is included in the domain. This helps increase editing efficiency and reduce errors.
Now that you have configured your feature template for the sewer lines, you are ready to begin drawing new features.
- Select the 8 inch PVC template in the Create Features pane. You know to use this template because your development ordinance requires this size and pipe material for all new residential subdivisions.
- Click on the end of the existing 8-inch ductile iron pipe near the intersection of the existing GA HWY 50 and the new Oak Place.
- Move your mouse to the manhole located to the west at the intersection of the new Oak Place and Pine Drive, as illustrated in the following screenshot, and double-click on it:

As you can see in the preceding screenshot, you have just drawn one of the new sewer lines that were constructed for the new subdivision.
Drawing the new features is only part of creating a new feature. Next, you need to update the attributes associated with the feature. The power of GIS comes from the combination of both spatial and attribute data, which allows you and others to ask your map questions and get answers. Those answers are only as good as the data. So it is just as important to keep your features attributes up to date as it is to draw them correctly.
Step 4 – Updating attributes
Now you will update the attributes for the new feature you just created. Attributes are the information about that feature. They will vary from one feature to another, and from one layer to another:
- Click on the Attribute button located on the Edit tab in the ribbon. This will open the Attributes pane in the right side of the interface.
- Notice that the values for Pipe Size, Material, and Condition have already been assigned by the template you used to draw the line.
- Click in the cell to the right of LINEID and type 1200. This field is used to identify each sewer line in the system, which can then be linked to a work order management system to track the maintenance history of each sewer line segment.
- In the Edit tab, click on the Save button to save the data edits you have made.
Challenge
Using the skills you have just learned, draw the remaining sewer lines shown on the plat for the new subdivision. Assign sequential LINEID numbers to the new pipes you draw. You will need to create individual pipe segments between each of the manholes shown on the source plat you are using to digitize the locations of the sewer lines.
Step 5 – Drawing the manholes
Now that you have drawn the sewer lines, you need to add the new manholes as well. A manhole is generally located at the end of each pipe segment:
- Select the Create Features pane using the tab at the bottom of the right-hand side pane in the ArcGIS Pro interface.
- Click on the manhole template and ensure that the Point tool is selected underneath the template name.
- Click on the west end of the first pipe that you drew in step 3 to add a new manhole.
- Click on the Attributes tab located next to the Create Features tab.
You should now see all the attribute fields associated with the manhole layer. You do not have all the information to fill out all of these as of yet. However, you can update a couple of them.
- Click in the cell next to Condition and select Good from the drop-down list.
- If you completed the Challenge section, continue to add the other manholes shown on the plat using the same process, setting the Condition for each new manhole to Good.
- Once you are done adding new manholes, turn off the Forrest Park Subdivision plat in the Contents pane to view your handy work.
If you completed the challenge and added all the new manholes, your map should now look like this:
- If you are happy with the new sewer features you have added, click on the Edit tab and the Save button in the Manage Edits group. This will save your edits back to the Trippville_GIS geodatabase.
Remember when editing that your edits are only shown on your computer and stored in the computer's memory. They are not committed to the source for the layer so others can see them until you save your edits. Up until the point when they are saved, all edits are considered a sketch.
This also means that if your computer crashes or ArcGIS Pro fails for any reason before you save, all your edits will be lost and unrecoverable. So, if you do not have the autosave function enabled, make sure to save often.
Step 6 – Adding the street centerlines
Now that you have learned how to add simple new features, it is time to do something a bit more challenging. You will add the road centerlines and rights-of-way. The first step will be to digitize the street centerlines and then use those to construct the rights-of-way:
- Turn the Forrest Park Subdivision plat back on so that it is visible once again.
- Turn off the manhole and sewer_lines layers.
- Turn on the Street_Centerlines layer.
- Zoom into the north-east corner of the new subdivision where you first started drawing the new sewer lines in the last step.
- Click on the Create Features tab in the pane on the right side of the interface.
- Select the Street_Centerlines template and ensure that the line tool underneath is active, as shown in the following screenshot:
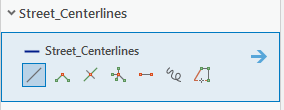
- To draw your first centerline segment, start at the point where the plat shows Oak Place intersecting GA HWY 50. Click at that intersection to start drawing your first street segment.
- Move your mouse pointer in a westerly direction toward Pine Drive, as shown on the plat. Then, right-click and select Direction/Distance from the menu that appears.
- In the DirectionandDistance window that just appeared, set the direction to S89-39-09W and the distance to 355 feet, as shown in the following screenshot, and then press the Enter key once you have typed in the required distance:
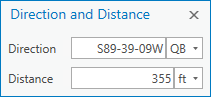
A new line segment should appear that follows the centerline of Oak Place and that ends at the intersection of Pine Drive.
- Press your F2 key to finish the sketch for the new road centerline you have drawn.
You have just drawn a new street centerline using a new method. You created this new line so that it was a set distance in length and went in a specific south-westerly direction. While that information was not apparent on the plat that you added to the map, it is typical to find that type of information on a plat or engineering design document.
Creating new features based on specific measurements allows you to create data that is much more accurate than just tracing it from a scanned document or aerial photograph.
- On the Edit tab, click on the Save button in the Manage Edits group. This will save the new street centerline you just created back to its data source.
Remember that in ArcGIS Pro, the layers in your map reference back to a data source such as a geodatabase feature class or shapefile. The map itself or project does not store the data. So, as you are creating new features, what you are seeing on your screen is just a sketch of the feature that resides in your computer's Random Access Memory (RAM).
It does not become part of your GIS data until you save the edits. So make sure to save often, especially if you have not enabled the autosave option, because if, for some reason, your system or ArcGIS Pro crashes, all unsaved edits will be lost.
- Now you will draw your next segment by once again selecting the Street_Centerlines template and then clicking on the endpoint for the segment you just completed.
- Move your mouse pointer along the road centerline shown on the plat and right-click. This time, select Distance from the menu.
- In the Distance window, enter a distance of 485.5 ft as shown in the following screenshot. This will lock the new segment you are drawing at the distance you entered, but you can still rotate freely:
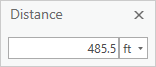
- Now rotate the new segment you are drawing so that it overlays the centerline shown in the plat. Once you get it aligned successfully, single-click to set the rotation for the segment.
- At this point, you may need to pan your map over to continue drawing the centerline. If you do, press and hold the center wheel on your mouse. Then, pan your map so you can see Oak Place past the short cul-de-sac.
- To draw the curve, you will use a new tool, the Arc Segment tool. Look toward the bottom of the ArcGIS Pro interface for this tool on the toolbar that appeared when you started drawing the new street centerline segment, as shown in the following screenshot:
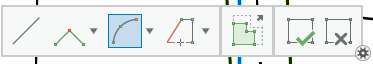
- This tool allows you to trace three points to define the arc in the centerline. Single-click just once past the O in Oak where the curve begins (Start of Arc). Then, click near the estimated middle of the curve (Middle of Arc) to define the center of the arc. Lastly, click near the estimated end of the curve (End of Arc) where the road straightens out once more to define the end of the arc. You can see this in the following screenshot:
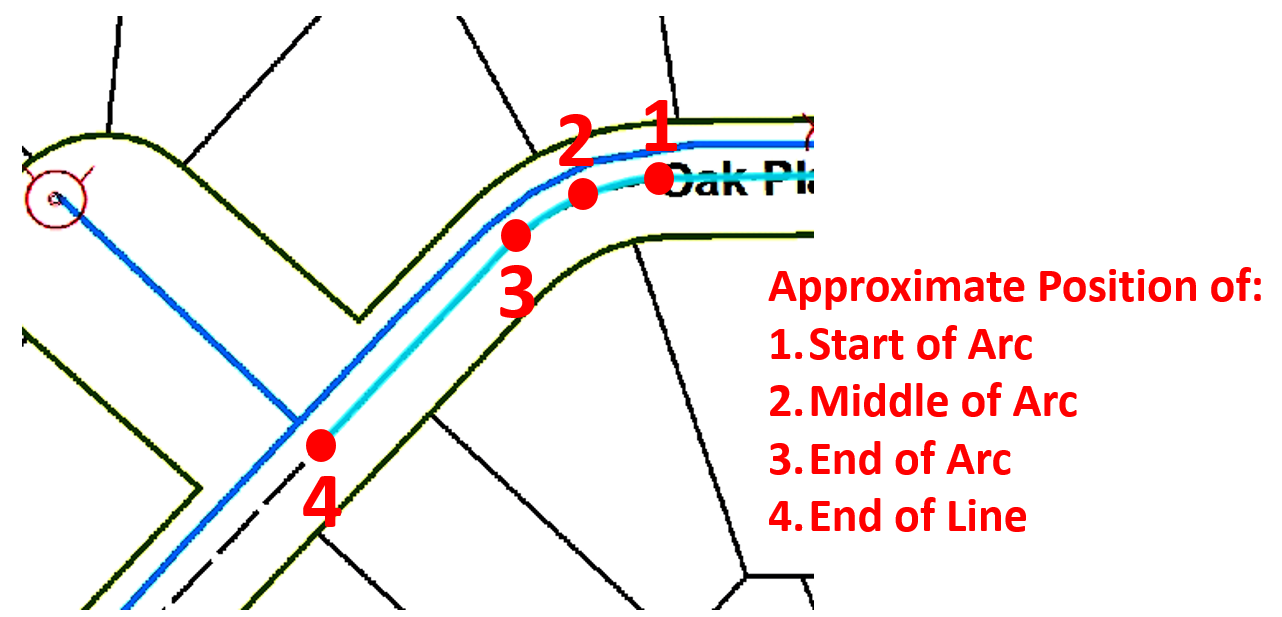
You have just drawn a curve that is embedded in the centerline for the road. This provides a truer representation of the location and geometry of the roads than digitizing a series of small straight segments would have. You still need to finish this segment.
- Click on the Line tool located on the small toolbar where you found the Arc Segment tool. This will allow you to continue drawing the segment for this portion of Oak Place.
- The segment should automatically start from the end of the arc you just drew. Move your mouse pointer to the estimated intersection of Oak Place and the small unnamed road that runs north-west and double-click to end the sketch (this endpoint is illustrated in the previous screenshot for step 18 as location 4).
- Edit the attributes for this segment the same way you did the first.
- Save your edits.
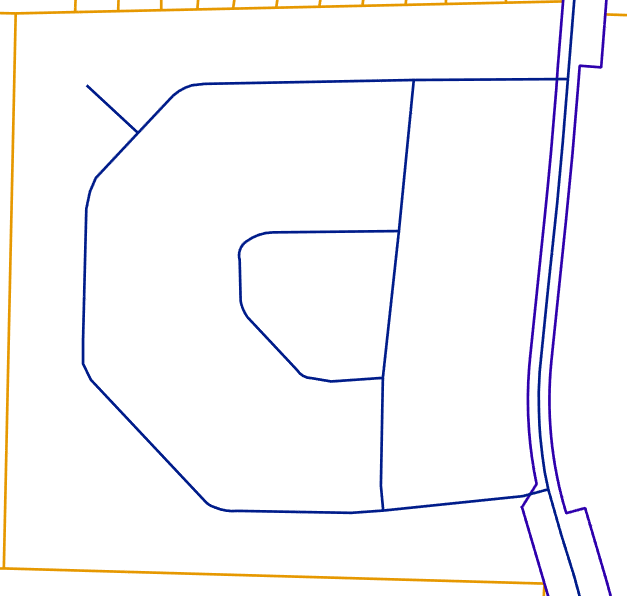
- Using the skills you have just acquired, continue drawing the remainder of the street centerlines as shown on the plat. Once completed, your map should look very similar to the following, that is, if you turn off the Forrest Park Subdivision plat:
Now to add the rights-of-way for the roads. You could do this the same way you drew the roads. However, since the rights-of-way are based on the road centerlines, it is often easier to use them as a framework to construct your centerlines.
Step 7 – Creating the street rights-of-way
You will use a couple of methods to create the rights-of-way. We will start by using the Bufferediting tool. Then, you will use the Trace tool.
First, you will create the right-of-way for Oak Place. This road has a 50 foot right-of-way, meaning the right-of-way goes 25 feet from either side of the centerline. This makes it a perfect candidate to use the Buffer editing tool.
ArcGIS Pro, like the older ArcMap application, contains multiple tools named Buffer. There is one editing tool and several geoprocessing tools in the older ArcMap application. There are two primary differences between the editing tool and the geoprocessing tools.
The first is that the editing tool will create new features only in existing layers already on the map, whereas the geoprocessing tools will create completely new layers/feature classes. The second primary difference is that the geoprocessing buffer tools only create polygon features, whereas the editing tool will create either polygons or lines depending on the target layer.
We will use the following steps to create the right-of-way for Oak Place:
- You will start by ensuring that the Street Centerlines and RW layers are selectable. You will also ensure that the RW layer is editable. In the Contents pane, click on the List by Selection button. It is the one with blue and white filled polygons.
- Make the Street Centerlines and RW layers the only selectable layers in your map. Do this by clicking on the check mark located to the left of the other layers so the mark is removed. You do not need to worry about the Forrest Park Subdivision plat or the Imagery basemap.
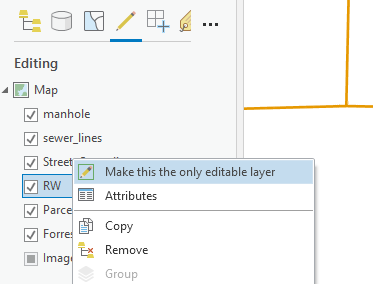
- Next, click on the List by Editing button in the Contents pane. Ensure that the RW layer is the only editable layer by right-clicking on the RW layer and selecting Make this the only editable layer, as illustrated in the following screenshot:
- Click back on the List by Selection button in the Contents pane. This will allow you to see which layers you have features selected in.
It is recommended when you are editing that you stay on List by Selection in the Contents pane so that you can make sure you know what layers you are selecting features in. Watching what you have selected will prevent you from accidentally editing or deleting features you do not intend to.
- If required, activate the Edit tab in the ribbon. Then, click on the Select tool in the Selection group.
- Select the first segment of Oak Place that you created in the north-east side of the Forrest Park subdivision.
- Next, hold down your Shift key and select the remaining segments of Oak Place, as shown in the following screenshot:

- In the Edit tab, click on the small arrow with the horizontal line above it at the end of the Tools group so that you can access all the tools in this group, shown as follows:

- Scroll down to the Construct tool group and select the Buffer tool. The Modify Features pane will open with the Buffer tool you selected.
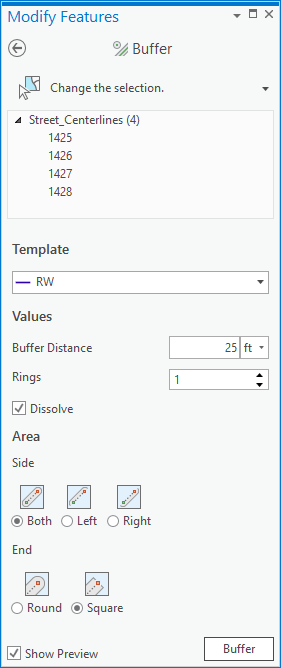
- In the Buffer tool, you should see four street centerline segments selected. Confirm that this is the case.
- Under Template, select and verify that RW is set as the target template.
This should be automatically selected if the RW layer is set as the only editable layer. If you failed to make that setting earlier, you will need to use the drop-down arrow to pick the RW layer from the list.
- Under Values in the Buffer tool, set the Buffer Distance to 25 ft and Rings to 1. Also, ensure that Dissolve is enabled. This is indicated by a checkmark in the box.
- Under Area, ensure that the Both option is selected and that End is set to Square.
- At the bottom of the Buffer tool, you should see an option to Show Preview. Check this box so that you can see the results of the tool before you actually run it.
- Confirm that your tool looks like the following screenshot and that you are happy with the preview. If this is the case, click the Buffer button to run the tool:
You have just created the rights-of-way for Oak Place. You are not done, however. You need to do a bit of cleanup where Oak Place intersects the major highway outside the subdivision.
- Using the Explore tool on the Map tab, zoom into the north-western intersection of Oak Place and the highway.
- Click on the Snapping dropdown and enable Intersectionsnapping. Now that you are zoomed in and can see better, you should notice that the new right-of-way you created is overlapping the exiting highway right-of-way. This needs to be cleaned up. Using the intersecting snapping option will help as you will soon see.
- If required, use the Select tool on the Edit tab in the Selection group to select the new right-of-way you just created. Then, hold your Shift key down and select the western right-of-way for the highway that Oak Place intersects. You should have the rights-of-way for Oak Place and the highway selected, as illustrated in the following screenshot:
- Click on the Modify button on the Edit tab in the Features group. This will open the Modify Features pane.
- Scroll down the Modify Features pane until you see the Divide group. Select the Planarize tool. This tool will split line features that are in the same layer that overlap into individual segments at each intersection. It will also delete any duplicate line segments.
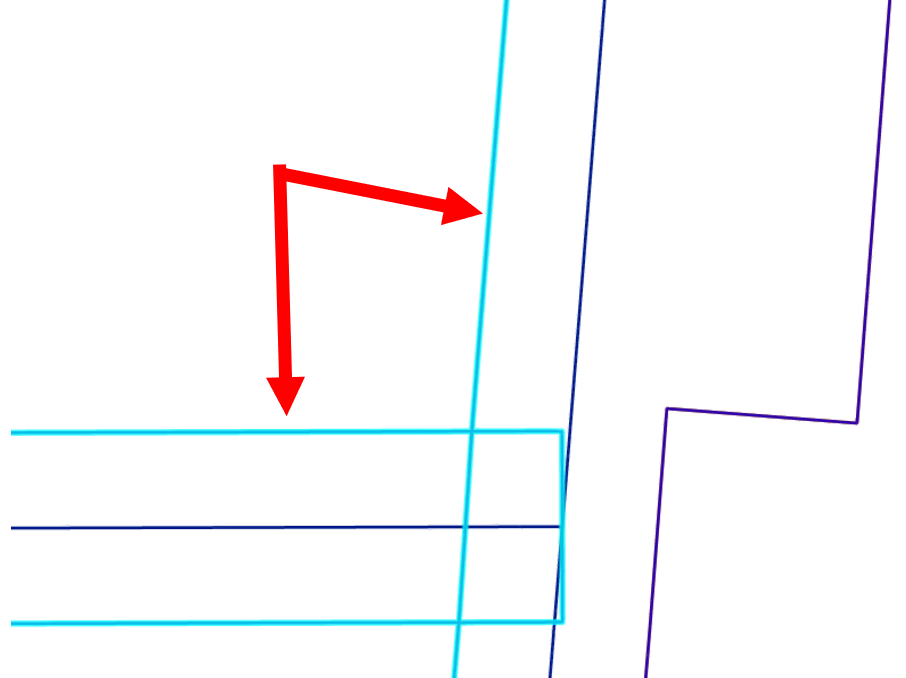
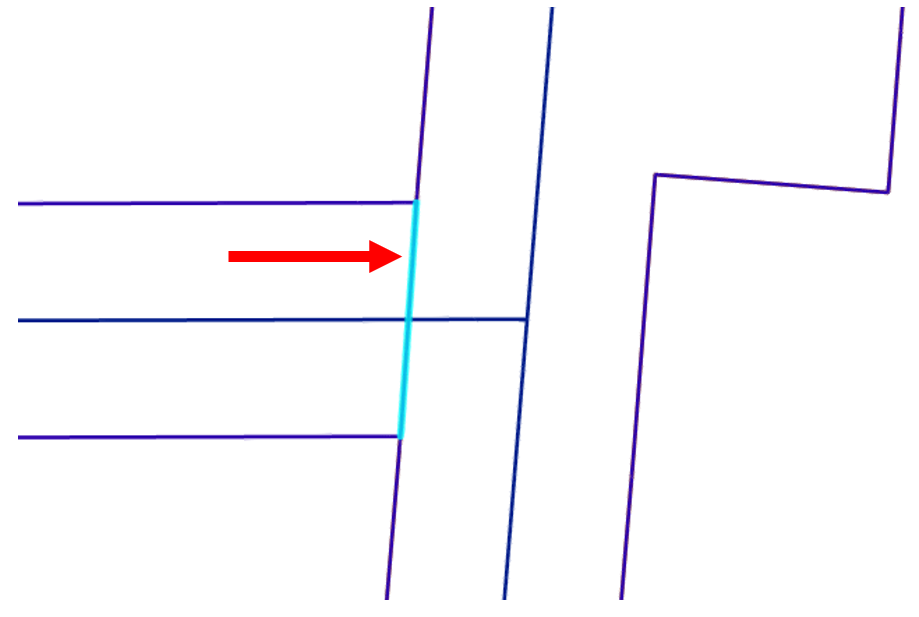
- When the tool opens, you should see the two right-of-way lines you have selected listed at the top. You will accept the default cluster value. Verify that your Planarize tool looks like the following screenshot. If it does, click on the Planarize button located at the bottom of the pane:
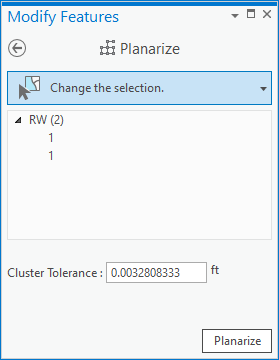
When the tool completes a successful run, you should notice that the number of features selected goes from 2 to 10. That is because this tool has split the rights-of-way for Oak Place and the Highway into multiple segments based on where they cross or intersect one another. This will make it easier to remove the parts that are not required. That is what you will do next.
- Close the Modify Features pane.
- On the Edit tab, click on the Clear button located in the Selection group to deselect all the selected features. You are about to delete the features that are not required, so you want to ensure that you do not have features you wish to keep selected.
- Use the Select tool to select the parts of the right-of-way you created that extend into the right-of-way for the Highway, as shown in the following screenshot:

- Once you confirm that you have the correct features selected, click on the Delete button located on the Edit tab in the Features group. This will remove the selected features, cleaning up the right-of-way for Oak Place so that it does not extend into the Highway right-of-way.
- Next, select the segment of the Highway right-of-way, which runs between the north and south right-of-way of Oak Place, as shown in the following screenshot:
- Once you have verified that you have the proper segment selected, click on the Delete button once again to remove the selected feature.
- Save your edits.
You have successfully cleaned up the northern intersection. Now you need to clean up the southern intersection of Oak Place and the Highway.
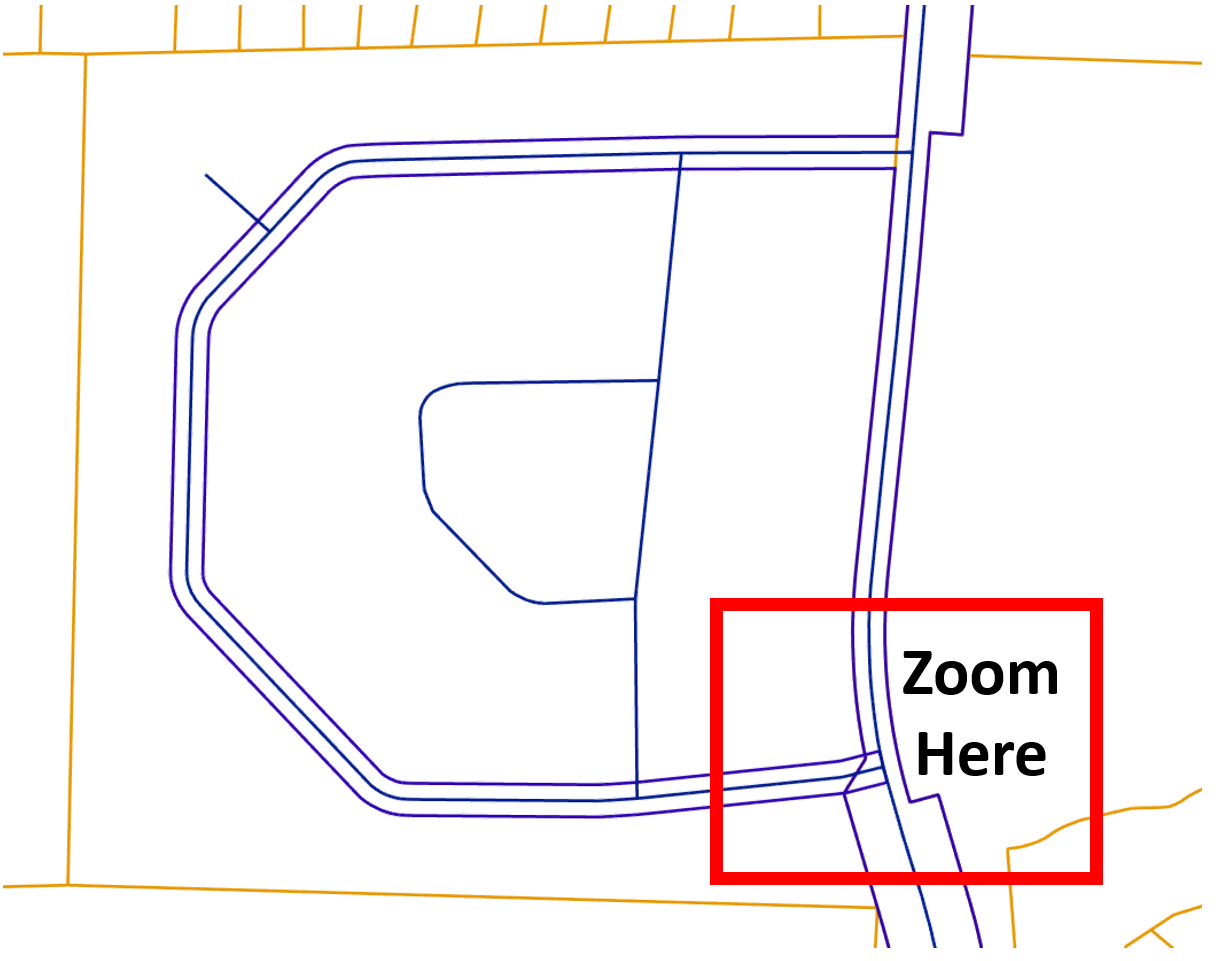
- Using the Explore tool on the Map tab, zoom to where the southern right-of-way of Oak Place intersects the highway, as shown in the following screenshot:
Luckily, the Planarize tool you used earlier already split the right-of-way lines into the necessary individual segments. So all you need to do to clean up this intersection is to delete the unwanted features.
- Select the portion of the right-of-way you created for Oak Place that extends into the highway right-of-way and press the Delete key on your keyboard. This will remove the features you do not need.
- Now, select the portion of the highway right-of-way that runs between the north and south part of the Oak Place right-of-way and press your Delete key again.
- Save your edits.
You have now created and cleaned up the rights-of-way for Oak Place. However, there are still several other roads in the new subdivision you are adding to your GIS. You will continue to add those streets using the same methods you just learned.
- Use the methods you just used to create the rights-of-way lines for Oak Place to create the new rights-of-way lines for Pine Drive and Popular Circle. They are the two streets that are located in the center of the subdivision. As illustrated in the following screenshot, the buffer distance will once again be 25 feet:
- Once you have created the new rights-of-way lines for Pine Drive and Popular Circle, use the Planarize tool to split where the rights-of-way lines intersect so that you can clean up those locations.
- Delete the overlapping portions of the rights-of-way lines as you did for Oak Place so that they look like the following screenshot:

- Save your edits.
You are almost done creating the rights-of-way for the new subdivision. There is one more small dead-end road that remains. It is located on the north-west side of the new subdivision.
- Click on the Clear button located on the Edit tab in the Selection group.
- On the Map tab, click on the Bookmark button in the Navigate group. Select the Dead End Road bookmark to zoom you to the location.
- Click on the Edit tab in the ribbon and then choose the Select tool. Select the centerline of the short dead-end road, as illustrated in the following screenshot:

- Use the Buffer tool once again on the Edit tab in the Tools group. Set the Template to RW, the buffer distance to 50 feet, and the End to round. Then click Buffer.
- Using the Planarize and Delete method you have already learned, clean up the right-of-way lines for the intersection of the dead-end road with Oak place.
- Save your edits.
You have now seen how to add new features to layers within ArcGIS Pro. If you are not continuing to the next exercise, close ArcGIS Pro and save your project when asked.
Exercise 8B – Splitting polygons
Now that you have created the road for the new subdivision, you need to split those out from the original parent parcel since the right-of-way areas have been deeded or transferred to the city of Trippville for maintenance. You also need to begin splitting out the individual new lots that make up the new subdivision as well.
Step 1 – Splitting out the rights-of-way
In this step, you will use the Split tool to cut the right-of-way area out of the original parent parcel that is being subdivided:
- If required, start ArcGIS Pro and open the Creating new features project. If you recently completed Exercise 8A, it should be in your list of recently opened projects.
- On the Map tab, click on the Bookmark button and select the New Subdivision 1 bookmark to zoom out so you see the entire new subdivision area.
- In the Contents pane, turn off the Street Centerlines layer. You may need to click back on the List by Draw Order button at the top to do this.
- In the Contents pane, click on the List by Selection button at the top. Then, set the RW layer as the only selectable layer by ensuring that it is the only one with a checkmark beside it.
- In the Contents pane, click on the List by Editing button at the top. Then, right-click on the Parcels layer and select Make this the only editable layer from the menu that appears.
- Activate the Edit tab and click on the Modify button in the Features group to open the Modify Features pane.
- Scroll down to the Divide group and select the Split tool.
- Near the top of the tool, you should see two tabs, the Interactive and By Feature tabs. Select the By Feature tab in the Split tool. When you do, two more tabs should appear in the tool, the InputFeatures, and Target Featurestabs.
When you use the Split tool with the By Feature option, Input Features are the features you wish to use in order to split the feature or features in the Target Features. Target Features are the features that you intend to split or divide.
- In Input Features, select the Select one or more points, lines or polygons option at the top. Then, create a selection box by clicking in the north-west corner of the subdivision and dragging a box to the south-east corner, as illustrated in the following screenshot:

All of the street right-of-ways you created in the previous exercise should now be selected.
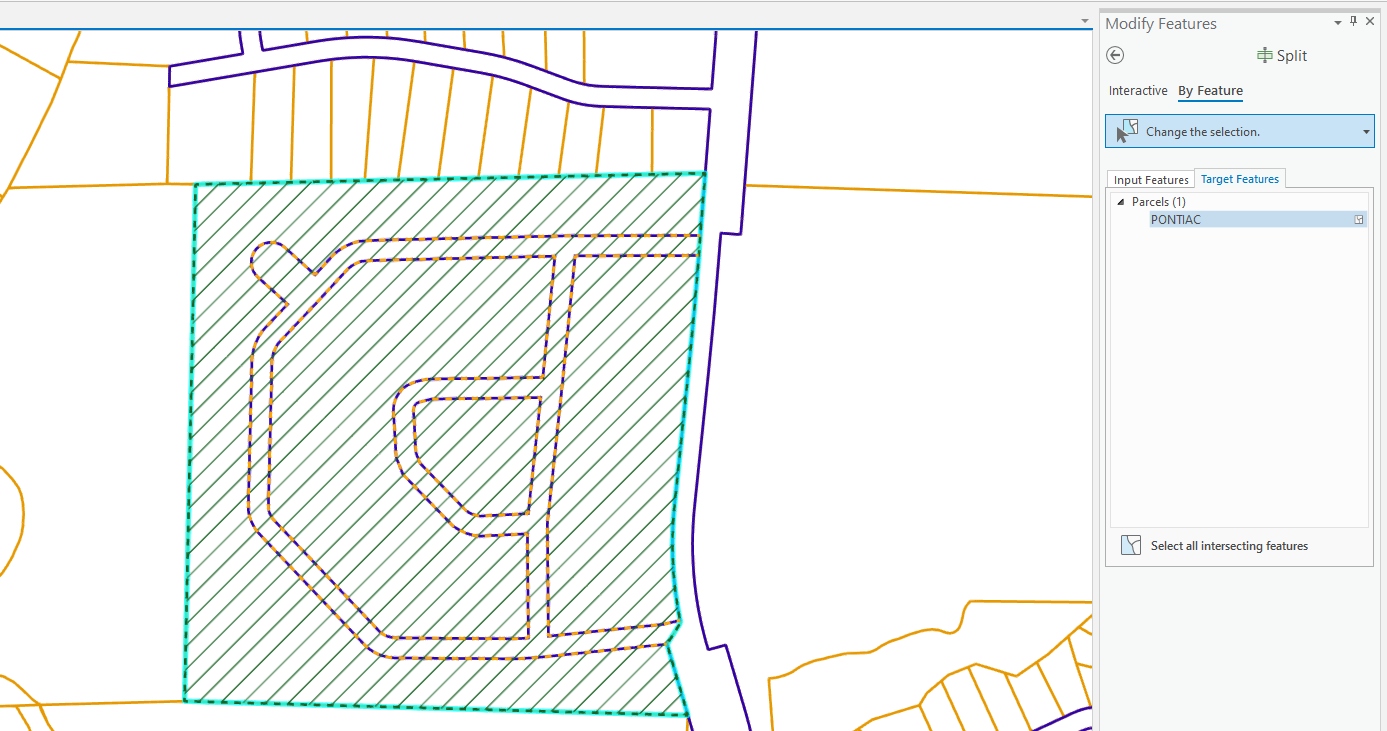
- Now, click on the Target Features tab in the Split tool. Then, click on the Select all intersectingfeatures option at the bottom. This will automatically select all editable features that the selected right-of-way lines cross or touch. Since you have set Parcels to be the only editable layer, this will only select the parcel polygon that the selected right-of-way lines are within.
- You should now have one parcel polygon selected, as illustrated in the following screenshot. If your map and tool match the image, click on the Split button in the lower-right corner of the tool:
- Once the Split tool completes, click on the List by Selection button at the top of the Contents pane. Confirm that you have five parcel polygons selected. If you do, you have successfully split the right-of-way areas from the original parent parcel.
- Clear your selection using the Clear button on the Edit tab and right-click on the Parcels layer in the Contents pane. Select Make this the only selectable layer from the menu that appears.
- On the Edit tab, click on the Select tool in the Selection group.
- Click somewhere inside the right-of-way polygon you just created on the Parcels layer when you used the Split tool.
- The city of Trippville does not maintain the right-of-way areas within its Parcels layer, so you need to delete the right-of-way area you just selected. Verify that you have the right-of-way polygon selected in the Parcels layer and click on the Delete button on the Edit tab or press your Delete key.
- In the Contents pane, select the List by Draw Order button and turn off the RW layer. You should now see new boundaries for the parcel polygon that has been split by the right-of-way lines you created.
- Clear any selected features and save your edits.
You have now successfully split the original parent parcel using the right-of-way lines you created in a previous exercise. Now you need to start splitting out the individual lots.
Step 2 – Splitting out individual lot polygons
In this step, you will start splitting out individual lots based on the Forrest Park Subdivision you referenced in an earlier exercise:
- In the Contents pane, turn on the Forrest Park Subdivision.jpg plat layer.
- Using the Explore tool on the Map tab, zoom in to the north-west corner near the intersection of Oak Place and GA HWY 50.
- In the Contents pane, verify that the Parcels layer is set to be the only editable and selectable layer by looking at the List by Editable and List by Selection buttons.
- On the Edit tab, click on the small arrow below the Snapping button. Ensure that End Point, Edge,and Vertexsnapping are enabled.
- Click on the Modify button on the Edit tab to open the Modify Features pane. Then, scroll down to the Divide group and select the Split tool.
- Click on the Select tool on the Edit tab. Then, click in the parcel polygon to the north of Oak Place, as illustrated in the following screenshot (remember that the individual black lot lines are coming from the Forrest Park subdivision plat):

- In the Split tool, in the Modify Features pane, ensure that the Split icon is highlighted and that you have one parcel selected.
- Move your mouse pointer to the north-west corner of the first new lot closest to the highway and when you see it, snap to a vertex at the location, as shown in the following screenshot. Click to start the line you are drawing in order to split the selected parcel polygon.
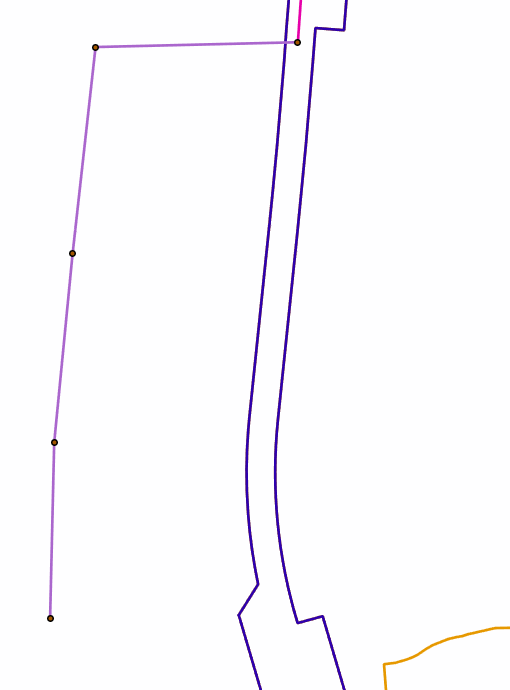
Then, trace the line shown in the Forrest Park Subdivision plat with your mouse pointer until you snap to the edge of the northern right-of-way of Oak Place, as shown in the following screenshot, and double-click:

You have just split your first lot for this subdivision by tracing the boundary from the georeferenced plat provided. This is a very common workflow and method for performing this type of work.
- Using this same method, continue splitting out a few more parcels based on the Forrest Park Subdivision plat. How many you split is up to you when you feel comfortable with the process.
- Save your edits when you are done.
- Close ArcGIS Pro and save your project when asked.
You have now created new polygon features by splitting them from existing features using a couple of methods. You have now learned to successfully edit data in ArcGIS Pro, along with the Edit tab and creating new features.
Summary
The world is not a stagnant place, so neither should your GIS be. It must be able to keep up with the changes that are happening all around us. In this chapter, you have learned that ArcGIS Pro has many powerful tools that allow you to keep your GIS current based on those changing needs and features.
You also learned how to add new features and make changes to existing features using various editing tools within ArcGIS Pro. With these new skills that you have acquired, you will be able to ensure that your GIS spatial data stays up to date.
In the next chapter, you will explore methods for updating the tabular data associated with features as well as how to make changes to the database schema and how to import data into your GIS database.
Further reading
If you would like to learn more about the concepts discussed in this chapter, you might want to check out the following resources:
- ArcGIS Pro 2.x Cookbook: Chapters 4 and 5
- Editing data with the ArcGIS Pro playlist on eGIS Associates YouTube Channel: https://www.youtube.com/user/eGISAssociates