In the previous chapter, you learned how to create new layouts for presenting and printing your maps. This is one of the primary methods that we use to share our Geographic Information System (GIS) data with others.
However, in many cases, a single large or small map will not meet the needs of the user. This can be especially true for those who work out in the field. Large maps are unwieldy and become difficult to use. Smaller maps are oftenunable to clearly display the detailed level of data required when out in the field.
A common practice to resolve these issues is to create a map book or series for the area you need to display. ArcGIS Pro has built-in functionality for creating these map books called Map Series. For those who have used the older ArcMap application, Map Series provides the same basic functionality as Data Driven Pages.
This chapter will teach you the process required to enable and configure the Map Series functionality so that you can generate your own map books. In this chapter, you will learn the following topics and skills:
- What is a map series?
- Learning about indexes
- Enabling the Map Series functionality
- Printing a map series
Technical requirements
To complete the exercises in this chapter, you will need access to an ArcGIS Pro 2.6 or higherlicense. Any of the three license levels will work, asMap Seriesis part of the core functionality of the software.
What is a map series?
In ArcGIS Pro, a map series refers to two things:
- The first is the automated functionality within the software that allows you to easily create a map book or atlas.
- The second is the result of that functionality.
So, a map book or atlas can also be called a map series. This is because it is a series of individual map pages that can be put together to form a larger map area.
In ArcGIS Pro, a single project can contain multiple map series, just like it can contain multiple maps, scenes, or layouts. As you will learn later, the Map Series functionality is linked to a layout. So, each layout, in theory, could be turned into a map series. We will look at steps to create a map series in this section.
Understanding and creating a map series
Just as creating a layout requires some forethought, so does creating a map series. You still need to consider the audience, purpose, and situation. Like a traditional layout, these three considerations will guide you to create your map series. They will help you determine which layers should be included, how much detail is needed, and what size you need to make the pages in the series, which will also impact the scale that you can use to display the data.
Once you have determined the requirements based on the audience, purpose, and situational considerations, you are ready to begin setting up your map series. This will generally consist of five steps, illustrated in the following diagram:
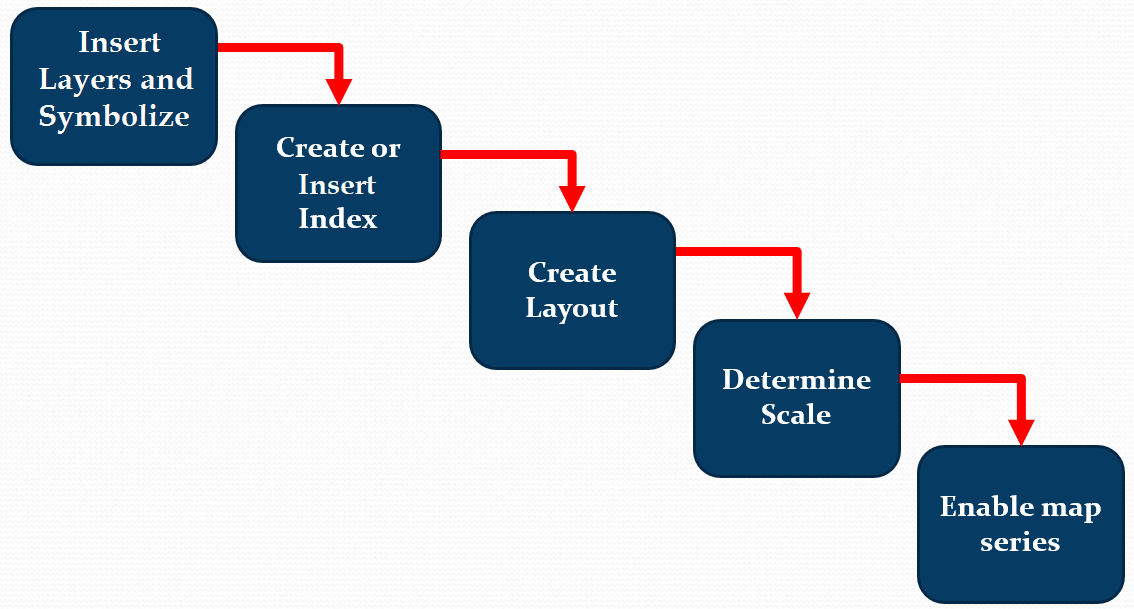
The preceding diagram illustrates the following steps to create a map series:
- The first step is to add and symbolize the layers to the map that you will be using in your map series layout. These layers will support the purpose of the map series or provide contextual information.
- The next step will be to determine what layer you want to use as the index for the map series. The index defines the location, number, and extent for each page that will be included in the series. We will discuss indexes in much greater detail later in this chapter.
- Then, you will need to start creating your layout. This will follow the same basic process that you use to create a traditional single map layout, but with a few minor differences.
The first difference is determining the page orientation and size. This determination will be based on several factors, such as whether the map series will end up being in a bound booklet or report. If so, what side will the binding be located?
Secondly, do you need to include a page or sheet number on each page in the series? Then, do you need to include a scale, north arrow, legend, or other map elements on each page that you need to make room for? These are just a few examples of the things that can impact the overall design of your layout.
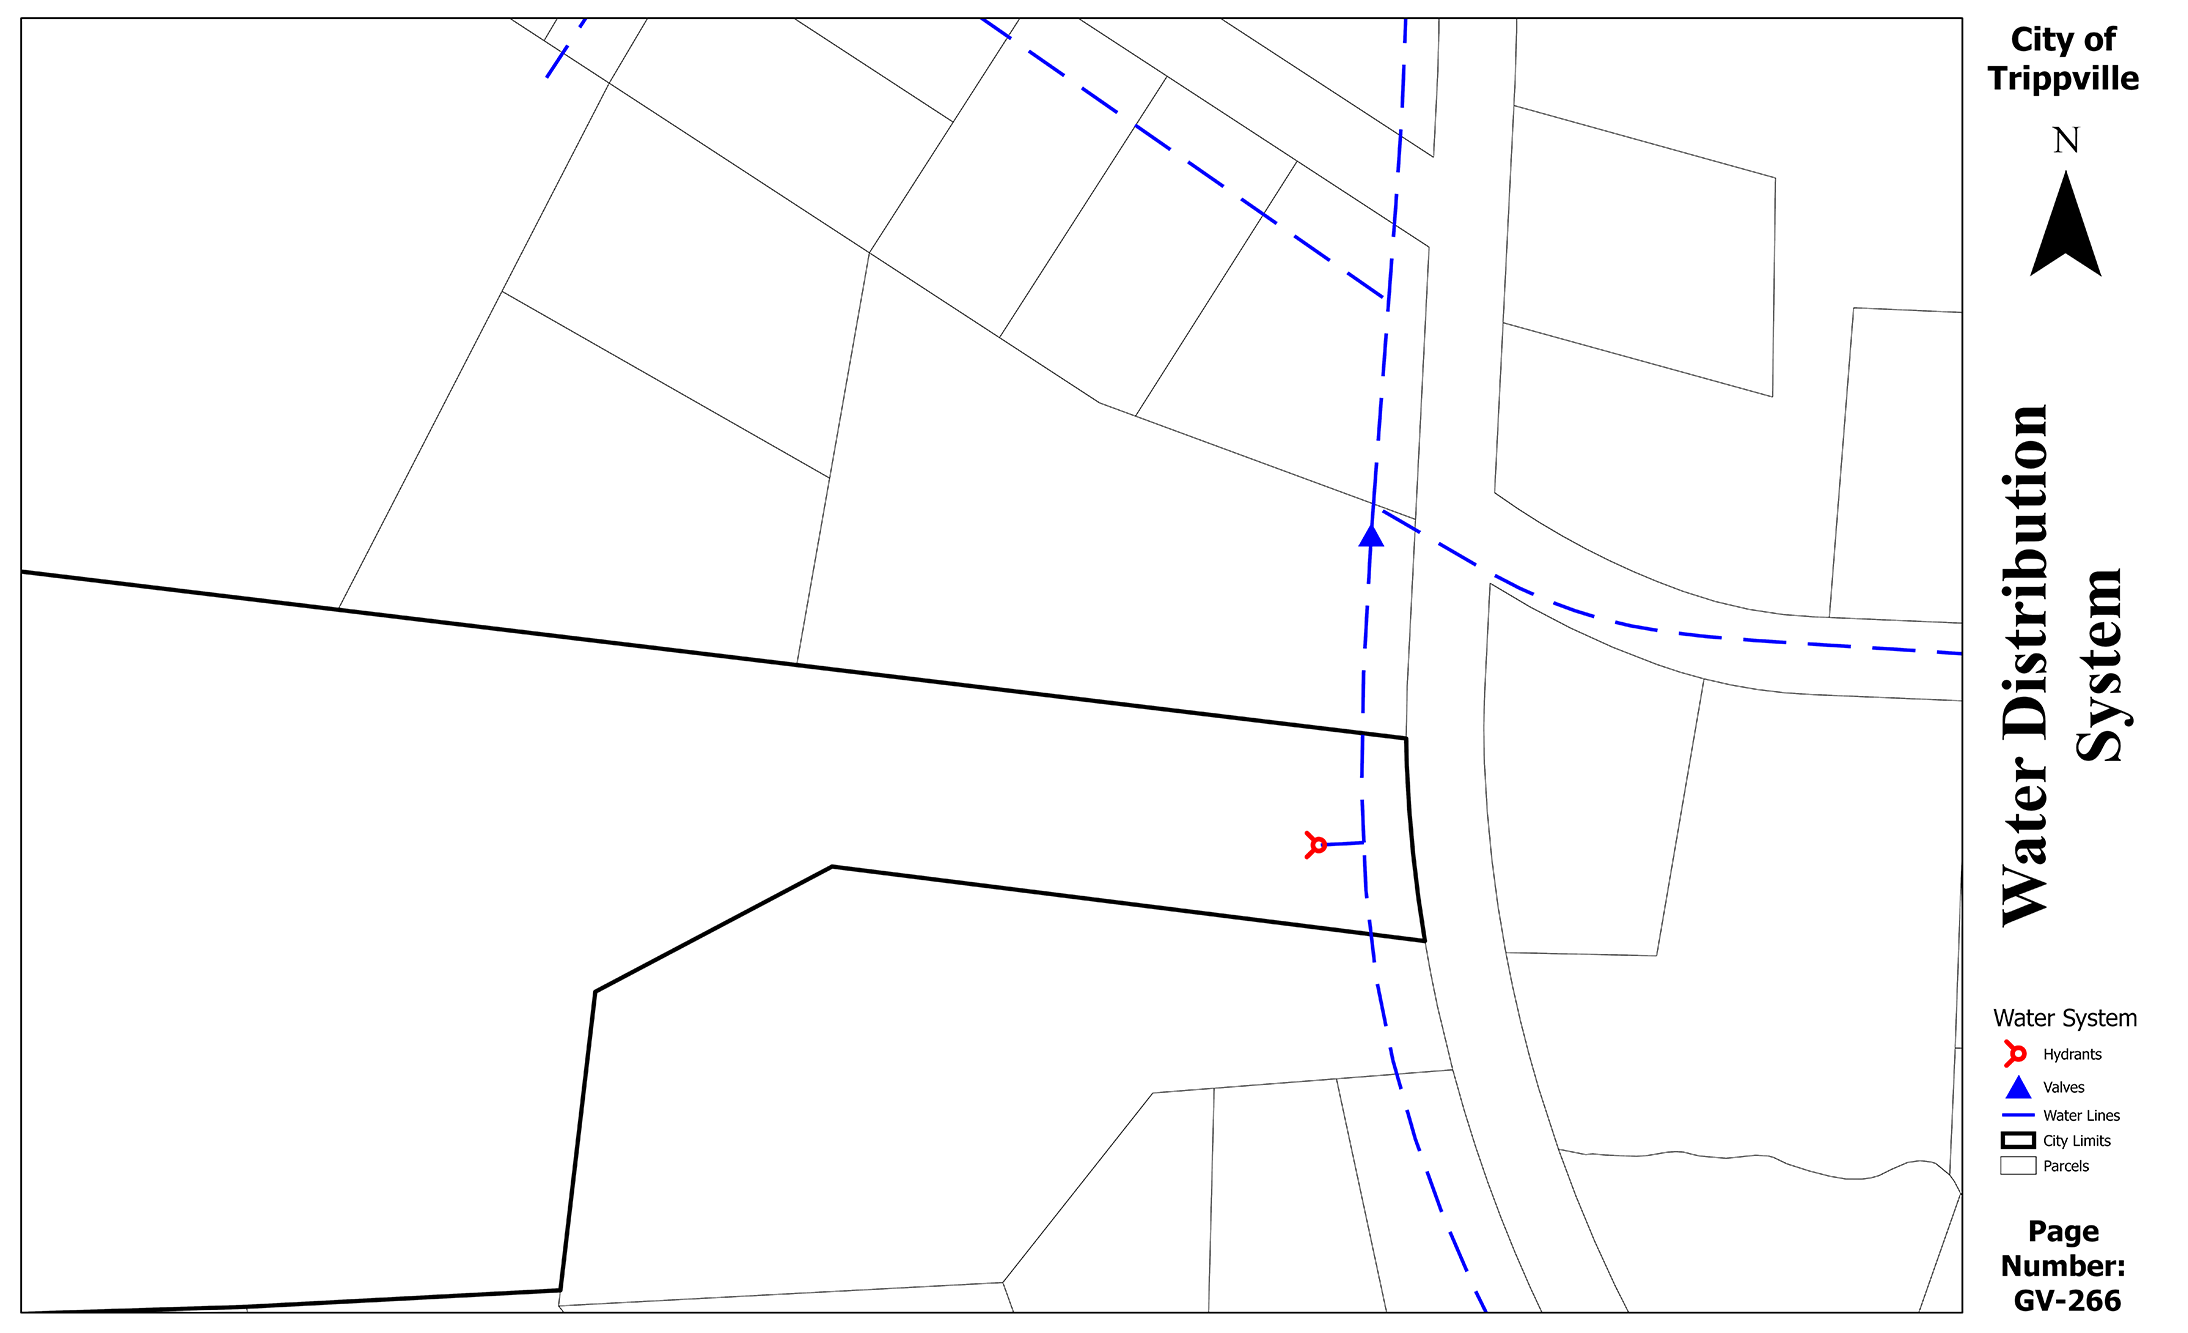
The following screenshot is an example of a map series layout:
As you are working to create your layout, and even when determining your index, you should also be considering the scale at which you want your map series to be displayed and printed. This can be a single scale for all pages in the series, or it can be variable based on your index.
- If you want the series to use a variable scale based on each index feature, you will have two options. The first will be to scale each page so that the index feature defining that page fits in the map frame area of the layout. This is the easiest method, but it means that you will not know the exact scale of each page in the series.
The second option is to use a field in the attribute table of the index layer that contains the specified scale values for each index feature. This provides you with exact scales that you know. The downside is that you must determine the scale for each individual index feature and page.
- Lastly, you will need to enable and configure the map series in your project. This starts with opening the layout that you want to use for the series. Then, click on the Layout tab in the ribbon. Next, you will need to click on the Map Series button in the Page Setup group. This will open the Layout Properties window to the Map Series tab. From there, you can configure the various settings that are presented. We will cover those settings in a later exercise in this chapter.
Now that you know the basic steps required to enable and configure a map series, we will take a deeper dive into the types of indexes you can use to define a map series.
Learning about indexes
You cannot have a map series without having an index layer. In this section, you will learn about the types of indexes you can use and how to create them.
The index determines what pages will be included in the map series and the location that they will cover. There are four types of indexes that you can use; they are as follows:
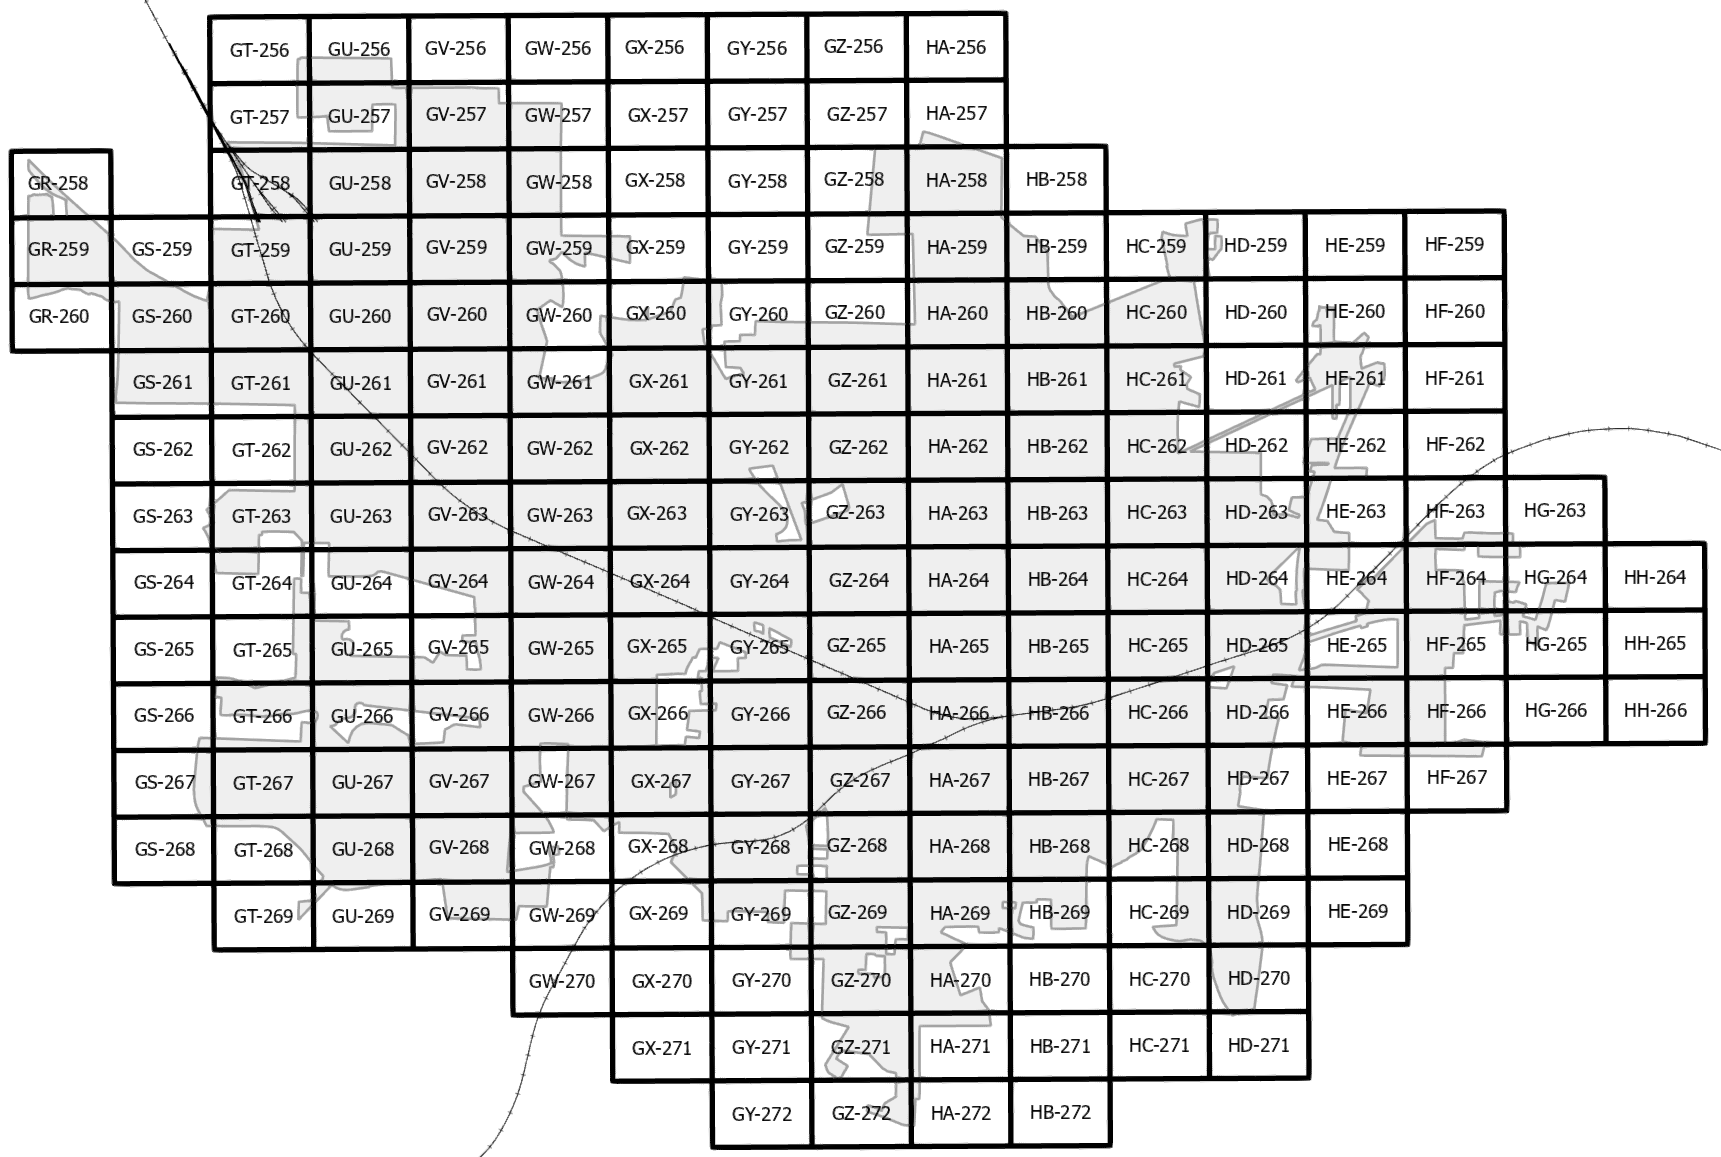
- Grid index: A grid index consists of rectangular or square polygons. They are typically identified by the rows and columns that they occupy within the grid, similar to cells in a spreadsheet. In most cases, the polygons are the same size, but they do not have to be the same size. The following screenshot illustrates an example of a grid index:
- Strip index: This follows linear features, such as road centerlines, power transmission lines, and so on. As you can see in the following screenshot, it will often have a rotation that is based on the feature that it is following. The following screenshot shows you an example of a strip index:

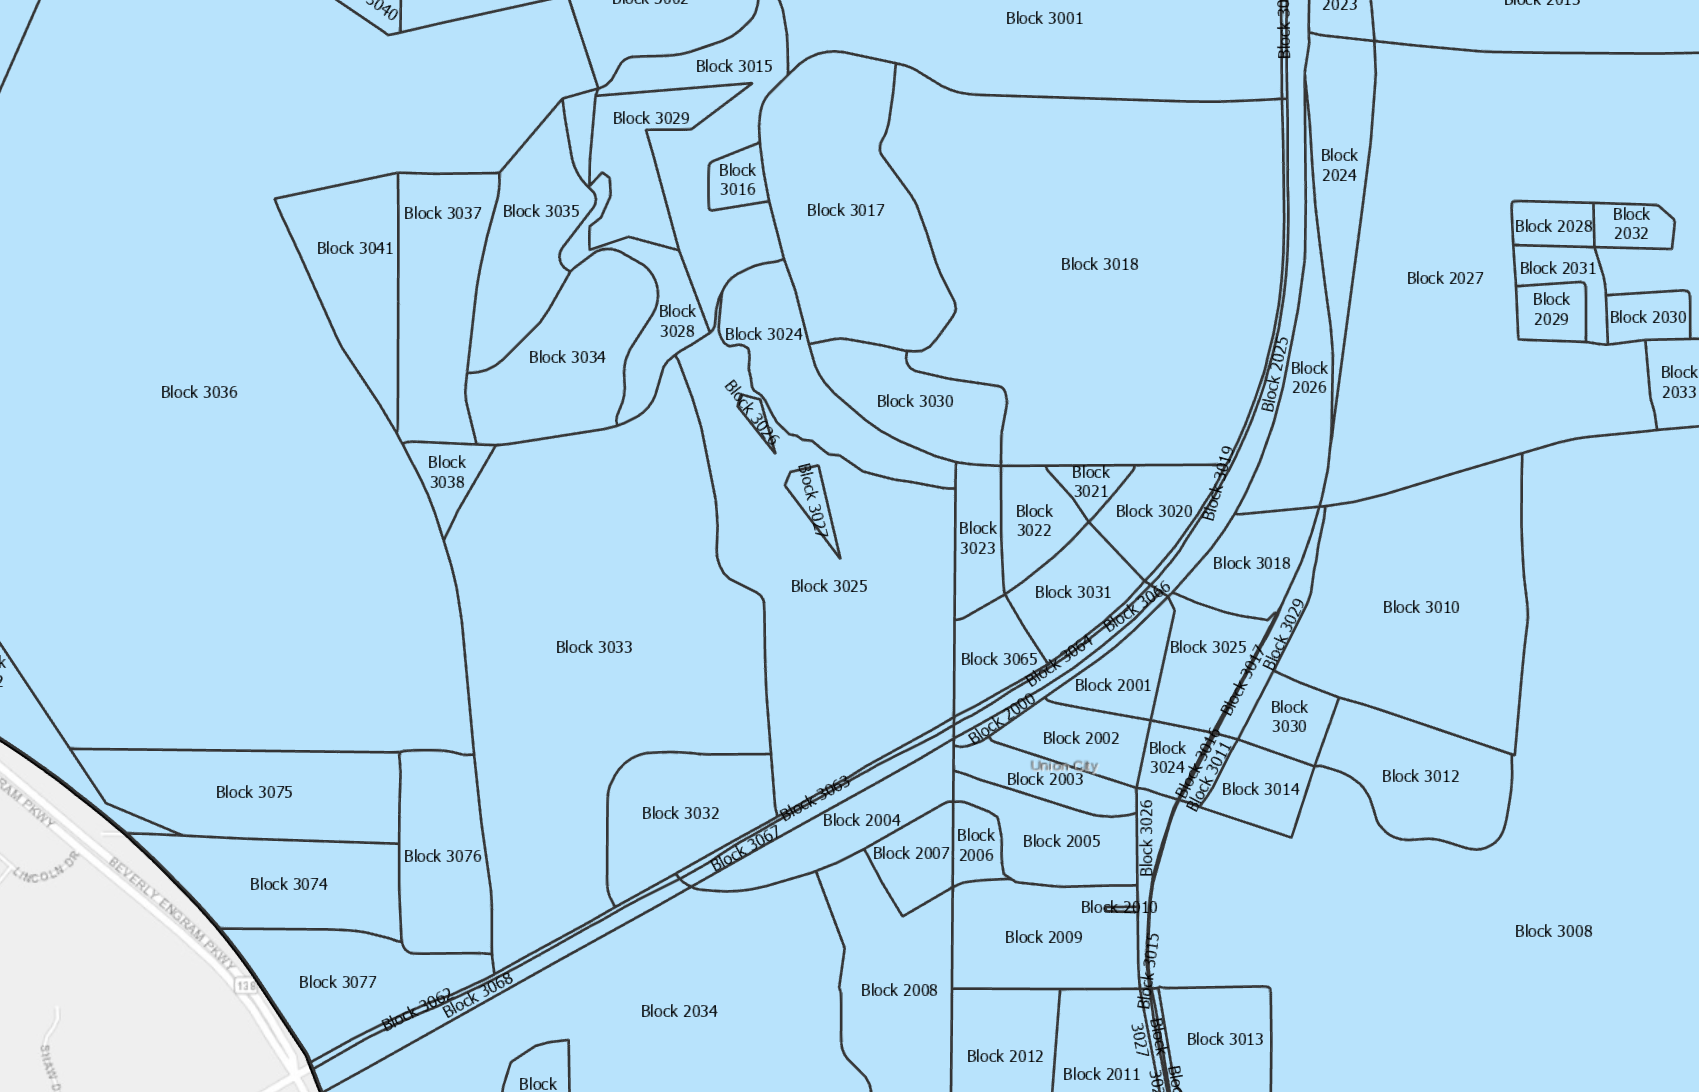
- Irregular index: The irregular index is an index based on an existing layer where every feature in the layer gets its own page in the map series. For example, in the following screenshot, we can see the census blocks within a city. If you use that as your index, then each census block becomes a page in the series. Any layer can be used as an index, regardless of its geometry type (point, line, or polygon):
If you want to create a map book that, for example, shows the location of each monitoring well at a solid waste disposal site on its own page, you can do so by using the monitoring wells as an irregular index, even though the monitoring wells are point features.
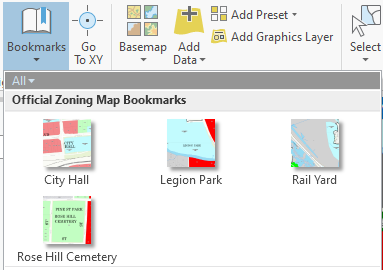
- Bookmark index: The last type of index is one which references the bookmarks which have been saved in the map. You have worked with bookmarks in previous exercises within this book. Bookmarks are saved spatial locations which allow you to quickly return to that spot in the map. Not only do they return to the same location but also to the same visible extent and scale. A map can contain multiple bookmarks, as shown in the following screenshot:
When used as an index each bookmark represents a page within the map book you are creating. This type of index was added in ArcGIS Pro 2.6. It is not available in the prior versions.
Which index works best? That will depend on the purpose of the map series. If you are attempting to highlight specific features located in a single layer, then an irregular index based on that single layer would most likely be the best option. If you are trying to create a map series for a project located along a road or utility transmission line, then a strip index would most likely be the best choice. If you are trying to create a map series that will cover the entirety of a city or utility system, then a grid index would typically be the best choice.
In the next section, you will learn about creating a grid and strip index. As mentioned, different situations will dictate which of these types of indexes is the best to use. So, it is important that you understand how to create both.
Creating grid and strip indexes
If you do not already have an index created, ArcGIS Pro does provide tools for creating grid and strip indexes. If you look in the Cartographic toolbox and the Map Series toolset, you will find those tools. We will explore two of these tools next—namely, Grid Index Features and Strip Map Index Features—in the following few sections.
Understanding the Grid Index Features tool
The Grid Index Features tool creates a polygon feature class or shapefile in a regular grid that can be used as an index to specify pages for a map series. You also have the option of creating a grid that only includes polygon features that intersect with another feature layer or layers. So, if you are creating a new grid index for your bus routes, the tool can be set to ignore any areas within your map that do not contain a bus route.
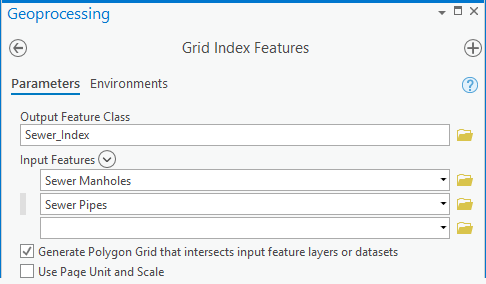
The following screenshot shows how there are several parameters that you can specify for this tool:

As you can see in the preceding screenshot, Output Feature Class is a mandatory parameter because the purpose of this tool is to create a new feature class that will serve as the index for a map series. If you only want index polygons created for areas where specific layers exist, then you will need to add those limiting layers to Input Features.
The parameters for Polygon Width, Polygon Height, Number of Rows, and Number of Columns are interrelated. These settings work to determine the size of the index polygons and their total number. If you set the width and height, ArcGIS Pro will automatically calculate the number of rows and columns.
If you set the number of rows and columns, ArcGIS Pro will automatically calculate the width and height. It calculates these values based on the full spatial extent needed to cover all the layers in the map you run the tool from, unless you specify Input Features.
Learning about the Strip Map Index Features tool
The Strip Map Index Features tool creates a polygon feature class or shapefile that follows linear features. Not only does this tool create the index polygons, but it also creates attributes that are automatically calculated. These attributes can be used to rotate and orient the map on the page with the linear feature that the index follows.
In addition, it will also generate attributes that indicate which index features are located around the various sides of the index feature. The following screenshot shows you the parameters of the Strip Map Index Features tool:

As you can see in the previous screenshot, the Strip Map Index Features tool requires you to specify both Input Line Features and Output Feature Class.
For Input Line Features, you designate a specific layer that must be a line or polyline layer or feature class. If you also select specific lines before running the tool, it will only generate index polygons along the selected lines. If you do not have any features selected in the Input Line Features-designated layer, it will create index polygons along all the lines contained in that layer.
Let's look at an exercise next for creating a grid index.
Exercise 7A – Creating a grid index
The field crews for the city of Trippville sanitary sewer system need map books to use in the field so that they know where the various components of the sewer system are located when they go out to repair or replace parts of the system. They would like you to print the pages at a scale of 1:1200, where 1 inch is equal to 100 feet. Before you can create the requested map books, you will need to create an index.
In this exercise, you will use the Grid Index Features tool to create the index you will need to create the requested map book. You will create the grid index so that it only contains index polygons for the areas within the city that contain components of the sewer system.
Step 1 – Opening ArcGIS Pro and your project
The first step is to open the project in which you will be creating the layout:
- Start ArcGIS Pro as you have done in the previous exercises. Then, click on the Open another project option, located at the bottom of the Recent Projects column in the ArcGIS Pro start page.
- In the Open Projects window in the left-hand panel, expand the Computer option and navigate to C:StudentIntroArcProChapter7.
- Then, select the Ex7A.aprx file and click the OK button.
Your project should open with a map that contains several layers, including Sewer Manholes, Sewer Pipes, City Limits, Railroads, and Parcels. It may also contain a basemap, such as topographic, depending on your organization's settings.
Step 2 – Creating the grid index
Since the project is open, it is time to create the index using the Grid Index Features tool.
Given that a sewer system consists primarily of pipes, which are linear features, you might wonder why you will be creating a grid index instead of a strip index.
The answer is that the sewer system consists of many connected pipes that are often located close together and run in multiple directions. That would make creating a strip index that is oriented to match the linear features problematic at best.
As a result, a grid index is the better choice. If, on the other hand, there were only specific parts of the sewer system that needed to be covered for a limited project, then a strip index may be better.
Now, it is time to create the index. Follow these steps:
- From the ribbon, click on the Analysis tab.
- Now, click on the Tools button, located in the Geoprocessing group, to open the Geoprocessing pane.
- Next, click on the Toolboxes tab, located at the top of the pane, so that you can see all the system toolboxes that are included in ArcGIS Pro.
- Locate and expand the Cartography Tools toolbox so that you can see its contents.
- Now, locate and expand the Map Series toolset.
- Click on the Grid Index Features tool to open it.
- Click on the Browser button to the right of the Output Feature Class cell. This will open the Output Feature Class window.
- In the left-hand panel of the window that just opened, expand the Project option, which should contain databases and folders.
- Select the Databases folder and then double-click on the Ex7A database.
- In the Name cell at the bottom of the Output Feature Class window, type Sewer_Index and click Save.
- Under the Input Features option, use the drop-down arrow to select Sewer Manholes from the list that appears. When you do this, another cell should automatically appear below the Sewer Manholes layer that you just selected.
- In the new cell that appeared under Input Features, click on the drop-down arrow and select Sewer Pipes.
- Ensure the Generate PolygonGrid that intersects input feature layers or datasets option is checked, as in the following screenshot:
The next step is to either set the polygon height and width or the number of rows and columns. Luckily for you, our city has a standard layout that it likes to use for map books.
This is an 11 inch by 17 inch sheet that has a defined map view area of 10 inches by 15 inches, which is designed to allow binding along the left side. Knowing this and the scale that the field crews need will allow you to calculate the width and height of the new index polygons and define those values here in the tool.
- Set Polygon Width to 1500 and change the units to Feet.
- Set Polygon Height to 1000 and change the units to Feet if required. Notice how the Polygon Grid Origin Coordinate, Number of Rows, and Number of Columns values are automatically calculated based on the size of the polygons that you entered. It also uses the spatial extent of the two input layers that you defined.
- Verify that your Grid Index Features tool settings look as in the following screenshot and click Run:

Once the tool runs successfully, the newly created Sewer_Index layer should appear in your map, as in the following screenshot:

As you can see, the newly created polygons do not cover the entire city. They only cover the portions that contain features in both the Sewer Manholes and Sewer Pipes layers.
- Once you have verified that the Grid Index Features tool ran successfully, close the Geoprocessing pane and save your project by clicking on the Save button on the Quick Access toolbar.
- Close ArcGIS Pro.
You have now created your index, which you will use to define the pages that will be included in the map series, which you will enable in a later exercise. Each polygon you see in the Sewer_Index layer that you created will be a page in the map series. By creating this index, you know what parameters you must provide to generate this layer using the Grid Index Features tool.
Now that you know how to create an index, it is time to see how to enable the Map Series functionality within a project and layout in ArcGIS Pro.
Enabling the Map Series functionality
The next step is to enable the Map Series functionality. You need to do this from the layout that you plan to use for the series, through the Layout tab in the ribbon or via the layout properties.
Enabling a map series is not as easy as toggling a switch or radial button. While there is a toggle switch that must be enabled, there are several parameters or settings that must be configured, as you can see in the following screenshot:

As you can see from the previous screenshot, these settings are grouped into three categories—Index Layer, Optional Fields, and Map Extent. Before you configure the settings in these three groups, you must first set the map series from None to Spatial.
To configure the Index Layer settings, follow these steps:
- You will typically start by configuring the settings for Index Layer. First, you need to select which map frame will be the primary one for the map series. From that map frame, you then choose the layer that will be used as the index.
- Next, you set which attribute field associated with the index layer to use for Name Field. This field will serve to identify the name for each page in the map series.
- The last setting you need to configure for Index Layer is Sort Field. This field will be used to place the various pages in the series into the desired order. Sort Field can be set to the same field as Name Field, or to a completely different field.
- Next, you can configure the Optional Fields settings if needed. None of these settings are required for the Map Series functionality to work, but may provide greater abilities or control for how the series will run. Some of the Optional Fields settings you can configure are shown in the following screenshot:
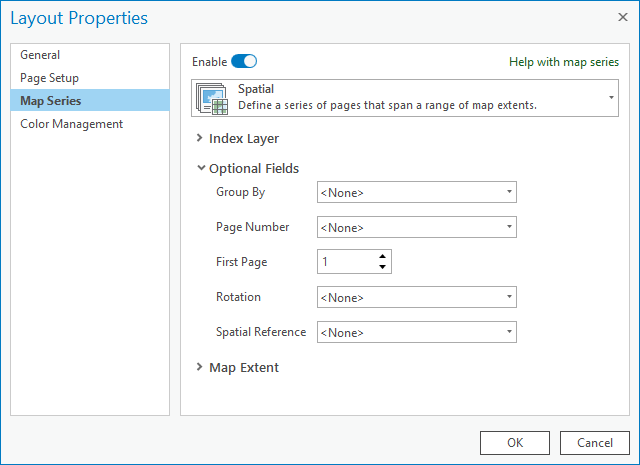
As you can see in the preceding screenshot, the Optimal Fields setting includes the following:
- Group By: This uses the values found in the specified field fromIndex Layerto group the pages in the series—for example, you may have a field that identifies delivery zones or voting districts.
- Page Number: This allows you to specify a field from Index Layerthat contains page numbers. This can be the same field used by Page NameorPage Sort, or a completely different field.
- First Page: This allows you to set the starting page number for your series. This allows you to plan for other pages, such as the title page or table of contents, to be included in your map book.
- Rotation: This allows you to specify a field that contains a rotational value, which will be used to automatically rotate the map view in the layout. This is most often used with strip indexes.
- Spatial Reference: This allows you to use different coordinate systems for the various pages in the series based on a field in Index Layer. You might want to use this setting if the area you need to cover crosses different coordinate system zones, such as from Universal Transverse Mercator (UTM) 16 to UTM 17.
- Lastly, you will need to configure your Map Extent settings. This determines the scale for the map frame that appears in your layout. The options here include the following:
- Best Fit: This option will automatically scale the map frame for each page so that the index feature fits within the bounds of the map frame. This means the scale may vary from one page to another, especially when using an irregular index that contains features of different sizes. You can control the margin size and scale rounding under this extent option.
- Center and Maintain Scale: These options will center the map view on the index feature and maintain whatever the current scale of the map frame happens to be; or, you can specify a scale to be used for all pages.
- Use Scale from Field: This option allows you to use a field in the attribute table for the index layer to control the scale of the map frame in the layout. This can be very useful if your index layer consists of features of various sizes and you want to ensure that they are displayed at specific scales instead of just being scaled so that they fit on the page.
Now, it is time for you to configure the map series for the Trippville sewer system using the index you created in Exercise 7A.
Exercise 7B – Enabling the map series
In the last exercise, you created an index for the Trippville sanitary sewer system so that you could produce a map book for the city's field crews. It is now time to put that index to use and enable the map series for the sewer system, which means you need to complete Exercise 7A before you can move to solve this one.
In this exercise, you will enable the map series using the city of Trippville standard 11 inches by 17 inches layout, which already exists in the project that you will use.
Step 1 – Opening the project and layout
In this step, you will open the project you used in Exercise 7A and the layout that you will use for the new map series that you are enabling:
- Start ArcGIS Pro as you have done in the past. Then, click on the Open another project option located at the bottom of the Recent Projects column on the ArcGIS Pro start page.
- In the Open Projects window in the left-hand panel, expand the Computer option and navigate to C:StudentIntroArcProChapter7.
- Then, select the Ex7A.aprx file and click the OK button.
- Once the project opens, expand the Layouts folder in the Catalog pane so that you can see its contents.
- Right-click on the Map Series layout in the Layouts folder and select Open from the menu that appears.
The layout should look similar to the following:

The layout should open in the primary view area.
Your scale and extent may be different, as well as the fill color for your index layer.
Now that you have the layout open, it is time to enable the map series and configure its settings.
Step 2 – Enabling and configuring the map series
In this step, you will enable the Map Series functionality in ArcGIS Pro and configure the required settings:
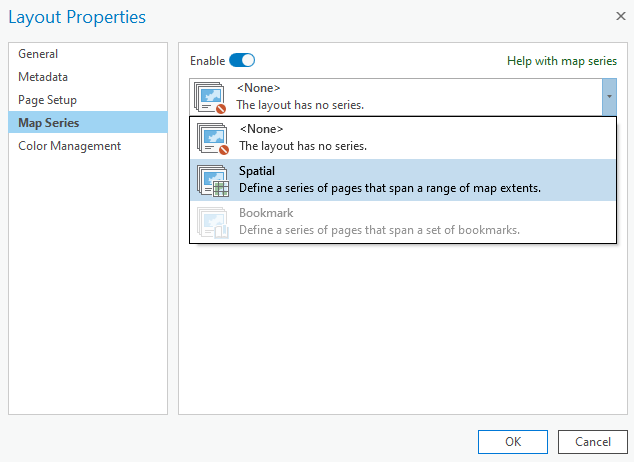
- Click on the Layout tab in the ribbon. Next, click on the Map Series button, located in the Page Setup group. This will open the Layout Properties window with the Map Series tab already selected.
- In the right panel of the Layout Properties window, click where it says None to expose a drop-down list. Select Spatial from the list, as indicated in the following screenshot:
- Under the Index Layer settings, verify the following settings:
- For the Map Frame field, select the Map Frame option.
- For the Layer field, select the Sewer_Index option.
- For the Name Field field, select the PageName option.
- For the Sort Field field, select the PageName option.
- For this map series, you do not need to configure any of the Optional Fields settings since all your index grids are the same size, have the same rotation, and do not span multiple coordinate system zones. So, you can skip them. However, feel free to expand and review them if desired.
- Click on Map Extent, located below Optional Fields, to expose those settings.
- Select the Center and Maintain Scale option. Click in the Scale box and type 1:1200. This will center each page on the index grid for that page and display it at the scale desired by the field crew.
- Once you have finished configuring the settings for the map series, click OK to finish enabling the functionality.
- Save your project.
When the map series is enabled, the Contents pane should automatically switch to List Map Series Pages. This displays a list of all the pages in your series. We will investigate how to use this list later in the exercise. Next, you need to make a small addition to your layout.
Step 3 – Adding a page name to your layout
With the map series enabled, it is time to add a page name to the layout so that as it updates to display each page in the series, the page name will update automatically. You will use Dynamic Text to do this:
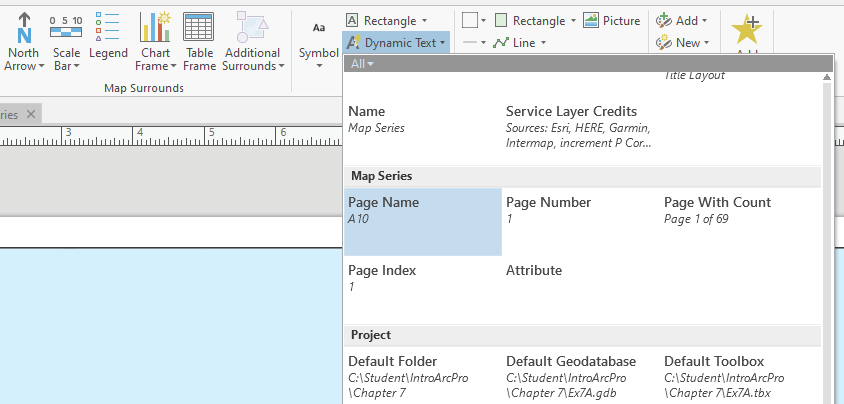
- Click on the Insert tab in the ribbon.
- Click on Dynamic Text, located in the Text group of the Insert tab. This will cause a menu of options to appear.
- Scroll down to the Map Series group in the menu. Then, select Page Name, as in the following screenshot:
- You will need to add the Page Name dynamic text to the lower-right side of the layout. So, move your mouse pointer to a point just below the lower-left side of the legend. Click and hold your mouse button down while dragging your pointer down and to the right, as shown in the following screenshot, and release it:

You have just inserted the Page Name dynamic text into the layout. This value will automatically update as you look at different pages in the series. You will get a chance to see that a bit later in this exercise. However, the text you inserted is a bit small, so next, you will need to change its size.
- Click on the Format tab that just appeared in the ribbon.
- Change the size of the text to 14 pt in the Text Symbol group of the Format tab. The font for the dynamic text that you just inserted should enlarge and should now be more readable.
- Save your project.
You have now enabled and configured a map series in the ArcGIS Pro project you have been working on. How do you know it worked?How do you view the individual pages in the series? These are great questions. So let's learn the answers in the next section.
Step 4 – Viewing pages in a series
It is now time to verify whether the series is working. You will do this by viewing several of the pages in the series, using the Contents pane to navigate through them:
- In the Contents pane, click on the List by Drawing Order button so that you can see the contents of your layout.
- Expand Map Frame by clicking on the small arrowhead to the left of it.
- Expand Sewer System Map by clicking on the small arrowhead to the left of it. You should now see the list of layers included in the map.
- Turn off the Sewer_Index layer by clicking on the checkmark located to the left of it. You should now be able to see the other map layers.
After you enable and configure the map series, you do not need to display the index layer for the map series to function. The layer must remain in the map being used, but it does not need to remain turned on.
- In the Contents pane, click on the List Map Series Pages button to see the list of pages in the series.
- Double-click on any page in the list of pages displayed in the Contents pane and watch what happens in the layout. Pay close attention to both the map view and the page name text.
- Continue to double-click on several more pages in the Contents pane and watch what happens in the layout.
- Save your project.
As you can see, when you double-click on a page in the Contents pane, the map view and the page name text automatically update to match that page. The map view zooms to the location of that grid polygon and the page name changes to match the value for that page.
Step 5 – Printing a map series
The last step when creating a map book is to print it. In this step, you will see how to print the map series you have created:
- Click on the Share tab in the ribbon.
- Next, click on the Layout button in the Print group of the Share tab. This will open the Print Layout pane.
Normally, you would select the desired printer and then configure the page. With this layout, that would mean setting the page size to Ledger (11 x 17 in) and setting the orientation to Landscape. You would then typically verify the Output Quality settings so that they match the type of printer and paper you are using.
For this exercise, however, we will assume these basic configuration steps have been done and skip straight down to the Map Series settings.
- In the Print Layout pane, scroll down to Map Series and expand it.
- Notice all the options for printing your map series. You can print All, Current, Selected, and Page Range.
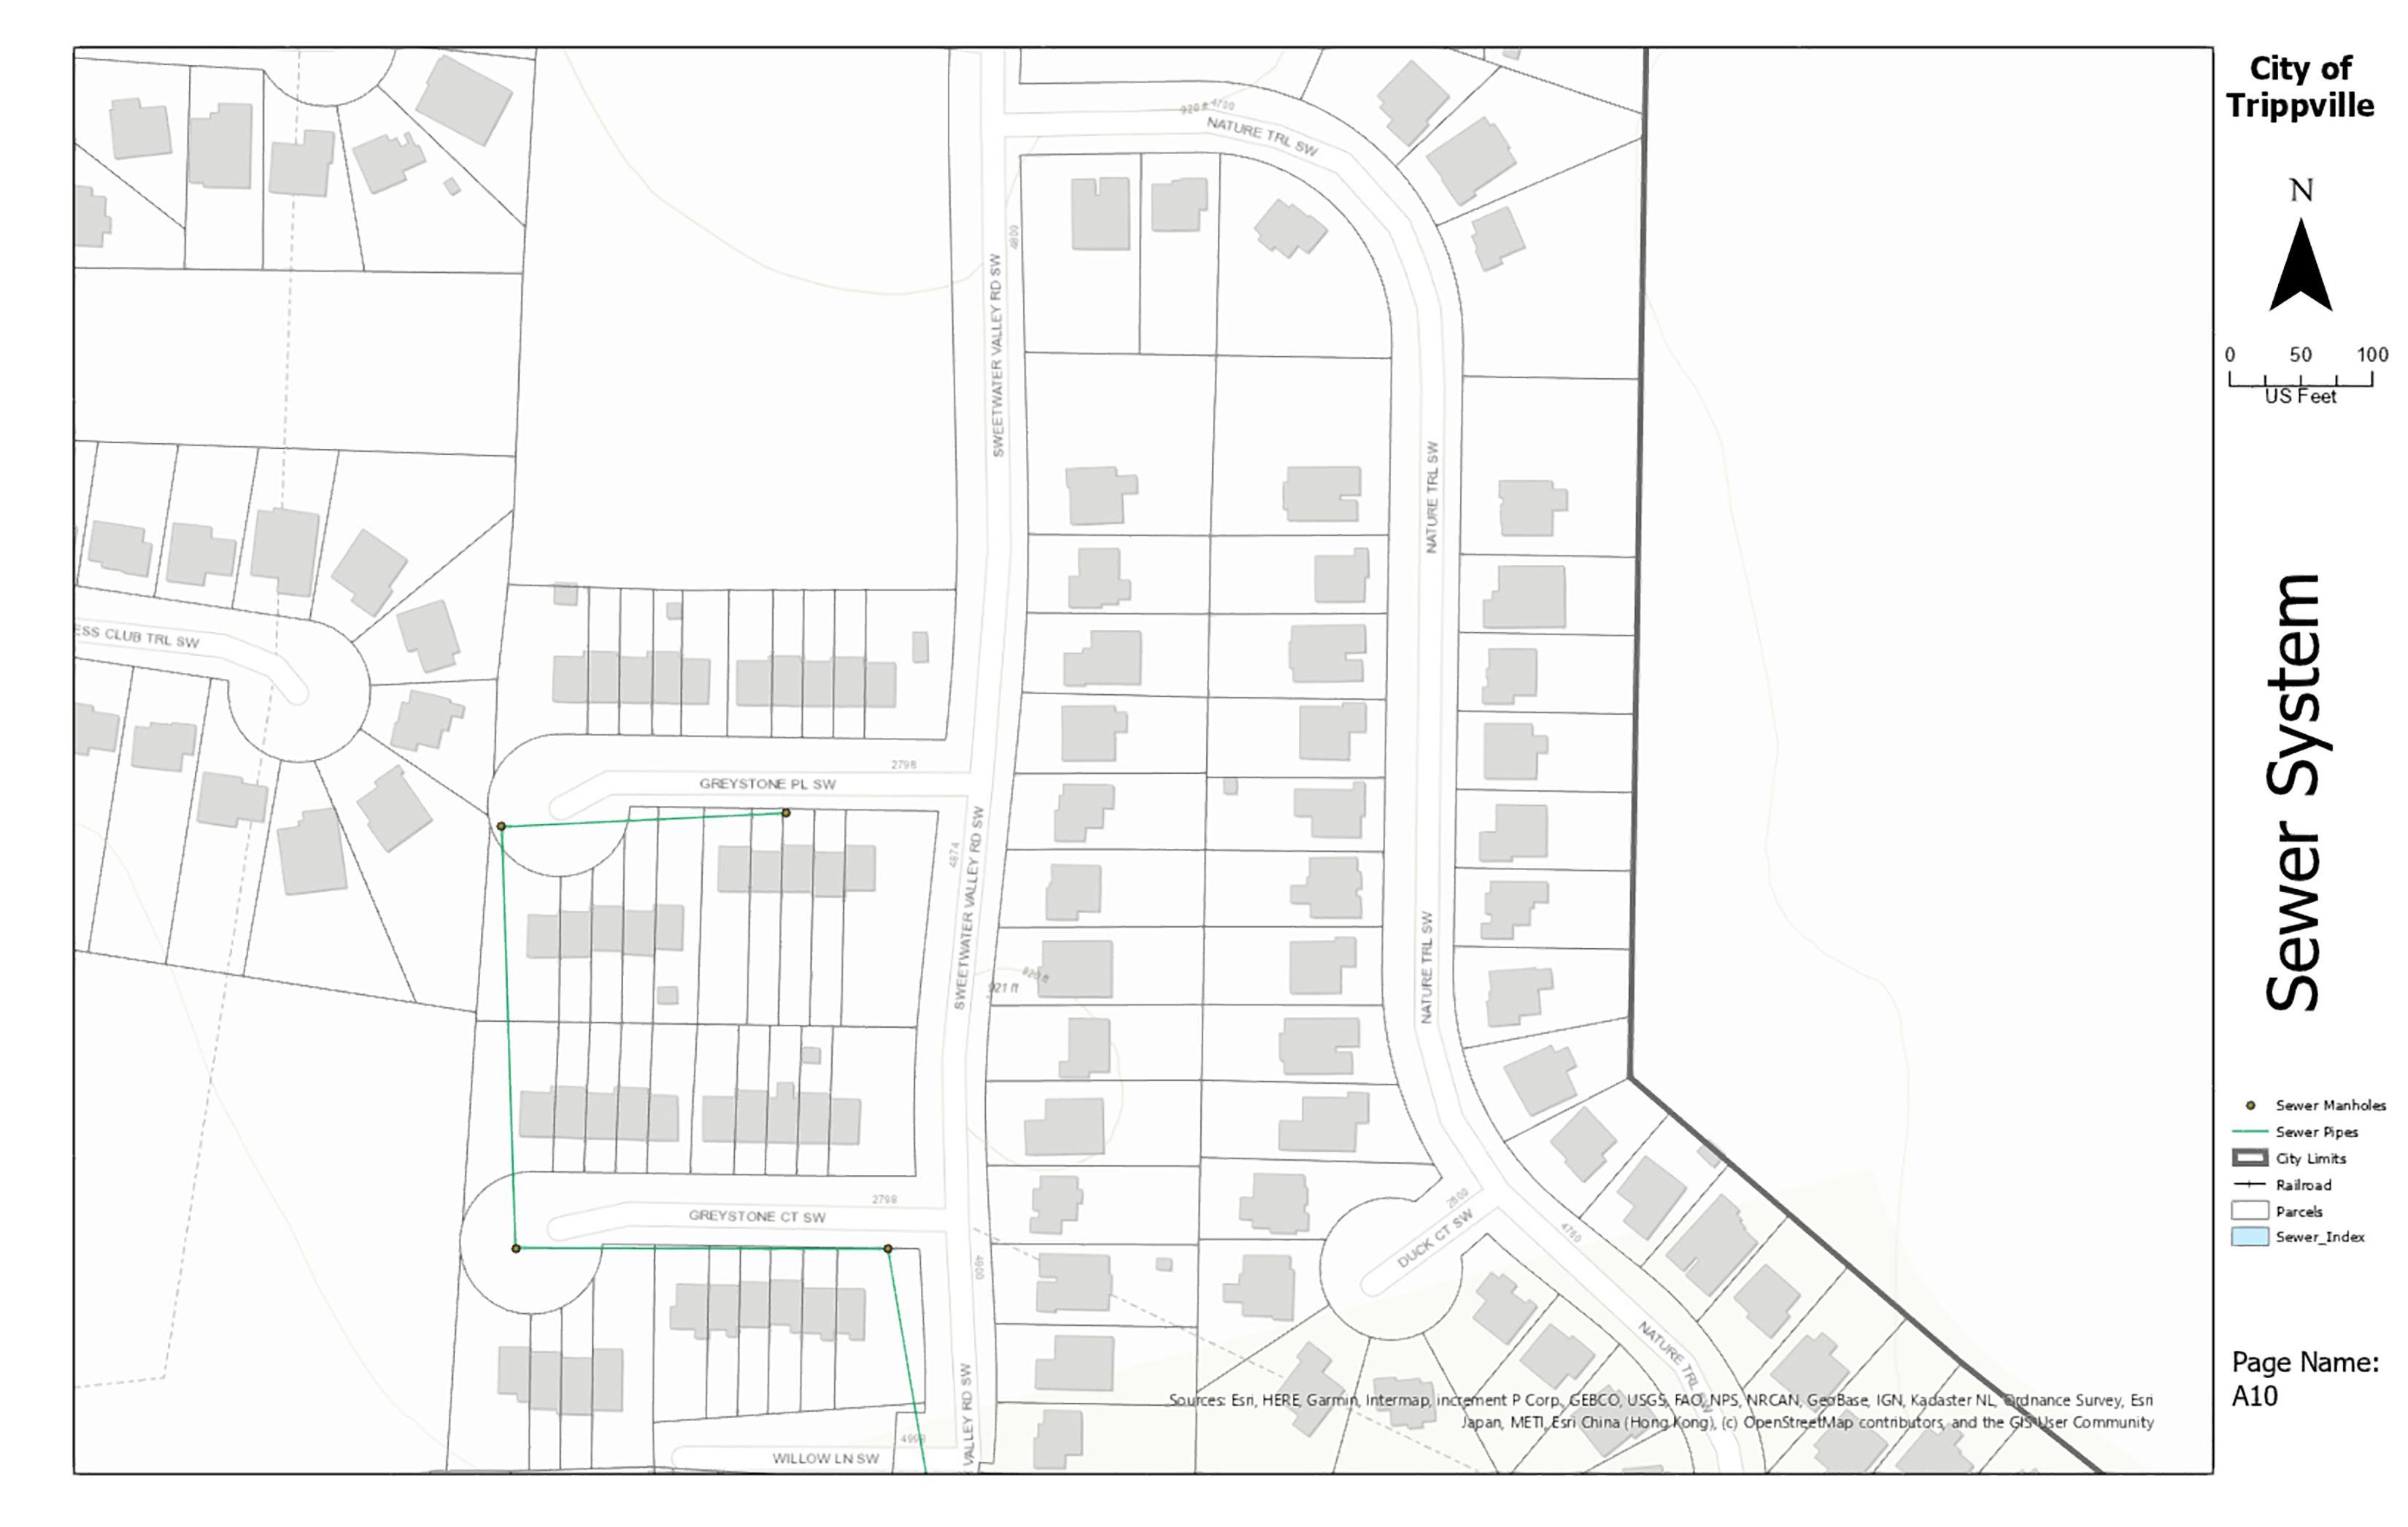
If you wanted to actually print, you would select the desired option under the map series and then click the Print button. Since we do not know what printer you have, nor do we want to waste your paper or printing supplies, you will just close the Print Layout pane without printing. However, the following screenshot illustrates how a page in the series should look if you were to print it:
- Close the Print Layout pane.
- Save your project and close ArcGIS Pro.
Now that you have completed this exercise, you know how to properly enable and configure a map series in ArcGIS Pro, as well as how to print it.
Summary
In this chapter, you learned that the Map Series functionality allows you to create a map book quickly and easily using a single map and layout in a project. You now have the skills to create a map series, which can be very helpful in the field or for use in a report.
As you learned, there are three types of indexes—namely, grid, strip, and irregular. Which one you should use depends on the purpose of the map series that you are creating. ArcGIS Pro includes geoprocessing tools for creating grid and strip indexes. These are found in the Cartography toolbox and the Map Series toolset. You can now use an index that defines the location and area for the pages that will be included in the series that you create.
In the next chapter, you will learn the basic workflow required to edit your spatial data. You will examine common workflows and methods used to update the points, lines, and polygons referenced by the layers in your map.