As the world becomes a more crowded place, the need to view data in a 3D environment grows. With the infrastructure of modern urban areas expanding both up and down as well as outward, the importance of seeing what is above and below the ground is becoming critical to planning new projects, responding to emergencies, and managing the infrastructure.
ArcGIS Pro allows users to create 3D maps or Scenes natively. In the past, this required users to have extensions such as 3D Analyst for ArcGIS. The ability to create 3D Scenes natively in ArcGIS Pro opens up a whole new world and way to view your data quite literally.
This chapter will provide you with the skills to extrude data from above or below the ground to see things such as verifying whether there is an existing natural gas line that interferes with a new sewer line that is being planned, or whether the new office building that is being constructed will obstruct the mayor's view of the park. In short, ArcGIS Pro allows you to visualize your data in the same way as it exists in the real world.
The following topics will be covered in this chapter:
- Understanding 3D Scenes
- Learning about elevations and how to use them
Technical requirements
Rendering 3D Scenes requires more computer resources than traditional 2D maps. In order to successfully complete this chapter, you will need a computer that meets or exceeds the requirements detailed in the Author system recommendations section outlined in Chapter 1, Introducing ArcGIS Pro.
If your computer only meets the minimum system specifications as listed by the Environmental Systems Research Institute (Esri), then you will have difficulty completing the exercises in this chapter.
Understanding 3D Scenes
ArcGIS Pro allows you to easily add 3D maps to your projects. 3D maps are referred to as Scenes in ArcGIS Pro. When you add a new Scene to a project, you select which type or view mode you wish to use. ArcGIS Pro supports two modes—namely, Global and Local.
A Global Scene is designed to support large areas where the curvature of the earth has a noticeable impact. This might be used to show the track of a hurricane or the path of a gas pipeline that crosses many states or countries, as illustrated in the following screenshot:
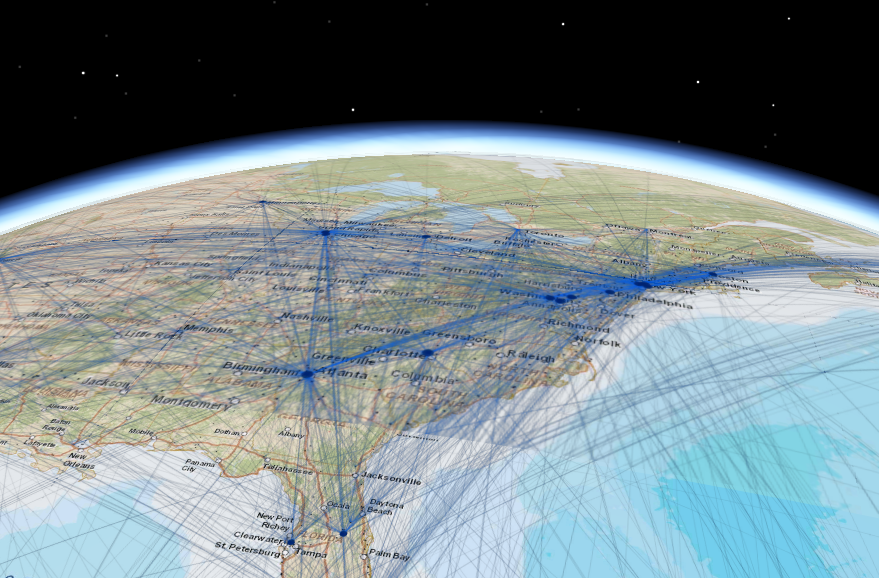
The previous screenshot is an example of a Global Scene that shows airline flight paths over the east coast of the United States. The curvature of the earth certainly has an impact on these over long distances. Because of the extent of the area covered by a Global Scene, these typically use a geographic coordinate system.
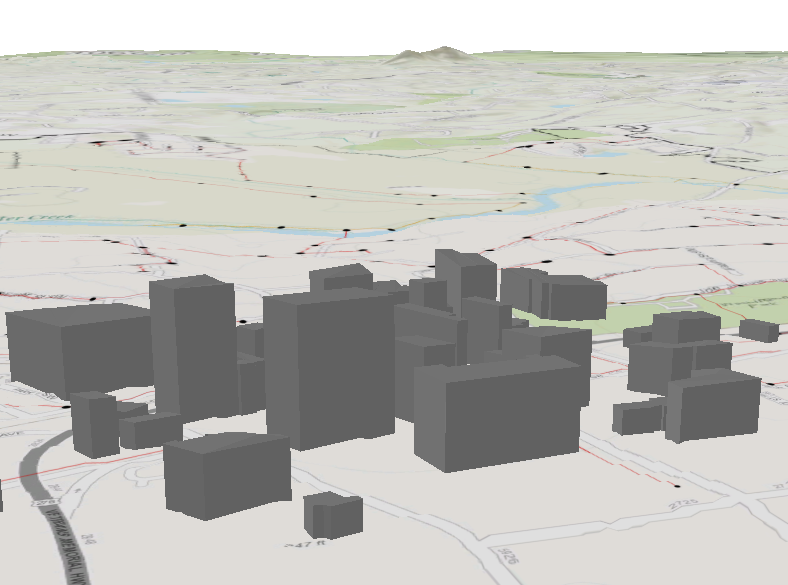
A Local Scene is designed for smaller areas where the curvature of the earth has less impact, and most often uses a projected coordinate system. A Local Scene might be used by a city to show its downtown area, by engineers planning a new road extension with a bridge, or by a cell phone company to site a new cell tower within a community.
The following screenshot shows an example of a Local Scene that depicts the buildings in a specific project area. They have been extruded vertically based on their height to create a 3D view, showing how each building is related to those surrounding it, both horizontally and vertically:
Scenes do not have to be limited to displaying infrastructure. Any data can be visualized in 3D. In the following screenshot, you can see a map showing the number of Geographic Information Systems Certified Professional (GISP) in each state in the continental United States:

From the previous screenshot, the information could have been displayed in a traditional 2D map using graduated colors. But as you can see, extruding each state vertically based on the number of GIS-certified professionals in each adds a new level to the map, which makes it very easy to see which states have the most GIS-certified professionals and which have the least.
This same type of visualization technique could be used to view the total population of an area, average rainfall amounts, median age, number of crimes, and so on with an even greater impact than when using traditional 2D maps. Scenes can be an effective way of communicating the results of your analysis or highlighting differences, in addition to displaying features in real-world views.
You will have an opportunity to put the knowledge you have just gained into practice with a hands-on exercise. The exercise that follows will have you create a simple Scene in ArcGIS Pro.
Exercise 4A – Creating a simple 3D Scene
In this exercise, you will create a simple 3D Scene using an Esri project template. You will add and extrude a layer so that it has a height above the ground level. To accomplish this, you will start by creating a new project that will contain a new Scene. You will then add both 2D and 3D layers to the Scene. Once you have done that, you will extrude the 3D layers so that they appear to rise above the ground.
Step 1 – Creating a project and 3D Scene
In this step, you will create a new project using one of the templates included with ArcGIS Pro. This template will include a Local 3D Scene automatically. To create the project and the 3D Scene, we will use the following steps:
- Open ArcGIS Pro.
- In the ArcGIS Pro Start window, select the Local Scene template located in the New column, as illustrated in the following screenshot. This will create a new project that contains a single Local 3D Scene:

- Name your new project %your name%Ex4A (for example, TrippEx4A) and set the location to C:StudentIntroArcProMy Projects, then click OK.
Your new project should open with a Scene already created. The Scene will be empty, with the exception of a basemap. In your Contents pane, you should see two categories—that is, 2D Layers and 3D Layers. 2D layers are draped across your ground elevation surface. 3D layers may be extruded above—or possibly below—the ground surface.
In the next step, you will add a layer and make it 3D.
Step 2 – Adding a layer
In this step, you will add several layers to your map. Some layers will remain 2D layers and will serve as a general backdrop. You will make the Building layer 3D and extrude it to show the height of the buildings by following these steps:
- Make the Map tab active in the ribbon and select Add Data.
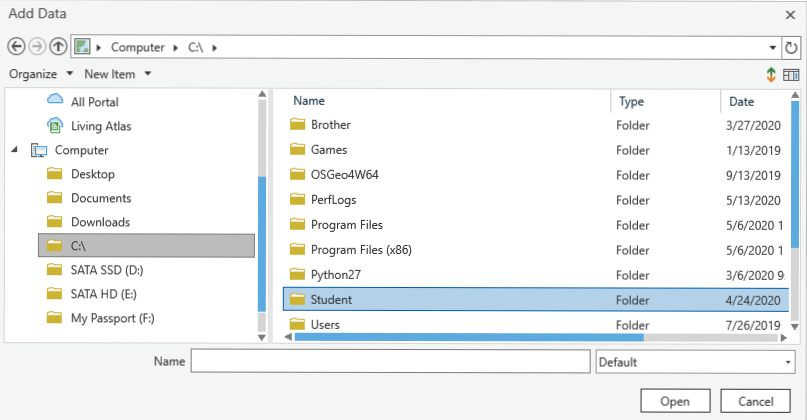
- In the tree located in the left panel of the Add Data window, expand Computer.
- Then, select the C: drive in that same pane, as illustrated in the following screenshot:
- After that, double-click on Student | IntroArcPro | Databases.
- Then, double-click on the UnionCity geodatabase.
- While holding your Ctrl key down, select the following feature classes:
- Census_Blocks
- CityLimits
- Railroad
- StreetRW
- Click on the OK button once you are done. The new layers are added to your Scene, and ArcGIS Pro automatically zooms you to the extent of the new layers that you have added.
- Adjust the draw order of your layers in the Contents pane by dragging them into the following order:
- City Limits
- Railroad
- Street Rights-of-Way
- Census Blocks
When complete, your Contentspane should look like the following screenshot:

- Using the skills that you have learned so far, set the symbology for the layers (that you can see on your screen) you just added to the following settings:
- For the City Limits layer, proceed as follows:
- Select No Color for the Color property.
- Select Black for the Outline Colorproperty.
- Set 3 pt for the Outline Widthproperty.
- For the Railroad layer, proceed as follows:
- Select the Railroad symbol from the Gallery.
- For the Street Rights-of-Way layer, proceed as follows:
- Select Black for the Colorproperty.
- Set 1 pt for the Line Widthproperty.
- For the Census Blocks layer, there is no change for now.
- For the City Limits layer, proceed as follows:
Your Scene should now look very similar to the following screenshot:

- Finally, save your project.
When working in ArcGIS Pro, it is always a good idea to save your project regularly. This is certainly true when working in a Scene. Scenes take a lot of computer resources to render. This makes them more prone to issues, especially if your computer is on the lower end of hardware requirement specifications. Saving often means you will have to do less repetitive work if the application crashes.
You have added several layers to your Scene, but so far, they are all 2D. In the next step, you will take one of the 2D layers and make it a 3D one.
Step 3 – Making a 3D layer
In this step, you will turn the Census Blocks layer from a 2D layer into a 3D layer. You will extrude the height of each block polygon based on an attribute field, to show the total population in each. You will do this by following the next steps:
- In the Contents pane, select the Census Blocks layer. Then, drag and drop it from the 2D Layers category to the 3D Layers category.
When you do this, you may notice that parts of the Census Block outlines disappear. This is because some of the features contained in the 3D layer are now below the elevation surface.
- Make sure you still have the Census Blocks layer selected, then click on the Appearance tab on the Feature Layer contextual tab.
- In the Extrusion group tab, click on the small drop-down arrow below Type and select Base Height, as illustrated in the following screenshot:

From the previous screenshot, you can see that extruding a layer allows it to be displayed in 3D. It sets the method that ArcGIS Pro will use to determine the height of features and how to display the height. The Base Height option will add the value of a specified field to each vertex of a feather to create the 3D view. There are four types of extrusion you can choose from in ArcGIS Pro. You will learn more about those later.
- In the Field cell, click on the small drop-down arrow and select Total Population from the list of fields populated from the attribute table associated with the Census Blocks layer.
- Then, set the Units to Feet. This means that it will extrude each polygon to a height equal to the total population values in feet.
TheCensus Blockslayer should now appear to have some depth because it now has the height displayed for each feature. You will now verify that this is the case.
- After that, right-click on the Census Blocks layer and select Zoom to Layer from the menu that appears, as shown in the following screenshot:

- If necessary, activate the Map tab in the ribbon, then select the Explore tool so that you can navigate in the Scene.
- Move your mouse pointer near the center of the Census Blocks layer.
- Then, hold your scroll wheel down, and then move your mouse toward the top of the Scene to make it rotate along the z axis. This allows you to see the extruded census blocks, with their total population values displayed as a height. Continue to rotate the map until you can clearly see the census blocks' height.
Your Scene should now look similar to the following screenshot:

Remember that the color for the census blocks might be different because ArcGIS Pro assigns a random color to newly added layers.
- Continue to use your mouse to zoom, rotate, and pan within your new Scene. Experiment with how the navigation works in a 3D environment.
You can also use the compass arrow in the lower-left corner of the map to pan and zoom in the map. The + and – icons zoom the map scale in and out. The up and down arrows pan up and down along the z axis. The ring in the center with the arrow can be used to rotate the view. If you expand the compass, you will see an additional ring around the center of a sphere, which you can use to rotate the view along the z axis as well.
- Lastly, save your project.
Congratulations! You have just created your first 3D Scene in ArcGIS Pro. For many of you, this may be the first Scene that you have ever created. In the next section, you will see how you can combine 3D extrusions with traditional 2D style symbology to create a really impactful map.
Step 4 – Combining types of symbology
In addition to extruding a layer so that it appears in 3D, you can also apply traditional symbology methods such as those youlearned about in Chapter 3, Creating 2D Maps. This makes Scenes even more powerful when visualizing data, by making them more informative.
In this step, you will apply traditional graduated color symbology to the Census Blocks layer to make the Scene even more informative and easy to interpret. You will symbolize each census block, using a color that represents the population range it falls into. You can do this by following these steps:
- In the Contents pane, select the Census Blocks layer.
- In the ribbon, click on the Appearance tab.
- Click on the small arrowhead located below the Symbology button, then select Graduated Colors, as shown in the following screenshot:
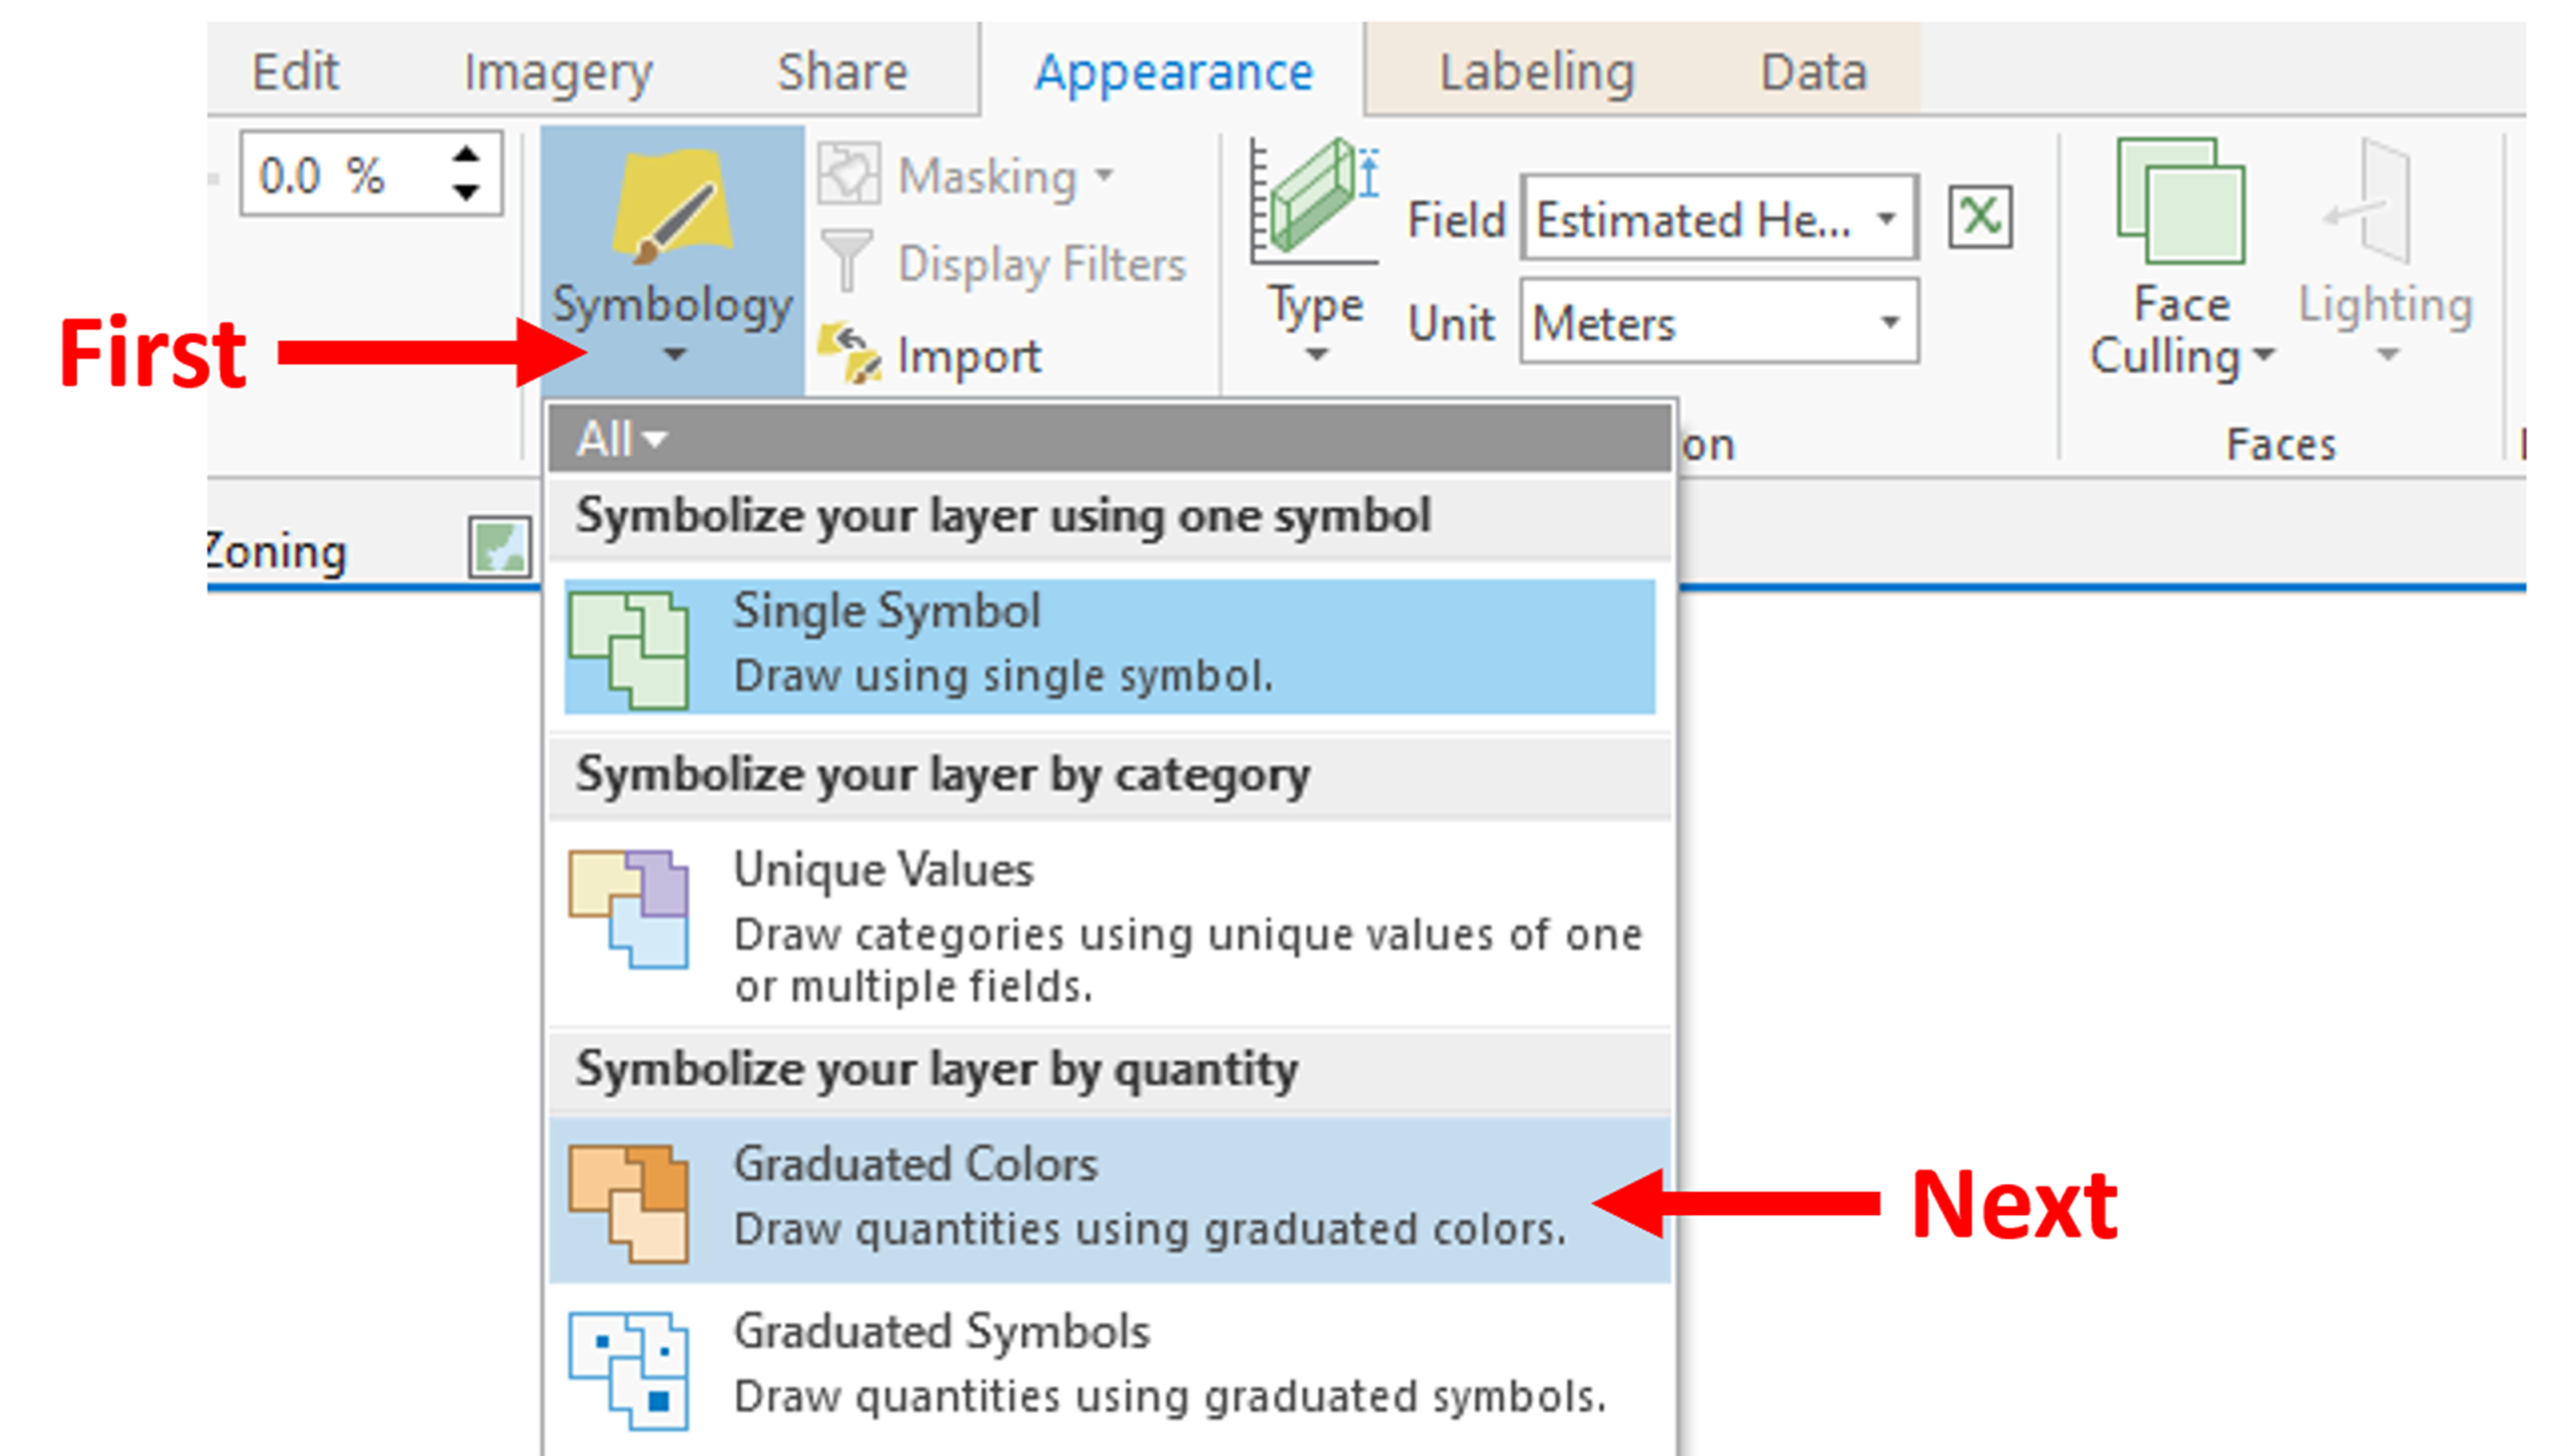
- The Symbology pane should now be open. Then, set the Field value to Total Population, using the drop-down arrow.
- Next, select a color scheme you think best displays the total population values. Usually, you want the lower values to be represented with a less intense color than for higher values.
- Save your project once you are happy with the color scheme that you have selected, then close the Symbology pane.
When you have completed the preceding steps, your map should look similar to the example given in the following screenshot (of course, your colors may be different depending on the scheme you selected):

Now, not only can you quickly identify which blocks have the highest total population based on their height, but you can also see the population range each block falls into. This makes the Scene a very powerful tool for disseminating information.
- Lastly, close ArcGIS Pro. If asked to save your project, please do so.
You have now created your first 3D Scene in ArcGIS Pro. An important component of any Scene is the use of elevations. This defines the ground surface as well as the location of features in space.
In the next section, you will learn about the importance of elevations in creating Scenes, what you can use as elevation sources, and how to control them within your Scene.
Learning about elevations and how to use them
When you create a 3D Scene within ArcGIS Pro, there are several elevations you need to be concerned about. You first need to define a ground elevation. The ground elevation provides a baseline for your Scene and is the canvas many other layers are applied to within your map.
Once you have established your ground elevation, you then need to determine the elevations of your 3D features. You will often find two elevations used for your 3D features, the first being the starting or base elevation, and the second being the height or depth of the features. These may be directly related to the ground or at an absolute elevation.
We will now take a closer look at these different elevations that you need to set in your Scene. We will start with a discussion on how to set the ground elevation and which data formats you can use to establish the ground elevation for your Scene. Then, we will examine methods you can use to set the base and height or depth elevations for your features.
Establishing ground elevations
The ground elevation is used by ArcGIS Pro to represent the surface of the earth within the 3D Scene you are creating. Each Scene should have a ground surface specified. By default, ArcGIS Pro uses the Esri World Elevation surface, which is published through ArcGIS Online. Don't worry though, as using this surface from ArcGIS Online does not use any of your ArcGIS Online credits. This surface, as with the ArcGIS Online Basemaps surface, is completely free to use.
You are not required to only use the Esri World Elevation surface—you can choose to use your own elevation surface if desired. Your own local surface is often much more accurate, so it will provide better results.
The extents of a Scene are limited to the extents for the data sources used as ground elevations. This means that your Scene extents will be clipped to the total combined area covered by your ground elevation sources. To ensure your Scene displays the amount of area you need, it is possible to use more than one data source as a ground elevation. This is especially useful when trying to show large areas or when needing to stitch together multiple datasets.
When using multiple data sources as ground surfaces, you need to make sure they align well with one another. The following screenshot shows you an example of two surfaces being used as ground elevations that do not align properly. You can easily see how this distorts the Scene along the common seam:
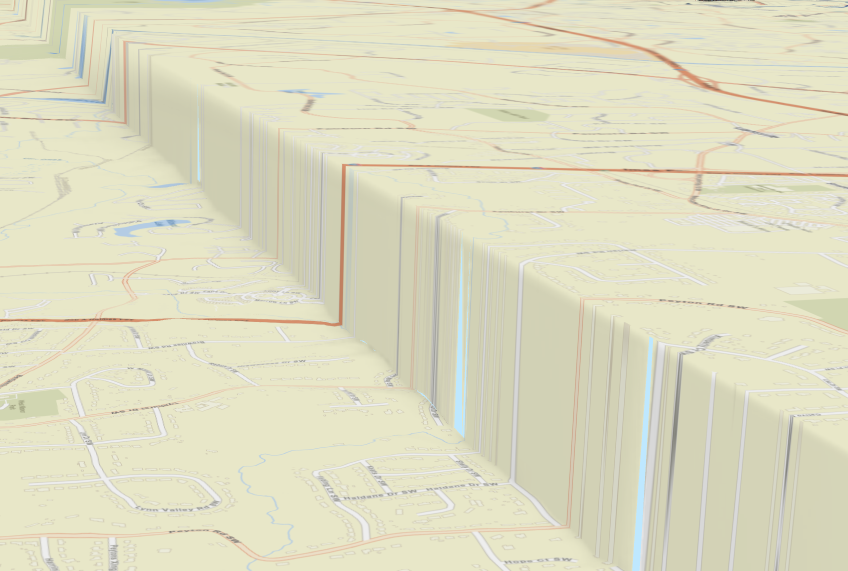
If there are significant differences between the elevation sources, as illustrated in the previous screenshot, this will warp your Scene along those seams and will negatively impact any analysis you might perform.
There are several types of data that you can use as a ground surface. This includes a Digital Elevation Model (DEM), a Triangulated Irregular Network (TIN), and web elevation surfaces.
Understanding DEMs
A DEM is a raster dataset that represents elevations over a defined extent. Raster data is made up of a series of equal-sized cells, with each cell containing a numeric value. What the value represents will depend on the purpose of the raster.
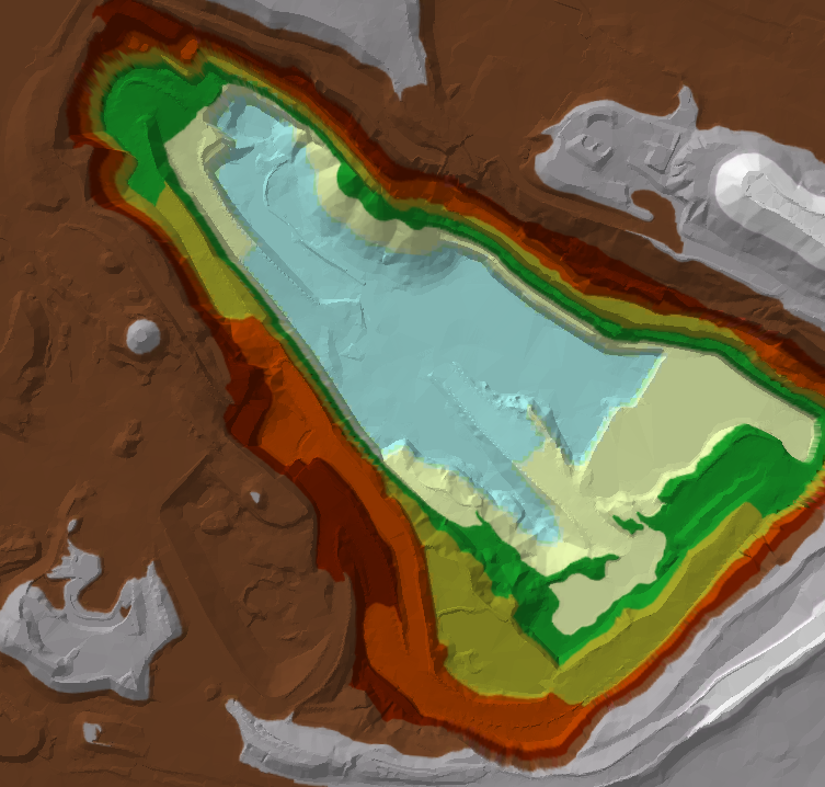
In the case of a DEM, the raster cell values represent the average elevation for the area covered by the cell. The following screenshot is an example of a DEM:
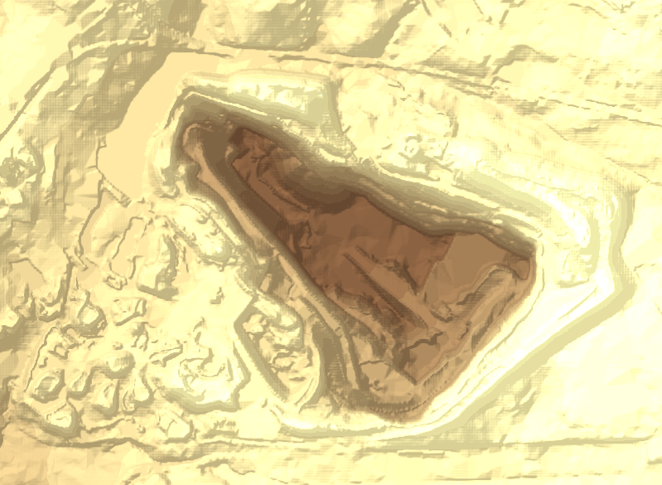
As you can see in the previous screenshot, if you were to zoom in on this DEM at some point, you would start to see individual squares that are the cells making up the raster data. The squares you see are now commonly referred to as a pixel, even though that is not correct. Each cell is assigned the value of the averaged elevation it covers. The cell might be 1 foot x 1 foot, or 2 meters x 2 meters. It is the size of the cells that determines the resolution and plays a part in its accuracy.
How does the DEM know the average elevation for the areas covered by its cells? As with all GIS data, it can be derived using many different methods. It might be created based on elevation information acquired by a land surveyor. It might have been compiled by a photogrammetrist using stereo photography methods. It may have been interpolated using contour lines, or some combination of all these methods.
Common raster formats include .jpg, .jpeg, .jp2, .tiff, .png, Seamless Image Database (.sid),EnhancedCompressedWavelet (.ecw), .img, .bmp, and GRID (Esri native raster format) formats.
Creating a DEM in ArcGIS Pro requires you to have the Spatial Analyst extension. However, if you already have access to one, you can create a 3D Scene and use the DEM as your ground surface without the extension.
Let's move on to TINs.
Understanding TINs
A TIN is a vector-based representation of a surface. It is constructed from a series of nodes and lines that form a network of adjacent triangles. The triangles form facets of a 3D surface that include areas of the same elevation.
The following screenshot shows you an example of a TIN as it is being drawn—you can see the triangles that make up the TIN:
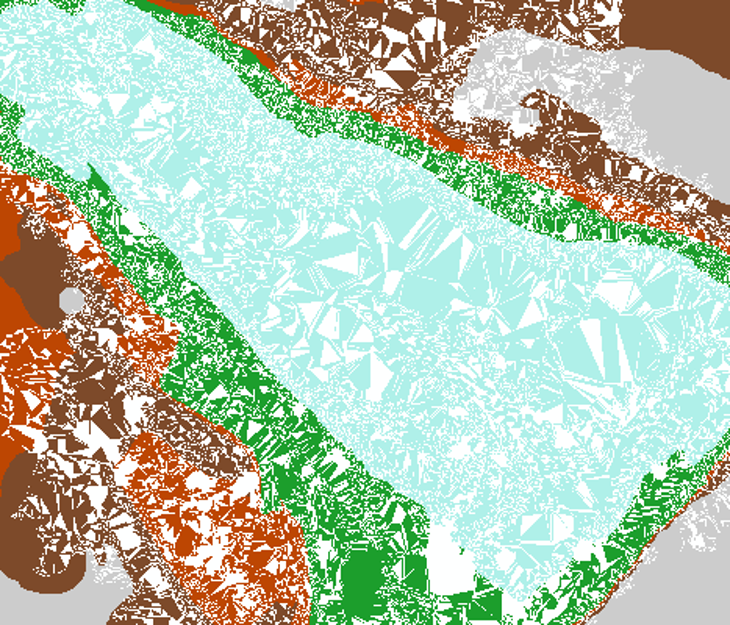
Once all the triangles are drawn, you are presented with what appears to be a solid surface. It is easy to see the elevation changes within the TIN, as shown in the following screenshot:
Because TINs are formed of vector-based data, they tend to be smaller in total file size to an equivalent DEM. However, due to their complexity, they can take much longer to draw or process when used in the analysis. It is strongly recommended that you ensure your computer has a dedicated graphics card if you will be working with TINs when using ArcGIS Pro.
Being vector-based, TINs can be created from a range of input data such as streams, ridgelines, roads, and so on. When the TIN is generated, these input features will remain in the same location and be matched with nodes or edges within the TIN. This can allow the TIN to achieve a high degree of accuracy and detail that is not normally possible with a DEM.
Creating a TIN does require you to have the 3D Analyst extension. However, if a TIN already exists, you may use it in ArcGIS Pro without an extension as a ground surface or a layer.
You now have a much better understanding of what elevations are and how they work in ArcGIS Pro. But what about the features within your GIS layers?How do you display them in 3D with the proper height? In the next section, we will explore how to do that.
Understanding extruding features
Extruding features is how you turn them from flat 2D shapes into 3D objects, providing them with height. For example, you can extrude power poles or trees so that you can see how tall they are.
Both of these are normally stored as point features. When you extrude them so that they have height, they become vertical lines. In the following screenshot, you can see an example of buildings and power poles that have been extruded to create 3D features:

From the previous screenshot, you can see that the buildings in this Scene started as a 2D polygon layer, which just shows the footprint of the buildings on the ground. By extruding them, you can now see their height above ground, gaining a greater appreciation of the spatial relationships between them and other features. The power poles were a 2D point layer that was extruded to show their height. Now, you can visualize the relationship between the buildings and the power poles.
ArcGIS Pro provides four methods for extruding features. The one that you use will depend on which information you have for your features, as detailed in the following table:
| Extrusion type | Description | Requirements | Data Types |
| Minimum Height | This adds the extrusion height to the minimum z value, producing a flat-top feature. | It requires an attribute field that contains an elevation value for the lowest point of the feature along the ground surface. | Lines or polygons |
| Maximum Height | This adds the extrusion height to the maximum z value, producing a flat-top feature. | It requires an attribute field that contains the elevation for a feature at its highest point along the ground surface. | Lines or polygons |
| Base Height | This adds the extrusion to the base elevation of each feature vertex. The result may not be a flat top, depending on the base height of feature vertices. | No attribute fields are required. However, the extrusion can be based on a field such as measured height, if available. | Points, lines, and polygons |
| Absolute Height | Features are extruded to a specified height regardless of base elevations or other z values. | It requires an attribute field that contains the top elevation of each feature. |
Points, lines, and polygons |
Extrusion is one of many ways in which we can display GIS data in 3D. In the next section, you will explore some other methods that you can use. The one that works best for you will depend on your data—for example, whether it actually stores a z coordinate or has elevational or height information stored within its attributes.
Other methods to display 3D data
Extrusion is not the only method to display data in 3D. ArcGIS Pro includes many 3D symbol styles that can add a level of realism to your Scenes. 3D symbols are designed to display features using commonly expected textures, materials, and details. For example, they can provide a building with a brick appearance or show a fire hydrant with a real-looking hydrant that you would expect to see when driving down the road. Often, these symbols have built-in 3D settings that do not require the features to be extruded.
You can also use CityEngine symbology rules to apply even more realistic Scenes if you have the 3D Analyst extension. CityEngine is another application for Esri that allows users to create advanced 3D renderings of their data.
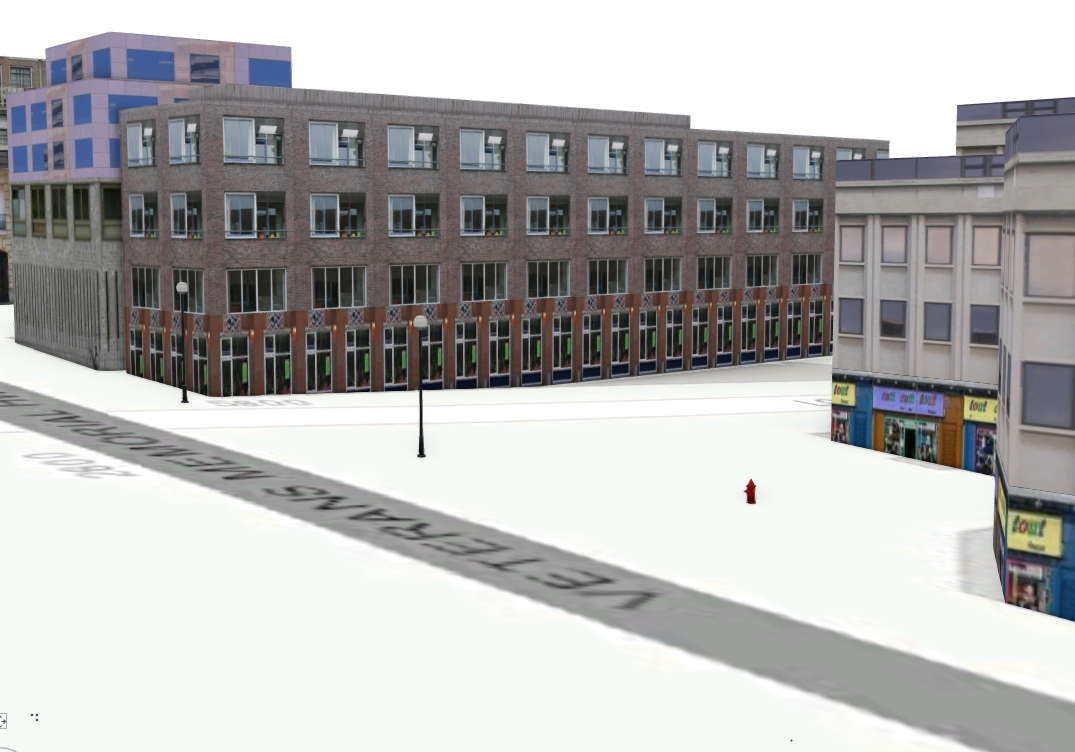
The following screenshot shows you an example of what can be accomplished using 3D symbology styles in ArcGIS Pro. Here, you can see a realistic-looking streetscape that includes buildings, light poles, fire hydrants, and power poles:

Let's move on to an exercise to better understand advanced 3D renderings. This will provide you with some hands-on experience, using some of the methods you just learned about.
Exercise 4B – Creating a Local Scene
The scenario for the exercise is as follows: A community and economic development director is working on a presentation that they will be presenting to a group of concerned citizens. They have asked you to create a 3D Scene of the central downtown business district that they can use in the presentation.
In this exercise, you will create a Local Scene to fulfill the director's request. This Scene will use a locally developed DEM that is more accurate than the Esri World Elevation model. You will then add and symbolize layers using 3D symbology to create a more realistic Scene.
Step 1 – Opening a project and adding a Local Scene
In this step, you will open the last project you created and add a new Local Scene. To do this, we follow these steps:
- Start ArcGIS Pro.
- Open the project you created in the Exercise 4A section. This should be in your list of recently opened projects.
- In the Catalog pane, right-click on the Maps folder and select New Local Scene.
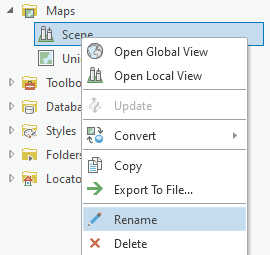
- Once the new Scene is generated, right-click on it and select Rename from the menu that appears, as illustrated in the following screenshot:
- Type Local Scene as the new name, and press your Enter key.
You have just created a new Local Scene in the project that you created in the last exercise. Remember—a single project can contain multiple maps and Scenes. This makes it easier to manage and access.
Step 2 – Setting the ground surface
In this step, you will assign the DEM that the city engineer has provided as the ground surface. This DEM was created by the city engineer based on survey data that they had collected from a professional surveyor. We use the following steps to assign the DEM:
- In the ribbon, click on the Map tab.
- Click on the small drop-down arrow located below the Add Data button to expose the menu.
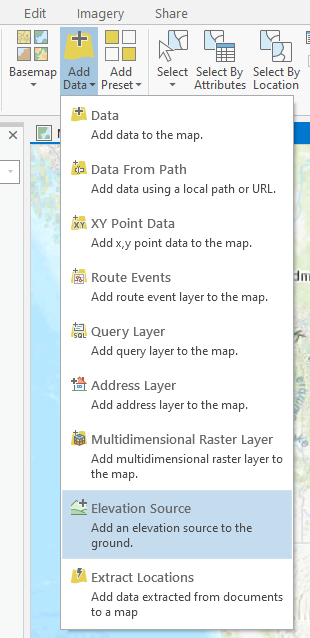
- Select Elevation Source from the menu. This is located near the bottom of the menu, as illustrated in the following screenshot:
- Then, in the left panel of the Add Elevation Source window, select Databases, located under Project.
- After that, in the right panel of the window, double-click on the Trippville_GIS.gdb geodatabase.
- Then, select DEM from the right panel of the window and click OK.
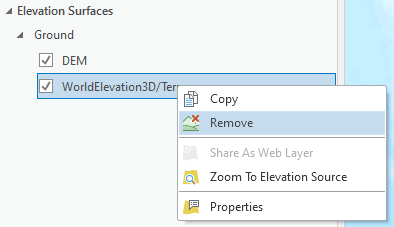
The DEM should now appear in the Contents pane under the Elevation Surfaces category. As you can see in the following screenshot, your Scene now has two Ground surfaces—the DEM surface you just added and the WorldElevation3D/Terrain3D surface from ArcGIS Online:

Now, you will remove the WorldElevation3D/Terrain3D surface from your Scene. You do not need to use this surface provided by Esri since you have your own, which covers the entire area of the city you are working with.
- Then, right-click on the WorldElevation3D/Terrain3D surface and select Remove from the menu, as illustrated in the following screenshot:
You have just set the ground surface for your Scene to the DEM provided by the city engineer. Don't be concerned if your Scene currently appears to be blank. This will be fixed as you add more layers to the Scene.
Step 3 – Adding layers and setting symbology
Now that you have the ground surface defined, it is time to start adding the layers requested by the director, by following these steps:
- Using the skills that you have learned, add the following layers to your Scene from the Trippville_GIS.gdb geodatabase:
- Buildings: This is located in the Base Feature dataset.
- Fire_hyd: This is located in the Water Feature dataset.
- Light_Poles: This is located in the root of the geodatabase.
- Then, drag the Buildings layer to the 3D Group layer.
- Click on the symbol patch located below the layer name to open the Symbology pane on the right side of the interface, as illustrated in the following screenshot:

- Ensure that the Gallery tab is selected at the top of the Symbology pane. Then, in the search area, type Building, and then set the search to All styles in the drop-down box located to the right of the search cell.
- Select International Building under Procedural Symbols, then right-click on the Buildings layer and select Zoom to Layer. Then, make sure that the Explore tool is selected on the Map tab in the ribbon.
- Place your mouse pointer near the center of one of the buildings and depress the scroll wheel on your mouse. While holding your scroll wheel down, move your mouse pointer toward the top of your Scene to rotate your Scene so that you can view the height of the Buildings layer, which is now using the 3D symbology style you just applied.
Once you have rotated your Scene, zoom in to get a closer look. Your Scene should look similar to the following screenshot. You will notice your buildings now have a much more realistic appearance than they had when you just extruded them in the last exercise:

- Now, drag the Light Poles layer to the 3D category.
- Then, click on the point symbol located below the layer name.
- In the Symbol pane, first, ensure the Gallery tab is active, and then, in the search area, type Light. You may also need to ensure the All styles option is still set as the search option.
- Then, select the Light On Post - Light Off symbol from the 3D street Scene as this most closely matches with the ones used by the city of Trippville (you can choose a different one if you wish).
- After that, right-click on the Light Poles layer and select Properties, then click on the Display option in the left-side pane.
- Then, check the box that says Display 3Dsymbols in real-world units, and click OK.
This will allow you to set the correct height on the light poles. The standard height of the light poles used in the city is 18 feet. Before you can set the height for the light poles, you will need to make one more change to the project settings. By default, 3D symbols use meters as the unit for specifying height. You need to change this in project options to feet.
- Click on the Project tab in the ribbon and select Options, then click on Units under Project.
- Expand 3D Symbol Display Units, and then click on the radio button located at the end of the row for Foot_US in the grid, as shown in the following screenshot:
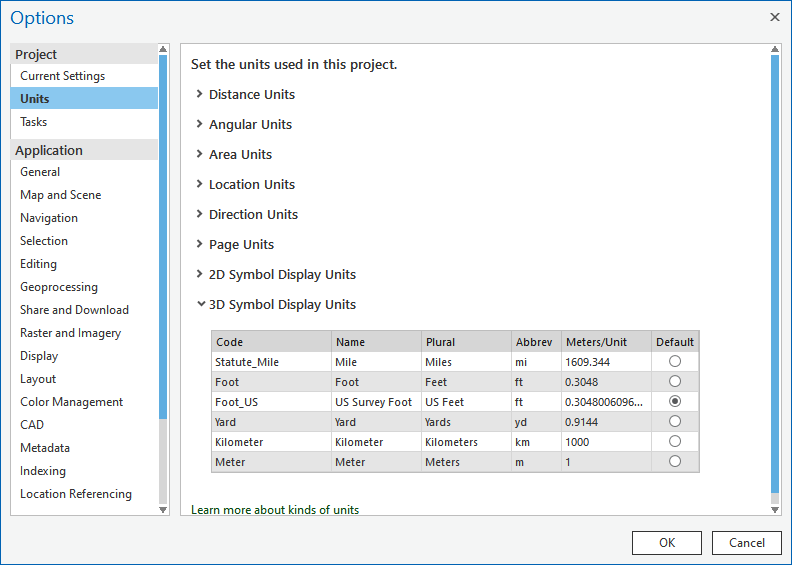
- Once you have verified the setting, click OK.
- Click the back arrow located on the upper left-hand side of the Project window to return to your Scene.
- Then, save your project.
- After that, click on the symbol patch located below the Light Poles layer name.
- Then, click on the Properties option in the Symbology tab, ensuring that the Light Poles layer is still selected.
- After that, set the Size option to 18 ft, and then click Apply.
- Repeat this process for the Fire_Hyd layer and use the following settings:
- Select Fire Hydrant for the Symbol field.
- Set 3 pt for the Height field.
Your Scene should now look similar to this, depending on your rotation and zoom scale, if you have correctly applied all the settings:
You are almost done. Now, you need to apply a basemap that adds a more realistic backdrop and applies the sky to the Scene.
- Click on the Basemap button on the Map tab in the ribbon.
- Select the Imagery basemap. This will allow you to use aerial photography as a basemap, which will add a touch of realism to the Scene.
- Now, to add the sky, you will need to apply a fill to the entire Scene. Right-click on Local Scene in the Contents pane, and select Properties.
- Then, select the General option in the left-side pane of the Map Properties window.
- Set the Background color option to Sodalite Blue, using the drop-down arrow to display a color palette (you can choose a different color if you think another will work better), and click OK.
- Lastly, save your project. Take some time to pan, rotate, and zoom within the Scene that you just created. It has a very realistic appearance, which is exactly what the director was hoping to accomplish.
Your final Scene should look similar to this (yours may be slightly different depending on your rotation and scale):

Congratulations! You have created a realistic-looking 3D visualization of a downtown area. Now, make sure to save your project so that you don't lose all the hard work you have completed.
Summary
Now, you have seen that ArcGIS Pro supports some very powerful tools for visualizing data in 3D. This opens new levels of understanding, using your GIS data. You have learned how you can create different Scenes to support different spatial extents.
You have also learned how you can use different methods to turn 2D data into 3D features, using extrusion or 3D symbol styles. When using extrusion, you can illustrate the true height of features using one of four methods supported in ArcGIS Pro. Now, you can use 3D symbols to add a level of visual realism to your Scenes.
The key element to creating a 3D Scene is to define a ground surface. You learned that you can use the default Esri-provided World Elevation surface or one of your own. You are now able to use one of your own surfaces—this can be a DEM or a TIN. Using your own ground surface can increase the accuracy of the elevation data within your Scene and the relationships between features along the z axis.
In the next chapter, you will learn more about how projects work within ArcGIS Pro. So far, you have been working largely on projects that were already created. Next, you will explore the parts that make up an ArcGIS Pro project and how you can create new ones yourself.
Further reading
If you would like to explore these concepts in more detail, you may want to check out the following:
- ArcGIS Pro 2.X Cookbook, Chapter 10,3D Maps and 3D Analysis