One of the key functions of a Geographic Information System (GIS) is to visualize data. In a GIS, we use maps as our primary method for visualizing data. Maps allow us to see and analyze the spatial relationships between features in one or more layers. We create maps for many different reasons. Often, we are trying to show the location of specific assets or to highlight attributes associated with features, such as a parcel's zoning classification or a pipe size. Sometimes we wish to show the results of the analysis we have performed.
So, each map we create in ArcGIS Pro has a reason for existing. This purpose will help to dictate what layers we include in the map and how they are visualized. There is no limit to the number of layers a map can contain. However, it is possible to have so many layers in a map that it distracts from the purpose. As the author of the map, you must strike a balance between the amount of information you include in a map and its overall purpose.
Each layer in a map has a set of properties. This includes things such as the source, symbology, visibility ranges, coordinate system and more. When you create a map and add layers, you must configure many of these settings manually to ensure your map is legible and supports its intended purpose.
As you have already experienced, ArcGIS Pro allows you to create both 2D and 3D maps within a project. In this chapter, you will focus on creating a 2D map. These have been the mainstay of GIS since it was first developed over 50 years ago. In this chapter, you will learn how to do the following:
- Creating and configuring 2D maps
- Creating a new map
- Skill challenge
Technical requirements
In order to complete this chapter, you will need the following:
- ArcGIS Pro 2.6—Basic or higher license
- An internet connection
- Exercise data
It is also recommended that you complete all previous chapters before starting this one unless you have experience of using ArcGIS Pro.
Creating and configuring 2D maps
ArcGIS Pro provides several methods for creating new 2D maps within a project. As you will learn later, creating a new project using a template can automatically create a new map that you can build on. Of course, you can also add new maps to existing projects as needed. ArcGIS Pro supports several methods for creating or adding maps to existing projects. Which method is best will depend on several factors, including personal preference. It also depends on whether the map already exists in another project or the current one, or if it is a map document file from the old ArcMap application ArcGIS Pro is replacing.
Another thing to remember is that an ArcGIS Pro project can contain multiple maps. It is not uncommon for a single ArcGIS Pro project to contain multiple maps required to support daily operations. For example, if you are the GIS manager for a city, you might have most maps in a single project, such as zoning, land use, voting districts, police zones, tax districts, and more. That might make it easier to manage your GIS files and maps.
A map only provides a canvas for displaying your data to support its purpose. You must add and configure the content. This normally means adding layers that represent the features you wish to display within your map. Just as there are multiple methods for creating new maps, there is also more than one way to add new layers to a map.
You will now investigate different methods for creating new maps and adding layers.
Creating a new map
Maps are the primary way we visualize data in a GIS. As already mentioned, you may need to have multiple maps in your projects to support the various needs of your organization or clients. Each map you create should have a specific purpose. The purpose will help you determine what layers you will need, and which need to be the primary focus.
One thing to always be mindful of is map readability. You can put too much information into a single map. So to keep from making a single map too cluttered, you might actually need to create multiple maps that focus on one to two primary layers.
So how do you create new maps within ArcGIS Pro? There are many ways, as follows:
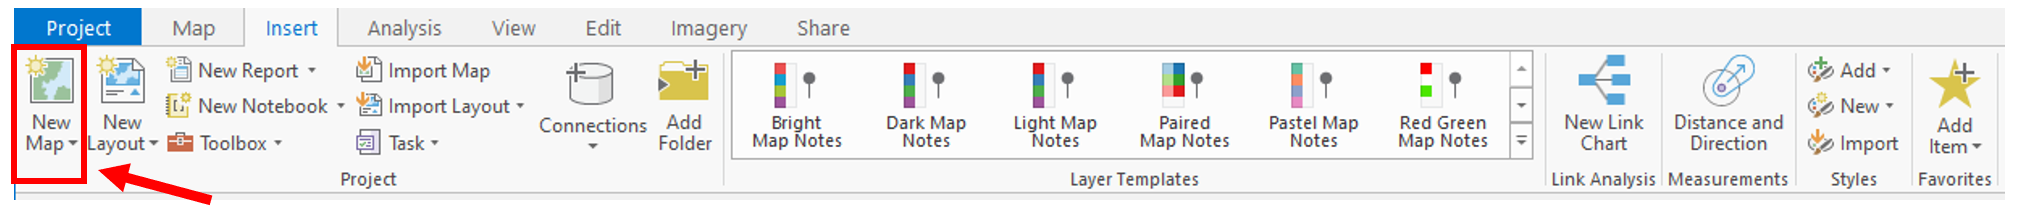
- One way is using the Insert tab on the ribbon. From there, you can choose the New Map button, as shown in the following screenshot:
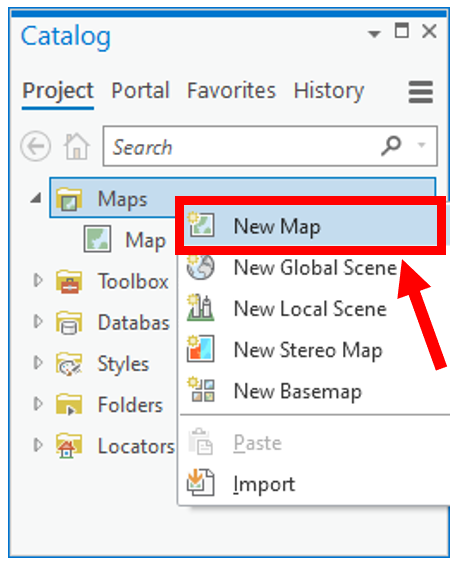
- Another way is to right-click on Maps within the Project pane and select New Map as shown here:
- Another way is to import an existing map. ArcGIS Pro allows you to import maps in multiple formats including map documents, map packages, and map files. Each of these has a unique file extension. The following table provides more detail on this:
| Item | File extension | Software used to create it |
| Map Document | .mxd | ArcMap |
| Map Package | .mpk | ArcMap or ArcCatalog |
| .mpkx | ArcGIS Pro | |
| Map File | .mapx | ArcGIS Pro |
| ArcScene Document (3D) | .sxd | ArcScene |
| ArcGlobe Document (3D) | .3dd | ArcGlobe |
As you can see in the preceding table, when you import an existing map from one of these files, the new map it creates in your project will contain the layers along with all of their settings such as the symbology and labels that were in the map you imported. This provides a way to help quickly populate a new project with items so you can get to work faster. This is especially true for those who are migrating to ArcGIS Pro from ArcGIS Desktop.
It should be noted that the last two file types listed are actually 3D maps. When you import those into ArcGIS Pro, they will create new 3D scenes in the project. You will learn more about those in the next chapter.
Now that you know some of the different methods for creating new maps in your project, it is time to put that knowledge to use in the following exercises. You will start by adding new layers to an existing map and configuring them. Then you will add a completely new map to a project and add layers to it.
Exercise 3A – Adding and configuring layers in a map
You have been asked by the Community and Economic Development Director for the City of Trippville to prepare several maps for a business that wishes to open a location in the city. He needs a map that shows the locations of all commercial property in the city. Then he wants another that shows all commercial parcels over 1 acre, but less than 3 acres in size.
In this exercise, you will create a new project using the Map template. You will create the first map requested by the director. This will require you to add and configure several layers using various methods. You will add the second map to the project in another exercise.
Step 1 – Creating the project
In this step, you will create the project that will be used to develop the maps requested by the Community and Economic Development Director:
- Open ArcGIS Pro.
- In the ArcGIS Pro start window, select Map under New and Blank Templates, as shown in the following screenshot:

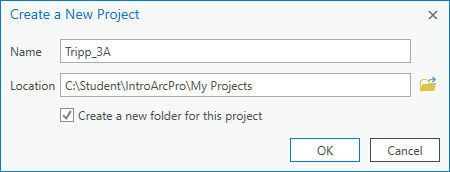
- In the Name box, type Your Name_Ex3A (that is, in this case, Tripp_Ex3A).
In general, it is always best to avoid using spaces and special characters when naming anything in ArcGIS Pro. Sometimes ArcGIS Pro will allow them and other times not. This can also change from one version to the next. So, I recommend just not using them to avoid problems. Underscores are acceptable, as you can see in this exercise.
- For the location, click on the Browse button located at the end of the box or cell. It looks like a small open file folder with a blue arrow. This will open the Select a folder to store the project window.
- In the left panel of the Select a folder to store project window, click on Computer, located below Project.
- In the right panel of the window, double-click on (C:) or the drive in which you installed the exercise data.
- Then double-click on the Student | IntroArcGISPro folder.
- Select the My Projects folder and click OK. Your Create a New Project window should now look like the following screenshot; of course, the project name will include your name and not mine:
You have just created a new ArcGIS Pro project using the included Map project template. The new project you just created should open with a single empty map.
If you mistakenly double-click on the My Projects folder, you can click on the small up arrow located to the left of the displayed path at the top of the Select a folder to store the project window to take you back to the previous folder.
Eventually, you will add and configure new layers on this map. You will learn more about how to create new projects in Chapter 5, Creating and Working with Projects.
Step 2 – Connecting data sources
Creating a new project is just the first step. Now you need to connect to the folders and databases you need to use for this project. You will connect to the Trippville_GIS geodatabase and the folders that contain other files you need:
- In the Catalog pane, expand the Databases folder by clicking on the small arrowhead located to the left. This will allow you to see the list of all currently connected databases.
You should only see a single database connection. This is the project database that was created with the new project. Typically, most organizations already have an existing GIS database. For this exercise, the city of Trippville is no different. It already has a GIS database. You just need to connect to it to use the existing GIS data.
- Right-click on the Databases folder in the Catalog pane and select Add Database, as illustrated in the following screenshot:

- In the Select Existing Geodatabase window, navigate to C:StudentIntroArcProDatabases and select Trippville_GIS.gdb by clicking on Computer in the left panel. Then double-click on the C: | Student | IntroArcGISPro | Databases folder. Lastly, select the Trippville_GIS.gdb geodatabase and click OK.
The Trippville_GIS.gdb database should now appear under the Databases folder in the Catalog pane. This means you have successfully connected to the database and will be able to use the data contained in that database.
Now you will also need to connect to a folder that contains files you will also need to complete this project.
- Right-click on the Folders folder in the Catalog pane, then select Add Folder Connection.
- In the Add Folder Connection window, navigate to C:StudentIntroArcPro and select Chapter3 using the same method you did to navigate and connect to the Trippville_GIS geodatabase. Click OK once you have selected the Chapter3 folder.
You have now connected to all the resources you will need to complete this project. Your Catalog pane should look like this if you have connected to all the project items as directed:

- Save your project.
Establishing these connections may seem to be a hassle and something you do not do in other applications. This is true to an extent. However, in GIS we often work with large datasets that can be gigabytes to terabytes in size. This is why a project or map does not actually store the data we use but instead connects and references it. That allows us to work with large datasets without crashing the computer.
The good thing is you only need to establish these connections once in a project. After you save the project those connections are remembered and will be there every time you open the project.
Step 3 – Adding layers
Now that you have created your project and established connections to your data, it is time to begin on the maps requested by the Community and Economic Development Director. You will start with the first one he requested, showing the location of all the commercially zoned property within the city.
You will use the map created when you generated your new project using the project template as your starting point. You will add and configure a few layers using various methods.
The first layer you want to add is the city limits so everyone will know which areas are in the city and those that are out:
- In the Catalog pane, expand the Databases folder and then the Trippville_GIS.gdb geodatabase. Once expanded, you should see that it contains many feature classes. This represents the entire GIS data for the city.
- Expand the Base feature dataset so you can see its contents. Feature datasets are indicated by a unique icon that looks like three overlapping squares.
- Select the City_Limit feature class. Holding your mouse button down, drag the City_Limits feature class into the map view. Once your mouse pointer is over the map view, release your mouse button.
The city limits have now been added to your map using a drag and drop method. This is one of the methods you can use to add a new layer from resources connected in the Catalog pane. Also, notice that the map scale and zoom location changed.
You were automatically zoomed into the extents of the City_Limit layer you just added, as shown in the following screenshot. Remember, your colors may differ:
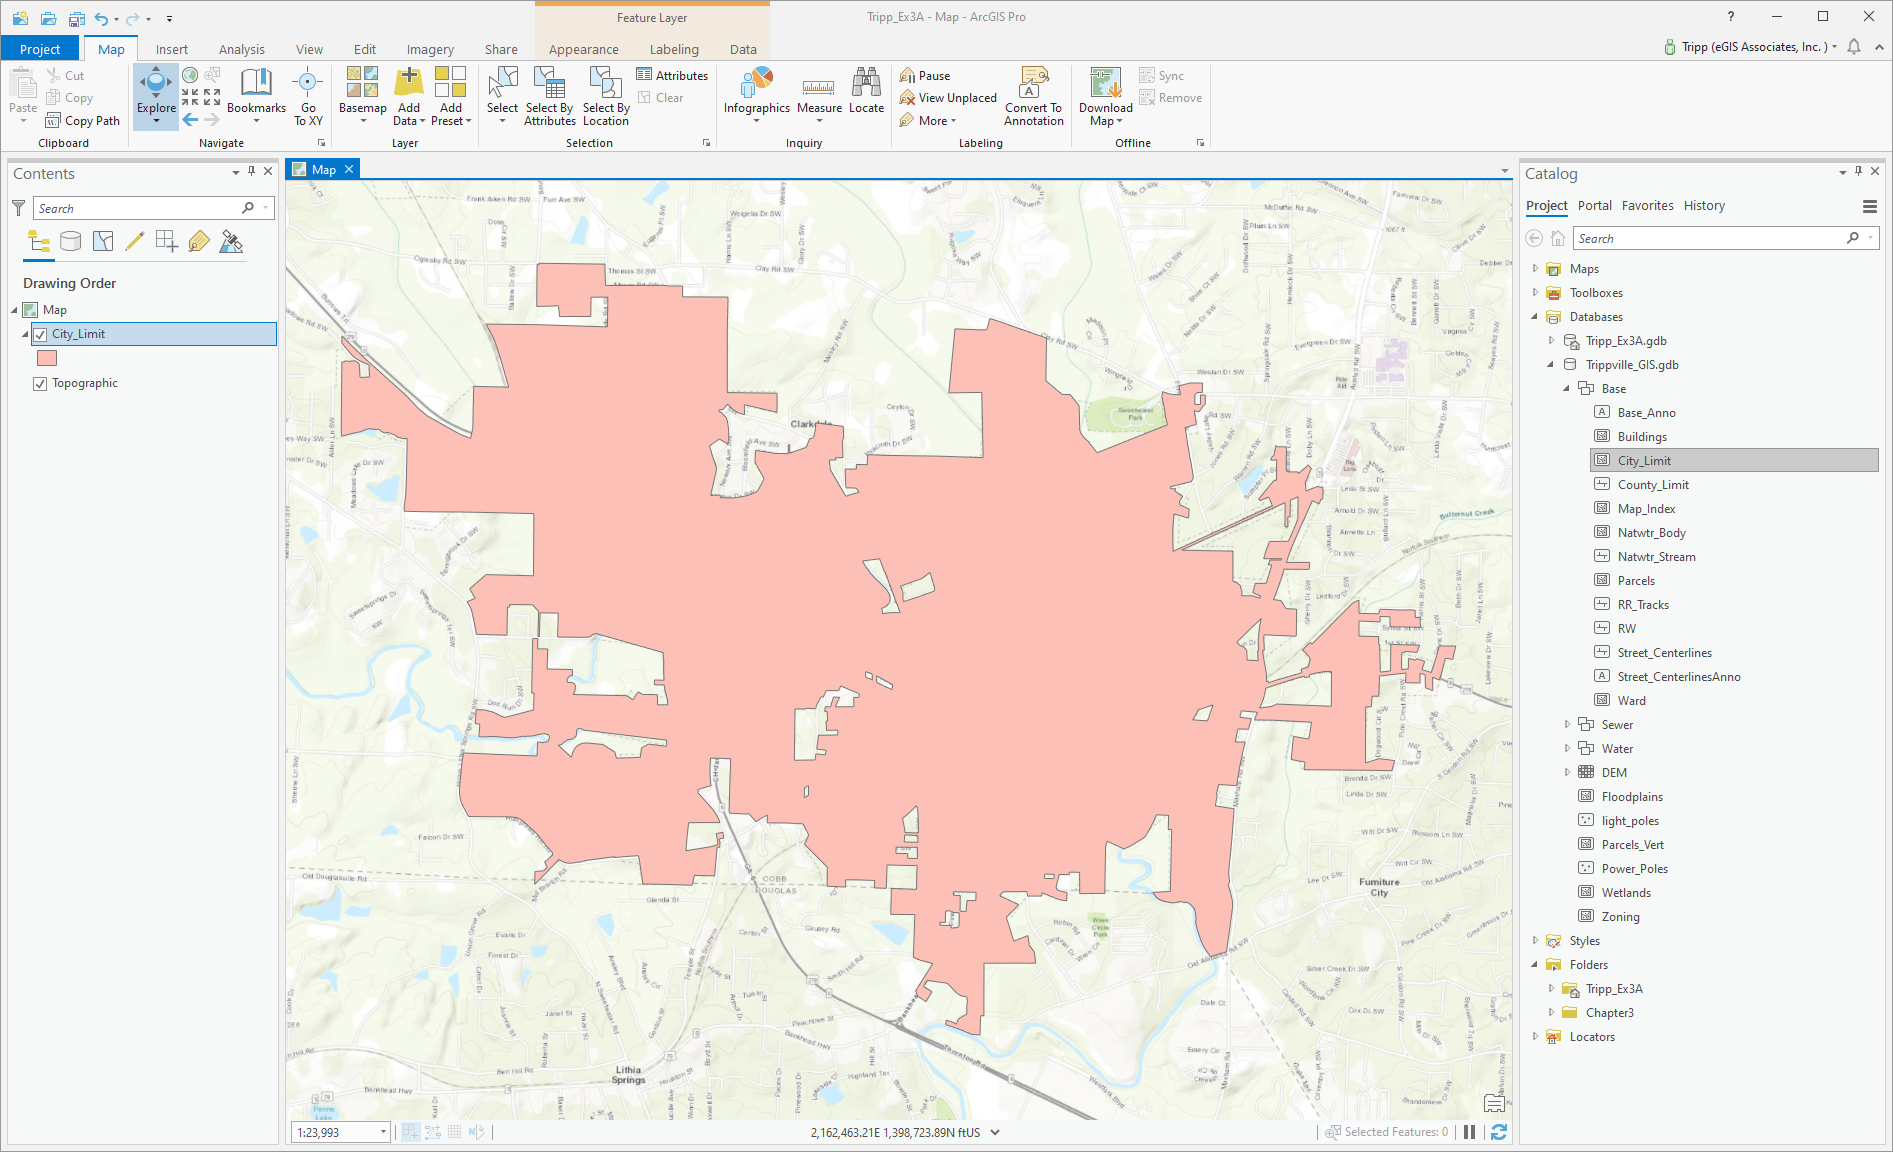
In a new map, the first layer you add is special. First, it sets the coordinate system used by the map. All future layers will be projected to match the coordinate system of the first layer added, if they use different coordinate systems. This is called projecting on the fly. Second, your map will automatically zoom to the extent of the data contained in that first layer, as you have now seen. It will only do this for the first layer added at the time it is added.
Now you will need to change the symbology for the City_Limit layer. As you can see, the City_Limit layer currently has a solid fill that is hiding the information underneath. You will change the symbology for this layer so you can see through the layer but still see the boundary.
- Double-click on City_Limit in the Contents pane to open the Layer Properties window. In the General page, type City Limits in the name box to give the layer a new, more descriptive name and click OK.
- Click on the symbol located below the City_Limit layer name in the Contents pane to open the Symbology pane on the right side of the interface.
- The Symbology pane should open to the Gallery view. Select the Black Outline (2 Points), which should be the second sample symbol in the top row, as indicated in the following screenshot:
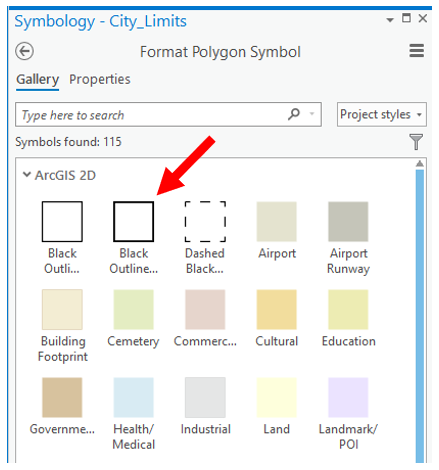
If you do not see the Black Outline (2 Points) sample symbol, use the search box at the top of the Symbology pane to search for it. You may also need to change the search option from Project Styles to All Styles as well.
- Next, click on the Properties tab located at the top of the Symbology pane next to the Gallery tab.
- Set the Outline Width from 2 pt to 3 pt. This will thicken the line representing the city limits boundary, so it stands out more. Click the Apply button located at the bottom of the Symbology pane.
- Click on the Map tab on the ribbon. Then click on the Add Data button to add a few more layers.
- Click on the Databases folder in the left panel of the Add Data window. Then double-click on the Trippville_GIS.gdb geodatabase in the right panel of the window to display the contents of the database.
- Double-click on the Base feature dataset in the right panel of the window.
- Holding down your Ctrl key, select the County_Limit, Natwtr_Body, Natwtr_Stream, and RR_Tracks feature classes.
- Click OK to add these new layers to your map. Your map should now look similar to the following screenshot, but as always, remember that your colors may be different:
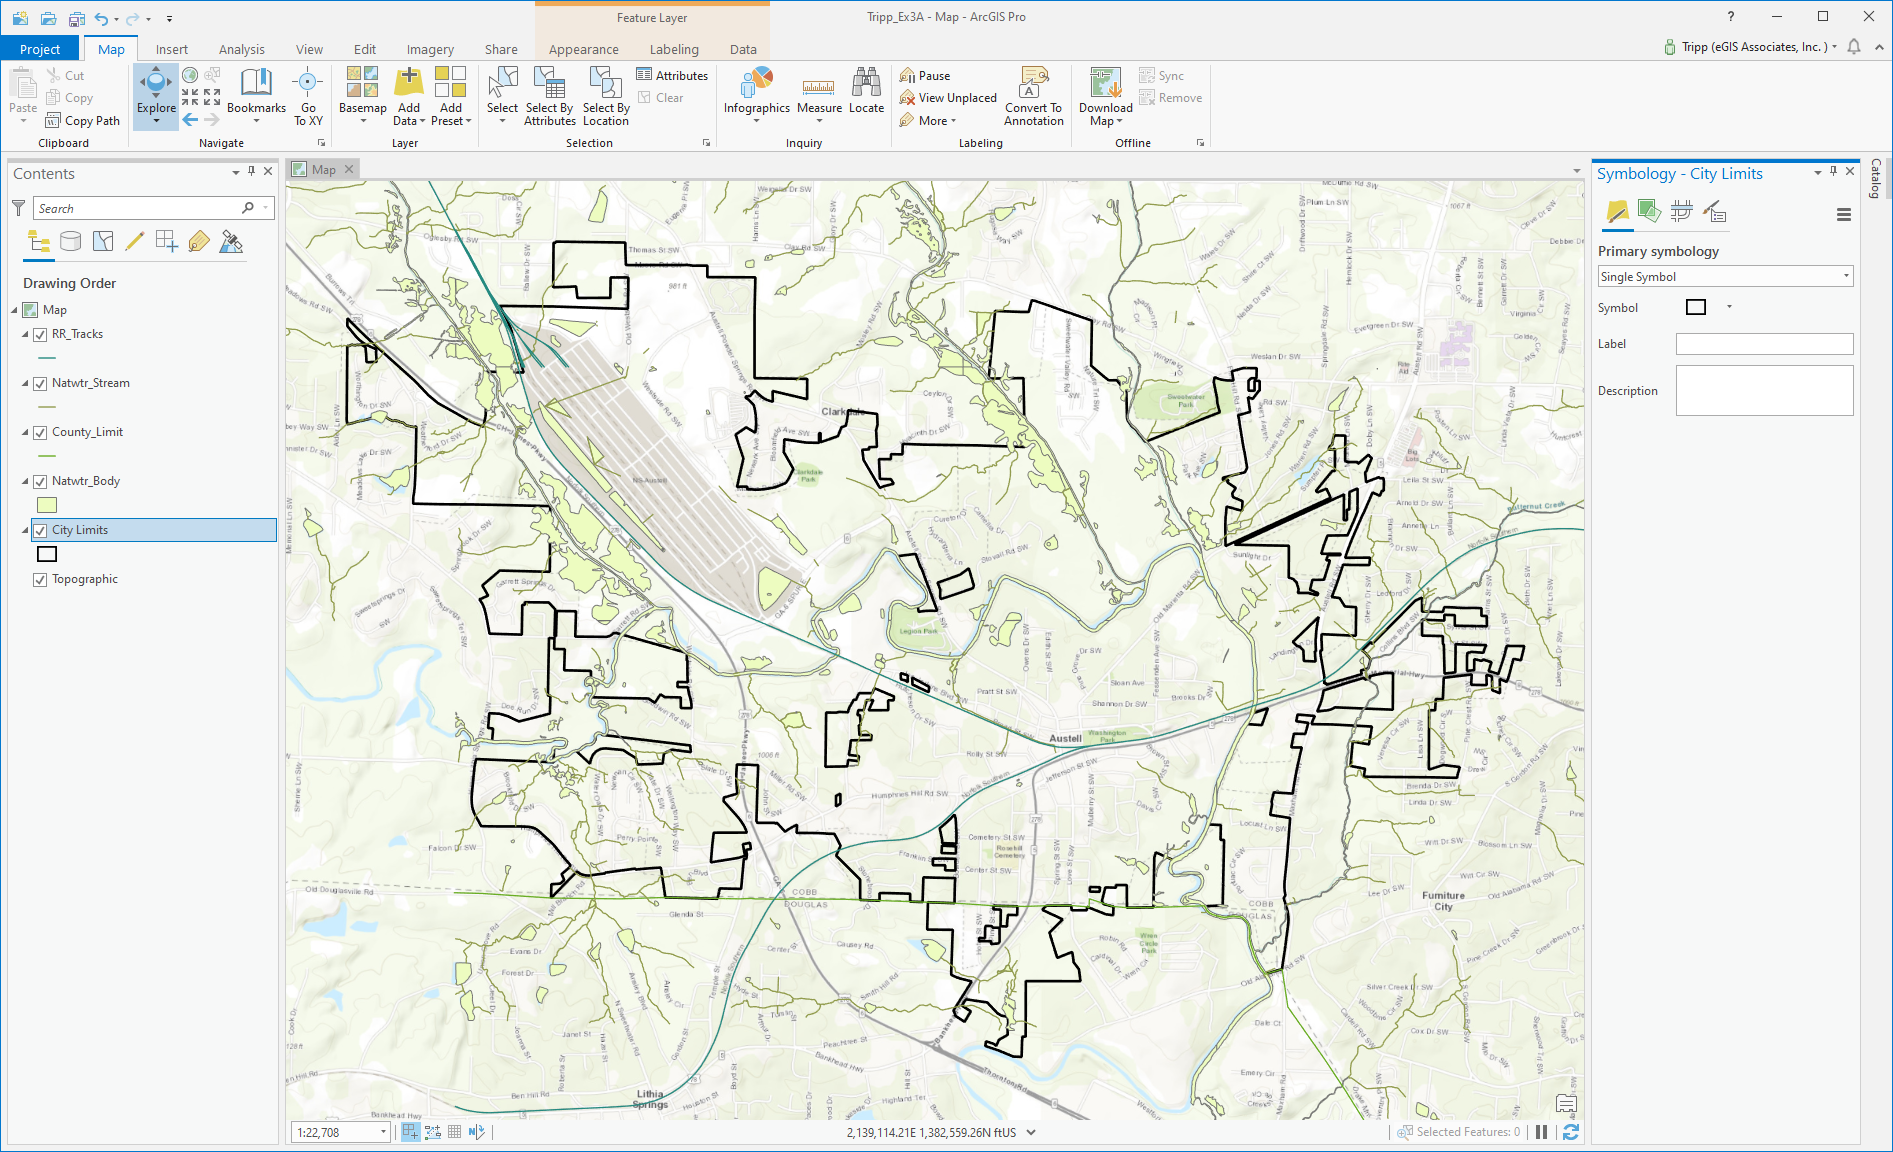
As you can see from the preceding screenshot, you have added five new layers to your map. For the first, you used the drag and drop method from the Catalog pane. The last four layers you added using the Add Data button on the Map tab. Now you know two different ways to add new layers to a map.
Next, you need to configure the symbology for the four new layers you just added.
- Make the following changes to the layers you just added using the skills you have learned so far:
- For the RR_Tracks layer, make sure of the following:
- Set the Name field to Railroad.
- In the Symbol field, type Railroad (Hint: Look in the Gallery).
- For the Natwtr_Stream layer, make sure to do the following:
- In the Name field, type Streams & Creeks.
- In the Symbol field, type Water (line).
- Set the Line Width field to 1 pt.
- For the County_Limit layer, make sure to do the following:
- In the Name field, type County Limit.
- Set the Color field to Gray 60%.
- Set the Line Width field to 2 pt.
- For the Natwtr_Body layer, make sure to do the following:
- In the Name field, typeLakes & Ponds.
- Set the Colorfield toYogo Blue.
- Set the Outline Colorfield toCretan Blue.
- Set the Outline Width field to 1 pt.
- For the RR_Tracks layer, make sure of the following:
- Close the Symbology pane when done.
- In the Contents pane, ensure you are looking at the List by Drawing Order. That is the first button, the icon for which looks like a folder tree.
- In the Contents pane, select the County Limit layer and drag it below City Limits.
- Move the Lakes & Ponds layer above the Streams & Creeks layer in the Contents pane.
Your map should look like the following screenshot once you are done:

- Once you have verified you have configured your layers successfully, save your project.
You have now added the layers needed to put what will be the primary layers into context. Some refer to the layers you have added as basemap layers. However, over time, Esri has developed a specific type of map called a basemap, which you can also create. A true ArcGIS basemap can be added to any map and all the layers it includes are automatically added. Esri publishes several basemaps via ArcGIS Online that anyone can use.
You can see one of those in the graphic showing the results of the exercise to this point. It is at the bottom of the layer list and is called Topographic. True basemaps have improved drawing performance, meaning they will redraw faster than normal layers. The drawback to using a true basemap is that your ability to do anything other than viewing the data is limited.
The last layer you need to add to this map to meet the request from the director is a layer that shows all parcels zoned as commercial. Luckily, another user has created a Zoning layer file. As you saw earlier, layer files can be used to set the symbology for a layer you already have on your map.
It can also be used to add a new layer that is already symbolized. You will use this layer file to add a Zoning layer to the map and then limit it to only show those parcels with a commercial zoning classification. The zoning classes that delineate commercial zoning include GC (General Commercial), GC-S (General Commercial with special stipulations), and CBD (Central Business District).
- Expand the Folders folder in the Catalog pane.
- Expand the Chapter3 folder and right-click on the Trippville Zoning.lyr file. Select Add to Current Map, as illustrated in the following screenshot:

A layer file stores all the layer property settings including symbology, labeling, definition queries, field visibility, zoom scales, and more. This makes it easier to add the layer to other maps with the same settings. Layer files can help standardize how specific layers look across multiple maps and projects, as well as reducing the time needed to create new maps.
You have added a layer that shows the zoning of all parcels in the city. Now it is time to limit the layer to only the commercial zoning classes.
- If needed, expand the symbology for the Zoning layer in the Contents pane by clicking on the small arrow located to the left of the Zoning layer so you can see all the zoning classifications and their associated symbology.
- With the Zoning layer selected in the Contents pane, select the Appearance context tab in the ribbon.
- Click on the Symbology drop-down menu and select Unique Values to open the Symbology pane on the right side of the interface, as illustrated in the following screenshot:

- In the Symbology pane, select the row for the PUD symbol settings in the grid that shows the list of zoning classifications and their assigned symbols. You can click anywhere in the first three columns on the row for PUD in that grid to select the row, as shown in the following screenshot:

- Holding down your Shift key, click on the row containing the value with Mobile Home Park to select all values from PUD to Mobile Home Park. If you are successful, your symbology pane should look like the following:

- Right-click on one of the selected rows and select Remove.
You have just removed those selected symbology values from the layer legend that are not considered commercial zoning classifications. This removes those features that were assigned those values so they are no longer shown on the map. Remember, you are trying to create a map that only displays parcels with commercial zoning.
The layer is still displaying some parcels that are not commercially zoned. You will need to remove those classifications as well.
Removing classifications from the legend for the layer does not actually remove them from the source data the layer references. It just hides them from the display.
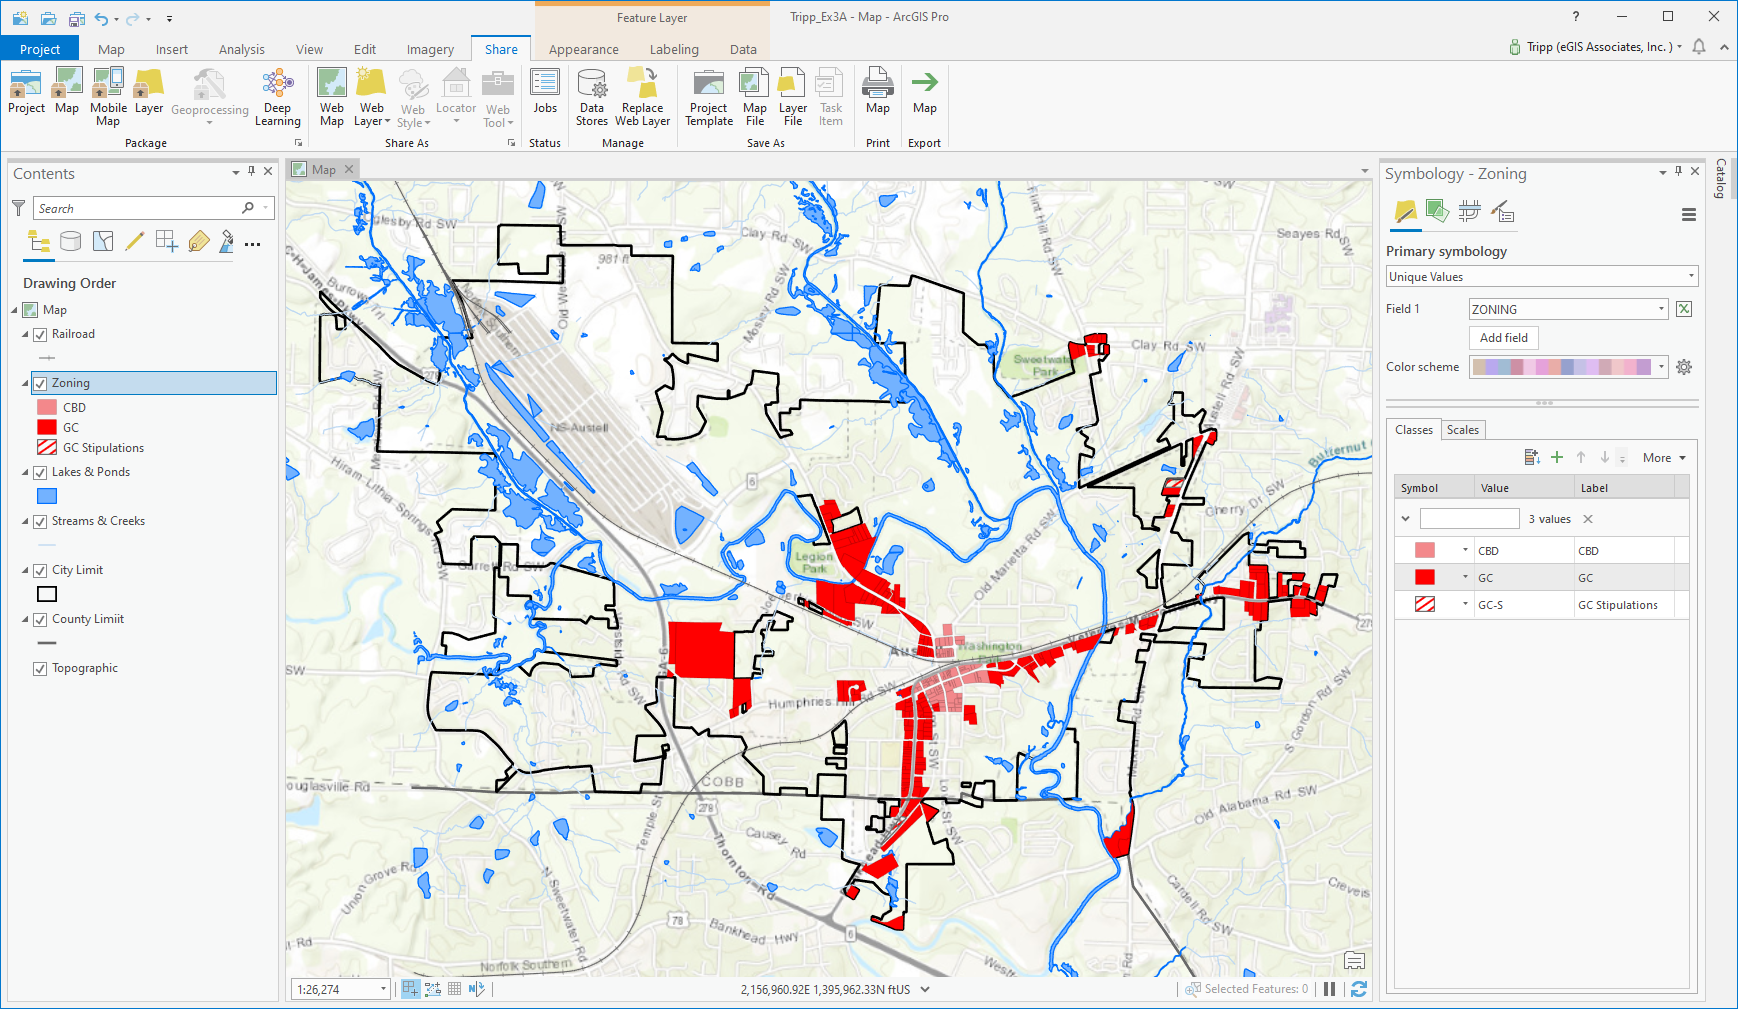
- In the Symbology pane, select the row containing the Government Land value. It is located just below GC-S.
- Holding your Shift key down, select the last row containing the OS value so you have all values from Government Land to OS selected.
- Right-click on one of the selected rows and click on Remove from the menu that appears.
You have now isolated the commercially zoned parcels within the city, as requested by your director. Your map should now look like this:
- Once you have verified your map is correct, close the Symbology pane.
Step 4 – Saving a layer file
As you have now experienced, it took some effort to get the Zoning layer configured so it only displayed commercially zoned properties. So, to ensure you can easily retrieve these settings in the future, you will now create a layer file:
- Select the Zoning layer in the Contents pane if needed.
- Click on the Share tab in the ribbon.
- In the Save As group, click the Layer File tool. This will open the Save Layers As LYRX File window.
- In the left panel of the window, expand the Computer option so you can see all available choices.
- Select (C:) from the list of resources. If you installed the exercise data on a different drive or location, select the appropriate drive.
- Scroll down and double-click on the Student folder in the panel on the right side of the window.
- Continue navigating to the IntroArcGISPro | My Projects folder.
- Once you are in the My Projects folder, name the new layer file Commercial_Only_ Zoning, as illustrated in the following screenshot:
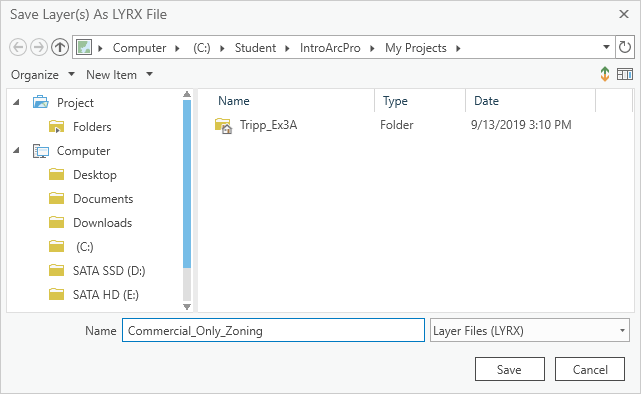
- Once you have verified your file location and name, click the Save button to create your new layer file.
You have now created a new layer file. This will allow you to quickly add this same layer to other maps with these same exact settings. You experienced this at the beginning of the previous step when you added the Zoning layer to your map using a layer file. When you added the layer file, the Zoning layer was added to the map with the various Zoning classifications already symbolized.
Step 5 – Renaming your map
When you first created this project, the template you used automatically created a single map within the project that you have been working with. This single map was named Map automatically. Since a project can contain an unlimited number of maps, it is recommended that you provide each one with a unique name so users can easily identify which one they might need within the project:
- In the Catalog pane, expand the Maps folder by clicking on the small arrowhead so you can see its contents.
- Right-click on Map and select Rename from the menu that appears, as illustrated in the following screenshot:

An edit box should appear around the name. This will allow you to type in a new name for the selected map.
- In the edit box that appears around the name, type Commercial Zoned Prop. Press your Enter key when done.
- In the Content pane, look at the name of the map located at the top of the layer list. It should reflect the new name you just entered.
The Catalog pane is just one location that allows you to change the name of a map. You can also right-click on the map name in the Contents pane and select Properties. Then open the General tab in the MapProperties window and type in a new name. Double-clicking on the map name in the Contents pane will also open the Map Properties window.
- If you are not continuing to the next exercise, save and close your project. If you are continuing, just save your project and continue.
Congratulations! You just created a new map that shows all the parcels in the city that are zoned for commercial use. This required you to add a layer using a layer file. Then you had to filter out all the non-commercial zoned parcels by removing those symbology values.
Exercise 3B – Adding a new map to a project
In the last exercise, you created the first map asked for by the Community and Economic Development Director. Now you need to create the second map. This map needs to show those commercial properties over 1 acre in size, but less than 3 acres. You will use the map you created in the last exercise as a starting point by copying it.
Step 1 – Creating the new map in a project
In this step, you will create a new map in your project by copying the map you created in the last exercise:
- If you closed ArcGIS Pro at the end of the last exercise, start the application and select the project you created in the previous exercise from the list of recently opened projects. It should be named Your Name_Ex3AB in the C:StudentIntroArcProMy Projects folder.
- In the Catalog pane, expand the Maps folder and right-click on the Commercial Zoned Prop map you created in the previous exercise. Then select Copy from the menu that appears.
- Again, in the Catalog pane, right-click on the Maps folder and select Paste, as shown in the following screenshot:
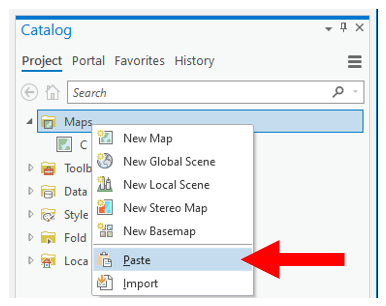
As you can see in the preceding screenshot, a New Map should appear in the Maps folder, named Commercial Zoned Prop 1. This new map is an exact copy of the map you created in the previous exercise. Starting with this copy will reduce the amount of effort needed to create the second map the Community and Economic Development Director has requested, which should only show commercially zoned properties greater than 1 acre but less than 3 acres in size. Next, you need to rename the new map you just created so it is not confused with the original.
- Right-click on the new map you just created in the Catalog pane and select Rename from the menu that appears.
- In the edit box that appears around the map name, rename the map as Commercial Between 1 to 3 acres and press Enter when you are done typing.
- In the Catalog pane, right-click on the map you just renamed and select Open. The map should now appear in the view area of the ArcGIS Pro interface.
- Save your project to ensure you do not lose any of the work you have done so far.
Step 2 – Filtering a layer with a definition query
Now that you have created the new map in your project, you need to filter the Zoning layer so it only shows those commercially zoned properties larger than 1 acre and less than 3 acres:
- Right-click on the Zoning layer in the Contents pane and select Properties.
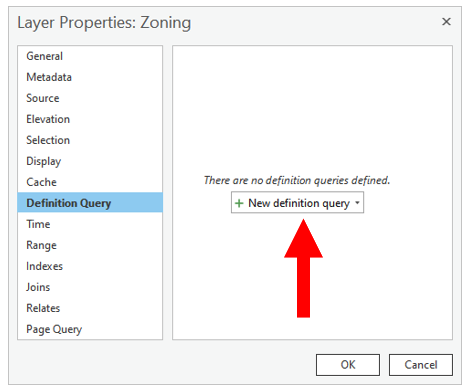
- Select Definition Query in the right panel in the Layer Properties window.
- Click on the New Definition query button located in the center of the right panel, as illustrated in the following screenshot:
- In the drop-down box located to the right-side of Where, select ACRE_DEEDE.
- In the next drop-down box, set the operator to is greater than.
- Type 1 in the next box in the query builder.
- Verify your query looks like the following screenshot:
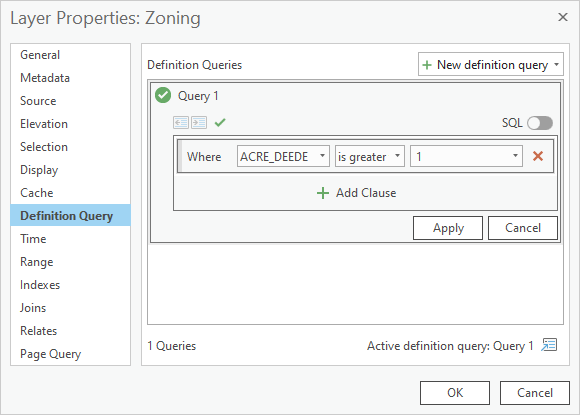
You have just built a query that will filter the Zoning layer so only those properties with a deeded acreage greater than 1 acre will be displayed. This is one part of what the director wanted to see. You now need to expand this query so it also filters out any properties greater than 3 acres.
- Once you have verified the query, click the Add Clause option located below the query you have already built. Another line should appear below the clause you have already built.
- Using that same process adds another clause that states ACRE_DEEDE, is less than, and 3. It should look like the following screenshot:
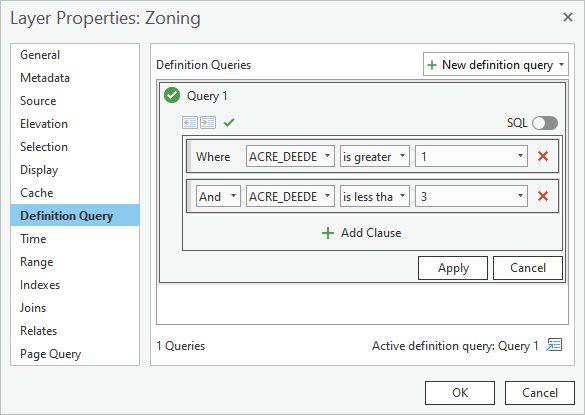
- Once you have verified your query has been built correctly, click Apply and then OK to apply the definition query.
You have just added a filter to the Zoning layer so only those commercially zoned parcels that are over 1 acre and less than 3 acres in size are shown on the map. However, you need to add some more layers to place the zoning information into context. Let's do that now.
- Save your project.
- Expand theDatabasesfolder in the Catalog pane.
- Expand the Trippville_GIS database and the Base feature dataset so you can see their contents.
- Right-click on the Parcels feature class and select Add to Current map from the menu that appears, as shown in the following screenshot:

As you can see in the preceding screenshot, the new Parcels layer should appear on your map. It will be added above the Zoning layer because it is a new polygon layer. You may notice that the Parcels layer is hiding the Zoning layer. So you now need to move the Parcels layer below the Zoning layer in the layer list.
- In the Contents pane, drag the newly added Parcels layer below the County Limit layer. You can now see the commercially zoned parcels that are between 1 and 3 acres in size and how they relate to the rest of the parcels in and around the city.
- Since ArcGIS Pro assigns a random color to new layers, you may need to adjust the symbology for the parcels layer so that the commercial zoning stands out more. Using the skills you have learned so far, adjust the symbology for the parcels so that it does not overpower the other layers, specifically the Zoning layer.
- To also help the Zoning layer stand out more, you need to change your basemap. Click on the Basemap button on the Map tab. Select the Light Gray Canvas.
- Click on the name for the Zoning layer so the edit box appears around it. Rename the layer to Commercial Properties 1 to 3 AC.
- Right-click on the City_Limit layer and select Zoom to Layer.
- In the Scale box located on the bottom left side of the map view, type 24000.
Your map should look similar to the map shown in the following screenshot, although the color of the parcels may be different depending on what you chose:

- After you have verified that your map looks similar, save your project.
Step 3 – Adding annotations to the map
You have now successfully created the map the director asked for. However, after reviewing it with you, he has decided he wants to see road names and points of interest added to the map as well.
Luckily, you already have an annotation feature class in the Trippville_GIS database that contains these. You will now need to add that annotation geodatabase to your map:
- Expand the Databases folder in the Catalog pane and then expand the Trippville_GIS geodatabase so you can see its contents.
- In the Trippville_GIS geodatabase, expand the Base feature dataset so you can see the feature classes it contains.
- Click on Base_Anno and drag it into the map view to add it to your map.
- In the Contents pane, right-click on the City_Limit layer and select Zoom to Layer from the menu that appears.
- In the ribbon, click on the Map tab. Next, click on the Bookmarks button and select New bookmark.
- In the Create Bookmark window, name your new bookmark as Entire City. Then add This bookmark will zoom the map to the extents of the City_Limit layer as the description. Lastly, click OK to create the new bookmark.
Bookmarks allow you to return to a specific location and scale within a map. They are very useful to ensure you can print a map at a specific scale or review specific locations during a meeting.
- In the Map tab in the ribbon, select the Explore tool.
- Zoom into your map until you are able to clearly see the annotation layer you just added.
- Click on Bookmark again. This time, select the entire city to return your map to the original view.
- Save your project.
You have now successfully created the two maps requested by the director. You created the first map, which showed all the commercially zoned parcels within the city. You then created a new map that limited the commercially zoned parcels shown to only those between 1 and 3 acres in size.
Exercise 3C – Using map and layer files
The director has decided he wants an additional map added to this project. He needs to know the location of the city's sewer system in relation to the commercial properties that are between 1 and 3 acres in size. This is because the new business wants to be able to connect to the city's sewer system.
Luckily, you have a map file of the city's sewer system that was created for another project. This will serve as a great starting point for this new map you need to add to your project. Map files allow you to share previously created maps so they can be used in other projects without having to start over from scratch.
Once you import the map file, you will then need to add the commercial properties that are between 1 and 3 acres. To make that easier, you will create a layer file from the map you just created and then use that file to add the layer to the sewer map.
Step 1 – Adding a new map using a map file
In this step, you will add a map of the city of Trippville's sanitary sewer system using an existing map file. This will add a new pre-configured map to your project. You will now add items to the map:
- If you closed ArcGIS Pro after the last exercise, launch the application and open the project %Your Name%Ex3A.
- Right-click on the Maps folder in the Catalog pane and select Import from the bottom of the menu that appears.
- In the Import window, select Folders located under Project in the left panel of the window. If you do not see Folders, you may need to expand the Project tree by clicking on the small arrowhead located to the left.
- Double-click on the Chapter3 folder in the right panel of the Import window.
- Select the Sanitary Sewer Map.mapx file and click OK.
Your project should now have a new map that shows the location of the Trippville sewer system, as in the following screenshot:

Let's move on to the next step to learn about creating a layer file and using it.
Step 2 – Creating and using a layer file
Now you need to add a layer showing the location of the commercial properties that are between 1 and 3 acres in size. You will create a layer file from the previous map you created and then use this layer file to add the new layer to the sewer map:
- Select the tab for the Commercial Between 1 to 3 acres map located at the top of the view area of the interface.
If you closed this map after the previous exercises, you will need to open it. To do that, expand the Maps folder in the Catalog pane and right-click on the Commercial Between 1 to 3 acres map. Then select Open from the menu.
- Right-click on the Commercial Properties 1 to 3 AC layer in the Contents pane. Go to the Share option and choose Save as Layer File. The Save Layer(s) As LYRX File window will open.
- Select Folders in the left panel under Project. Double-click on the Chapter3 folder in the right panel of the window.
- Name the new layer file as Commercial Prop 1 to 3AC and click Save. If asked whether you wish to overwrite an existing file, click Yes.
- Click back on the Trippville Sanitary Sewer Map tab at the top of the view area to activate it.
- Click on the Add Data button located in the Map tab on the ribbon.
- Select the Folders | Chapter3 folder.
- Select the Commercial Prop 1 to 3AC.lyrx file you created and click on the OK button.
You have just added to your map a layer showing the commercial properties that are between 1 and 3 acres in size that are located in the city. Now, the director will be able to see which of those parcels is near the sewer system and thus be able to connect to the city's sewer service. Using the layer file made adding this new layer much easier and ensured that the symbology is consistent with the other maps within the project.
Step 3 – Labeling the pipe sizes
Now, the director wants you to label the pipe sizes for the sewer system so he can ensure there is enough capacity to handle the load the new business may add to the system. You need to turn on and configure labeling for the sewer line layer:
- Select the Sewer Lines layer in the Contents pane.
- Now you need to determine which field contains the size of the sewer pipes. Right-click on the Sewer Lines layer and select Attribute Table. This will open the attribute table in a pane located below the main map view.
- Scroll through the available attribute fields to determine which field contains the pipe size.
- Close the attribute table for the Sewer Lines layer.
- Ensure the Sewer Lines layer is still selected in the Contents pane. Then, click on the Labeling tab in the ribbon.
- Click on the Label button to turn on the labels for the Sewer Line layer.
- Set the Field to the one you identified in the previous question.
- At the current full view of the map, it is hard to read the pipe sizes. So, you will set a scale visibility range for the labels that will allow them to become visible at a scale that makes them easier to read. In the drop-down list located next to Out Beyond on the Labeling tab, in the Visibility Range, select 1:10,000. The size labels should disappear.
- Zoom in until the size labels appear.
- To make the pipe size labels stand out a bit more, make them bold and adjust the color on the Labeling tab in the Text Symbol group tab.
- The placement of the labels is not optimum, so you need to adjust the placement. Click on the small arrow with the line above it in the Label Placement group tab. You should see several placement options listed that were not shown before.
- Select the Water (Line) placement option.
We will now move on to the next step.
Step 4 – Configuring label conflict and placement options
You have successfully added the pipe size labels to your map. However, there are some additional configuration options that might improve how they look and perform. You will now make some adjustments to these:
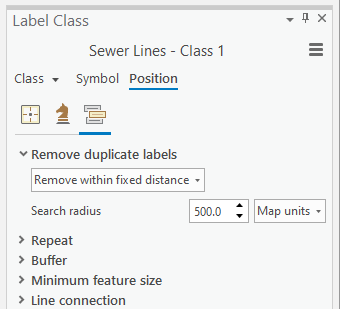
- Right-click on the Sewer Lines layer and select Label Properties. This will open the Label Class pane on the right side of the interface. This pane allows you to make further adjustments to the labeling configuration settings to refine their appearance.
- Click on the Position tab located near the top of the pane. Then select the Conflict Resolution icon, which looks like three textboxes stacked on top of one another.
- Expand Remove duplicate labels in the Label Class pane.
- In the drop-down menu that appears underneath, select Remove within a fixed distance.
- Set the Search radius to 500 and the units to Map units. It should look like this:
That makes the labels appear a little less cluttered. However, you are not done yet. There are still some adjustments that will improve the labels further.
- Expand the Minimum feature size option in the Label Class pane.
- Set the Minimum for labeling size to 100 and the units to Map units. This will further reduce the clutter in the map.
- Save your project and close ArcGIS Pro unless you wish to attempt the following skill challenge or try applying other labeling option settings on your own.
Continue to try other labeling options to see how they impact the placement of the labels and the overall appearance of the map. Pan and zoom to other places on the map to see whether your settings still work well in different locations.
Skill challenge
The Community and Economic Development Director was very impressed with the maps you created – so much so that he has another project that he would like your help with. A company would like to open a new manufacturing center within the city, so they are looking for a parcel that has a zoning classification of "light or heavy industrial" that is situated near the railroad, and can easily be provided with both water and sewer services. The parcels need to be 5 to 10 acres in size.
Using the skills you have learned, create a new project that contains the following maps for this scenario:
- A map showing the location of all heavy and light industrial properties within the city (zoning codes HI and LI).
- A map showing the location of all industrial-zoned parcels between 5 and 10 acres in size.
- A map showing the location of industrial-zoned parcels between 5 and 10 acres along with the sewer system. Symbolize and label the sewer system the same way you did in Exercise 3C.
- A map showing the location of the industrial-zoned parcels between 5 and 10 acres, along with the water lines and fire hydrants. Symbolize the water lines based on their size. The symbology for the fire hydrants is up to you.
Summary
In this chapter, you learned how to create a new project and add multiple 2D maps to it. You were introduced to several methods to add new maps to your project including using a project template, adding a blank map, and using a pre-configured map file. Once you created the maps, you then used various methods to add new layers.
These skills form the foundation needed to be a successful user of ArcGIS Pro. Without maps, you are not able to make use of some of the more advanced capabilities of ArcGIS Pro such as performing data edits, analyzing data, and sharing your data with others either via printed maps or digital formats. All of these capabilities start with a map.
In the next chapter, you will continue to build on these skills. You will learn how to create 3D maps that allow you to view data in a more realistic-looking environment. The ability to view data in 3D is an enhancement ArcGIS Pro provides over Esri's older desktop software, which did not allow users to view data in 3D natively.
Further reading
If you would like to explore the concepts covered in this chapter in greater detail, the following resources are recommended:
- Mapping with ArcGIS Pro, by Amy Rock and Ryan Malhoski
- Adding Symbology Styles to ArcGIS Pro, a video from eGIS Associates, available at https://www.youtube.com/watch?v=iBfmcbsZg2A&list=PLKPzofPslSJ_xlzX35oBwE0PPJc0SB41e&index=13&t=12s
- ArcMap vs ArcGIS Pro - Comparing these two GIS applications from Esri, a video from eGIS Associates, available at https://www.youtube.com/watch?v=4_OOOQbLZDU&list=PLKPzofPslSJ_xlzX35oBwE0PPJc0SB41e&index=12&t=234s