Oracle WebLogic Server's runtime execution environment is, as you probably know, running with Java.
Every WebLogic Server instance is running inside its own dedicated area on the physical server, getting its own allocation of processor time and memory allocation.
The area we're going to talk about in this chapter is called Java Virtual Machine (JVM).
In this chapter, there will be some secrets revealed for you! Have fun!
WebLogic can be used for a wide variety of applications, from small applications to very large applications. The JVM is Java's execution environment on a server or client. JVM runs on top of the machine's OS and Java programs can be executed in it.
The JVM is the environment in which Java programs execute. It is the software that is implemented on non-virtual hardware and on standard operating systems.
JVMs are available for many hardware and software platforms, also in a middleware environment such as Oracle WebLogic. The use of the same byte code for all platforms allows Java to be described as "portable". A JVM also enables features such as automated exception handling, which provides "root-cause" debugging information for every software error (exception), independent of the source code.
A JVM is distributed along with a set of standard class libraries that implement the Java Application Programming Interface (API). Appropriate APIs bundled together form the Java Runtime Environment (JRE).
Some facts about JVMs are:
- JVM was originally developed to run only Java. But as of now, it can run many languages. Languages supported by JVM are:
- Ruby, with JRuby
- JavaScript, with Rhino
- Python, with Jython
- Common Lisp, with Armed
- It makes Java code portable across operating systems
- Java Virtual Machine (JVM) runs on top of the machine's OS and Java programs can be executed in it
- JVM is a bytecode interpreter that reads and executes all Java classes
- Each OS has its own version of a virtual machine (Windows, Linux, Solaris, AIX)
- Multiple JVM providers (Sun, Bea/Oracle (JRockit), IBM)
- Runtime behavior
- Each virtual machine runs as an operating system process
- Inside JVM, work can be executed concurrently through the threading model
- Unused Java objects are automatically destroyed by the garbage collector
The Java memory model is explained in the JSR 133 description. The original Java memory model, developed in 1995, was widely perceived as broken, preventing many runtime optimizations and not providing strong enough guarantees for code safety. It was updated through the Java community process, as Java Specification Request 133 (JSR-133). It tries to explain the memory model in detail and shows how the JVM deals with threads and the memory. The specification attempts to explain how incorrectly-designed applications can behave in erroneous ways because the JVM implementation might optimize the program so that it runs faster.
A memory model defines the possible scenarios and rules that govern multiple threads in a system. A memory model determines if the execution trace of a program is legally allowed by the JVM. The Java specification does not force JVM implementations to follow any particular implementation rule for program execution; this gives flexibility to the JVM implementer to provide compiler optimizations and reorganizations in the execution order. However, the memory model specifies that all implementations produce results that can be predicted by a programmer. The memory model defines the possible rules for threads and the expected behavior of multi-threaded programs so that programmers can design their programs accordingly. The responsibility of avoiding data races and deadlock conditions in threads still lies with the implementer and the programmer.
Java's execution environment is also known as the Java Runtime Environment (JRE).
Programs intended to run on a JVM must be compiled into a standardized portable binary format, which typically comes in the form of .class files. A program may consist of many classes in different files. For easier distribution of large programs, multiple class files may be packaged together in a .jar file (Java archive).
The Java executable offers a standard way of executing Java code. The JVM runtime executes .class or .jar files, emulating the JVM instruction set by interpreting it, or using a just-in-time (JIT) compiler such as Oracle's Sun HotSpot. JIT compiling, not interpreting, is used in most JVMs today to get better performance. There are also ahead-of-time (AOT) compilers that enable developers to precompile class files into native code for particular platforms.
Like most virtual machines, the Java Virtual Machine has a stack-based architecture. The JVM also has low-level support for Java-like classes and methods, which amounts to a highly sophisticated memory model and capability-based architecture.
The following diagram shows a schematic overview of a working JVM:
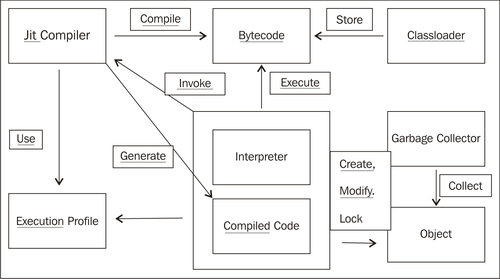
The JVM is responsible for loading and executing code. It uses a Classloader to load Java classes into the Java runtime environment. Classloaders are designed so that at start-up the JVM doesn't need to know anything about the classes that will be loaded at runtime. Almost all Java-based containers, such as EJB or servlet containers, implement custom Classloaders to support features such as hot deployment.
Bytecode is a step between your source code and actual machine code. The JVM is what takes the bytecode and translates it into machine code. The JVM has an instruction set, just like a real machine. The name given to this instruction set is Java bytecode. The first implementation of the Java Virtual Machine, done at Sun, emulated the Java Virtual Machine instruction set in software hosted by a handheld device. The Java Virtual Machine does not assume any particular implementation technology, hardware, or OS.
The Java Virtual Machine knows nothing of the Java programming language, but only of a particular binary format, the class file format. A class file contains Java Virtual Machine instructions (or bytecode) and a symbol table, as well as other ancillary information.
Regarding security, the Java Virtual Machine imposes strong format and structural constraints on the code in a class file. However, any language with functionality, that can be expressed in terms of a valid class file, can be hosted by the Java Virtual Machine. Attracted by a generally available, machine-independent platform, implementers of other languages are turning to the Java Virtual Machine as a delivery vehicle for their languages.
Both of the JVM providers that Oracle ships with WebLogic Sun HotSpot and BEA JRockit use different threading models.
BEA JRockit uses both native and green (thin) threads. This is the practice where one instance of an underlying thread representation, represents several threads of a higher abstraction layer (such as java.lang.Threads). While this is simple and fast for uncomplicated applications, there are plenty of problems with this approach. The most serious one has to do with handling threads and the acquisition of locks. In native code, where no control can be exerted over the threads, or when threads are waiting for I/O, deadlocks can occur. If the need arises to put a green thread to sleep, usually the entire OS thread below it has to go to sleep as well.
Sun HotSpot uses native threads. Native threads use the operating system's native ability to manage multithreaded processes; in particular, they use the pthread library. When you run native threads, the kernel schedules and manages the various threads that make up the process. Sun HotSpot relies completely on whatever threads a particular OS offers. On Solaris they are lightweight processes (LWPs), on Linux they are just first-class processes. So, if you run a multithreaded Java app and execute ps, you see a whole lot of processes for just a single JVM. The newer kernels are different in listing the threads as processes and put them as an entry in /proc filesystem. On Windows, they are windows threads. So context switching is performed naturally, by the OS.
Native threads create the appearance that many Java processes are running, and each thread takes up its own entry in the process table. One clue that these are all threads of the same process is that the memory size is identical for all the threads they are all using the same memory.
Green threads emulate multithreaded environments without relying on any native OS capabilities. They run code in user space that manages and schedules threads; Sun wrote green threads to enable Java to work in environments that do not have native thread support.
On multi-CPU machines, native threads can run more than one thread simultaneously by assigning different threads to different CPUs. Green threads run on only one CPU.
Oracle WebLogic ships two JVMs in its product Sun HotSpot and BEA JRockit. As you can see in the following screenshot, during installation you can choose which JVM you want to use.
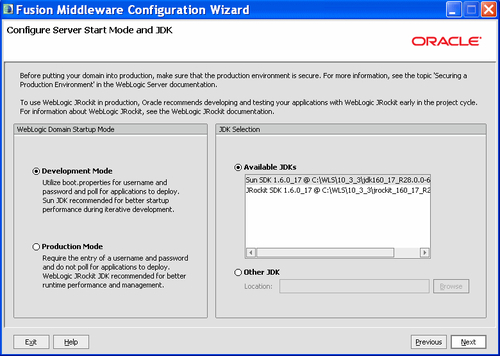
It perhaps sounds a bit strange to choose between two different products practically serving the same purpose.
In 2008 and 2009, Oracle made some large acquisitions, that resulted in taking over two big companies, BEA and later on Sun. Both developed their own JVM, and to this day Oracle still hasn't merged the two products into one, so you are still able to choose between them.
As of the time of writing this book, the merge still hasn't taken place, but it probably will occur somewhere in mid 2012.
In this mechanism, the bytecode is read and then translated into machine language, but these results are not saved in the memory. So even if the same method is run again and again, the JVM has to translate the code into machine language every time. This means that the machine code will not be reusable as it is not saved anywhere in the memory.
JIT mechanism means, once a method is run, that the bytecode is translated to machine language and this is saved in the memory. This means that if the method is run again, there is no need for translation and the machine code is reused.
Because of the interpreter mechanism used by the Sun JDK, the startup time for the server is faster because it does not have to save the machine code in memory. Once the translation is done for a method, it moves to the other one. However, Oracle JRockit saves the code, hence starting up takes longer. For the same reason, Oracle JRockit uses more memory than Sun JVM.
In the long run, JRockit gives a slightly better performance as compared to Sun. Oracle JRockit optimizes the code. It identifies the HOT SPOTS, that is, the methods that are being run more often. These methods are then queued up for optimization. This code is then optimized, which improves performance. Many issues arise because of the code optimization mechanism as it is a complex procedure. Optimization can be disabled.
JIT is also used by Sun JDK, but that was in the earlier versions. The Java HotSpot VM removes the need for a JIT compiler in most cases.
The JVM memory consists of the following segments:
What are memory spaces? Memory is managed in generations, or memory pools holding objects of different ages. Garbage collection occurs in each generation when the generation fills up. Objects are allocated in a generation for younger objects, or for the young generation, and because of infant mortality most objects die there.
Sun JDK has the following memory spaces: Eden space, survivor space, tenured generation, and permanent generation. The objects move from one space to another according to their age and survival from garbage collection.
JRockit has two spaces: young generation and old generation. It uses the same mechanism of garbage collection. JRockit doesn't have a permanent generation.
JRockit provides advanced JVM tunings. After the release of R26, JRockit now takes care of a few of the tunings by itself. For example, if there is an "out of memory" occurring on the native TLA in previous releases due to insufficient TLA size which is 2k by default in the later releases JRockit tunes these settings as per the requirement of the application.
The TLA or Thread Local Area is some free space reserved in the JVM and dedicated to a thread for its exclusive use. A thread can allocate small objects in its own TLA without synchronizing with other threads.
Perhaps these terms sound a bit confusing for you, but if you become a more experienced administrator, it's good to know where the differences lie between the two JVMs.
Oracle recommends using the Sun JVM in development mode and JRockit in production mode.
JRockit was always built more for server environments, while Sun's HotSpot was more focused on client side JVMs. The result was that JRockit always had a better overall performance and some more advanced diagnostic tools.
Today, the difference between them has decreased and choosing Sun JVM is almost as good as choosing JRockit. For now, tooling is a major differentiator between the two.
When JRockit crashes, a JRockit dump is produced, which basically has the reason for the crash. JRockit uses native libraries by default. Native libraries are libraries outside the Java code, and used by the OS or other programs as well. This can be disabled by disabling the Native IO from the Admin console. The most common reason for the JRockit crash is the conflict between native libraries, for example the jdbc type 2 drivers which use native libs. It is recommended to use type 4 pure Java drivers when using Oracle JRockit. The stack trace in the JRockit dump will show the exact cause. When the JVM crashes, it is important to test it again by disabling code optimization and checking if the issue still persists.
A Sun JVM crash produces a hs_err_pid file, which has the root cause of the crash. There can be several reasons for a Sun JVM crash, such as some bugs (defects in the code of the JVM). These issues need to be reported to the Sun team.
Sun JDK that comes bundled with WebLogic Server provides tools such as JConsole, which can be used for performance tracking and monitoring the memory in use, by the JVM. This tool is very helpful to determine each and every detail about the memory being used by the application, CPU usage, and memory leaks.
Oracle JRockit has a much more advanced tool, JRMC (JRockit Mission Control), which provides advanced tracking features. JRA recordings can be taken, that give every detail about the JVM arguments, garbage collection details, methods using the maximum memory, and so on. The memory leak detector tool in JRMC is also another important and very helpful tool. These features make it easy for the user and administrators to maintain a record and identify the issues with the application and the JVM.
In the previous section, we took a closer look at the JVMs that could be used within Oracle WebLogic. But where can we position the JVM?
In fact, every WebLogic Server instance is a running JVM. Every Admin Server in any domain executes within a JVM. The same also counts for Managed Servers as explained in Chapter 5,Managed Servers and the Node Manager.
The following diagram gives a schematic overview of a running JVM. Note the different memory options that you can add to the start parameters of the JVM.
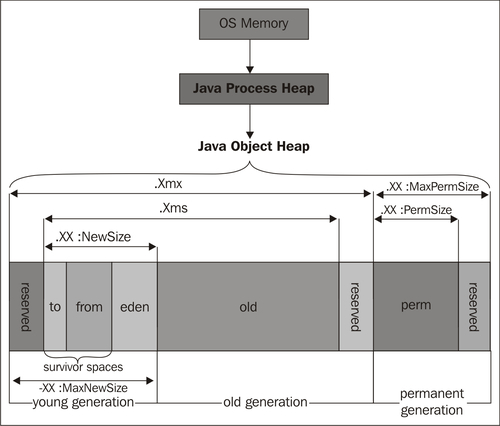
The previous diagram shows an overview of the configured MaxSize (Xmx) spanning the entire JVM. The initial memory size (Xms) is configured to a lower value. The terms in the previous diagram are explained as follows:
- Young generation space: It is meant for recently created objects.
- Eden space (heap): It is the pool from which memory is initially allocated for most objects. It is part a of the young generation.
- Permanent generation (non-heap): It is the pool that contains all the reflective data of the virtual machine itself, such as the class and method objects. With Java VMs that use class data sharing, this generation is divided into read-only and read-write areas.
- Old generation space: This stores surviving objects that have lived to some extent.
If objects get too old, or young generation space gets filled up, JVM promotes objects to the old generation space. When the old generation space gets filled up, the JVM performs a major collection to remove the unused objects and reclaim their space. A major GarbageCollect takes a significant amount of time and can affect system performance.
When you create a Managed Server, it takes its initial startup parameters from the setDomainEnv.sh/cmd file, which resides in the<DOMAIN_HOME/bin directory.
By default two parameters are set:
Xms:The initial heapsizeXmx:The max heapsize
A good practice for many applications is to set equal initial and max heapsize.
When you set -Xms1G -Xmx2G, the committed heap (that is the physical heap that we will actually use) starts at 1G. This means that there are pages of memory that contain the state of the 1G heap. Whether those pages are physically on RAM or are in swap is something that the JVM does not explicitly control. It's something that the OS controls, and it depends on the environment (memory pressure) and the state of the host, so it could reserve the remaining for other tasks. In this case, it is an advantage if the JVM claims the entire RAM at once.
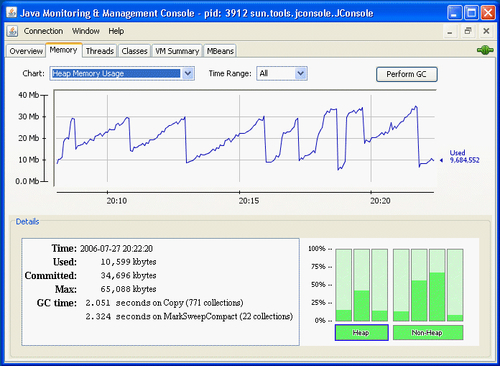
In short, setting -Xms does what it says on the box, that is, it sets the initial memory pool sizes to the value. After that, Java just resumes its normal behavior of allocating memory. This is shown in the next screenshot:
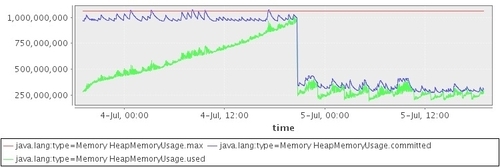
As you can see in the previous screenshot, when you specify -Xms to be the same as -Xmx, the blue line immediately starts out at the maximum level. It stays up there for a while, but after that the blue line drops sharply. From then on, Java does what it always does it allocates and de-allocates memory from the operating system.This behavior seems to be controlled from the PS MarkSweep garbage collector. Java leaves the committed memory (relatively) untouched, until a full GC is performed. The first full GarbageCollect coincides with the sharp drop in committed memory. In the full GC, it ignores the -Xms setting and returns a large portion of the feed.
There are four options to set your Managed Server JVM options:
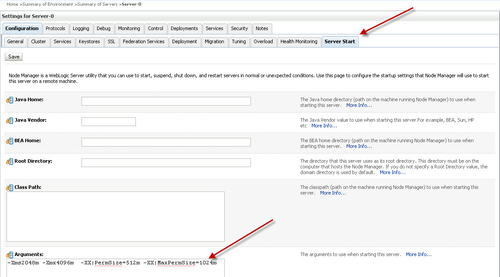
- Through the Admin console, in the Server Start tab
- In the
startManagedWeblogicscript - In the
SetDomainEnvscript - In the
java Weblogic.Servercommand
When you click on the Servers tab, click on the Managed Server of your choice, and select the Server Start tab. In the options field, you can set any parameter that your Managed Server requires.
If you want to use the startup script to start your Managed Servers, then try to update the Managed Server script startManagedWebLogic.sh/cmd, which is under the<MW_HOME>/user_projects/domains/<DOMAIN_NAME>/bin directory, with the required heap size in JAVA_OPTIONS parameter.
For example:
JAVA_OPTIONS="-Xms2g -Xmx2g" ${JAVA_OPTIONS}
If you want to set it domain-wide, you can edit the setDomainEnv.sh/cmd script, which is also under the<MW_HOME>/user_projects/domains/<DOMAIN_NAME>/bin directory.
Sometimes only setting the Xms and Xmx arguments are not sufficient enough, so here are some additional arguments you can think of:
-Xms:The initial amount of heap allocated to the JVM-Xmx:The maximum amount of heap that this JVM can allocate-XX:NewSize(default 2 MB): Default size of new generation (in bytes)-XX:MaxNewSize:Maximum size of new generation (in bytes). Since 1.4, MaxNewSize is computed as a function of NewRatio-XX:NewRatio(default = 2): Ratio of new to old generation sizes-XX:SurvivorRatio(default = 8): Ratio of Eden size to one survivor space size-XX:TargetSurvivorRatio(default = 50%): Desired percentage of survivor space used after cleaning up-XX:MaxPermSize:Maximum size of the permanent generation
-Xms:The initial amount of heap allocated to the JVM.-Xmx:The maximum amount of heap that this JVM can allocate.-Xns:Size of the nursery generation in the heap. The nursery is an area of the heap where new objects are allocated. When the nursery becomes full it is garbage collected separately in a young collection.-XgcPrio:A priority level that helps to determine which GC algorithms the JVM will use at runtime(This option is also available in Sun JVM from Java 5).throughput:Maximize application throughout.pausetime:Minimize the length of Garbage Collect intervals.deterministic:Consistent response times.-XXcompactRatio:The percentage of the heap.
Although you're an excellent administrator and configurator, there are still issues that you might not have thought of yet, that could occur with your JVM. So let's discuss some of the common issues you could encounter:
JVMs trigger java.lang.OutOfMemoryError when there is insufficient memory to perform some task. An out of memory condition can occur when there is free memory available in the heap but it is too fragmented and not contiguously located to store the object being allocated or moved (as part of a garbage collection cycle).
A common cause of memory leak errors is excessive caching. JVMs trigger java.lang.OutOfMemoryError when there is insufficient memory to perform some task. An out-of-memory condition can occur when there is free memory available in the heap but it is too fragmented and not contiguously located to store the object being allocated or moved (as part of a garbage collection cycle).
You can identify and troubleshoot a JVM crash by the diagnostic files that are generated by the JVM. A snapshot is created that captures that state of the JVM process at the time of the error.
This binary file contains information about the entire JVM process and needs to be opened using debugging tools. The gdb debugging tool, popular on Linux, can extract useful information from core files. You can try attaching to the JVM process with GDB (gdb - [process id]) and get a backtrace (bt). You might be able to figure out where in your program the problem lies, from the current native code execution. To find the process, you execute: ps ef | grep java.
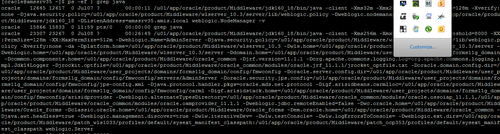
The following screenshot shows the output from GDB:
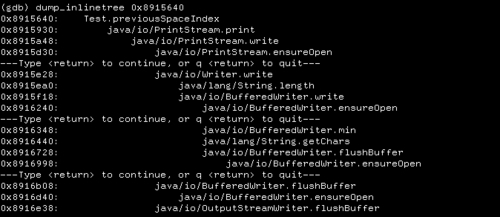
On the Sun JVM, the logfile is named hs_err_pid<pid>.log, where<pid> is the process ID of the process. JRockit refers to this error log as a dump file, and is named JRockit.<pid>.dump.
Basic JVM Tools
- Java Stack Trace: A Java stack trace is a snapshot of the threads and monitors in a JVM. A stack trace can have thousands of lines of diagnostics.
- Thread Dump: You can generate a partial Java stack trace, which in this case is only the thread's information, by using the
Thread.dumpStackmethod, or theprintStackTracemethod. Use the kill-3option to kill the JVM process. - Verbose GC: Add
-verbosegc -XX:+PrintGCDetailsto indicate a problem with garbage collection.
JRockit Mission Control has the following tools:
JRockit Mission Control has the following tools:
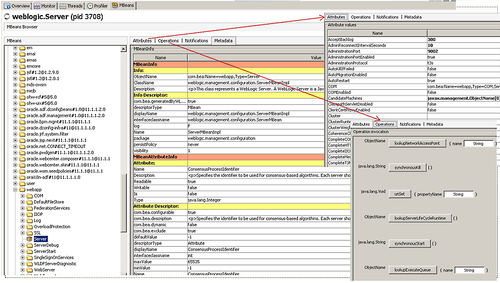
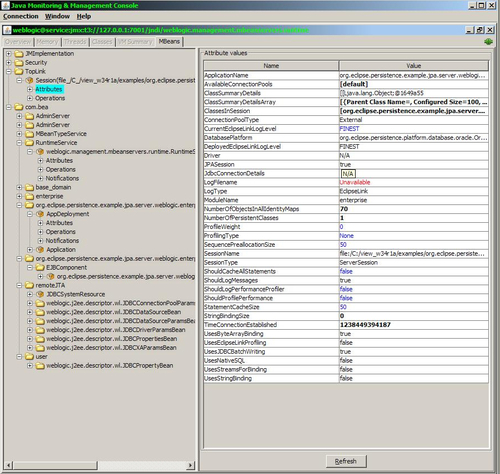
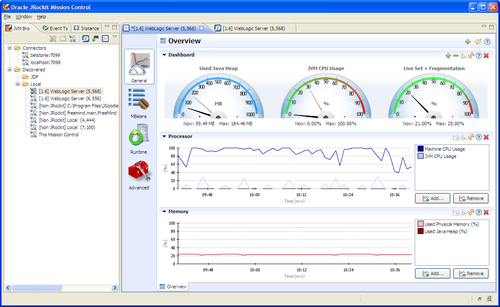
- The JRockit Management Console: This console can be used to analyze and monitor running instances of JRockit. It provides real-time information about the running applications.
The following screenshot shows the Mission Control Console.
- The JRockit Runtime Analyzer (JRA): This is built into the JRockit JVM. The tool collects data as your application runs, giving you information that is within the JVM itself.
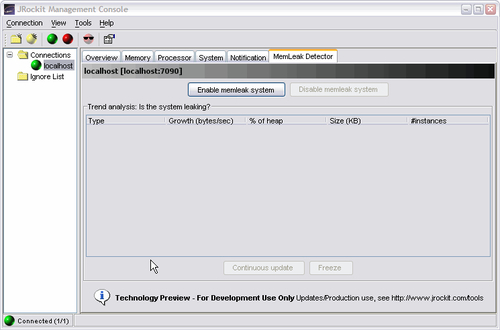
- The JRockit Memory Leak Detector (Memleak): This can be executed from the Management Console.
The following screenshot shows the memory leak detector; you can enable it by clicking the MemLeakDetector button, and the detector will spot for memory that has not been released.