Oracle WebLogic Server delivers a variety of tools, which an administrator can use to monitor, debug, and analyze behavior of the many components that WebLogic consists of.
This framework comprises a number of components that work together to collect, archive, and access diagnostic information. It gathers diagnostics real-time.

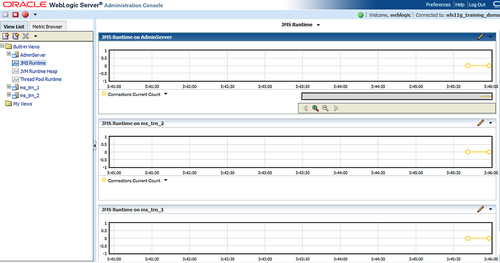
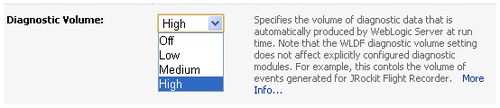
The following screenshot shows you the WLDF extension:
Logging services provide information about server and application events, based on which you can analyze the possible problems. This will be handled in Chapter 11,Configuring and Analyzing Logging.
Both shipped JDK's, JRockit and Sun's HotSpot deliver their own console to analyze the JVM behavior.
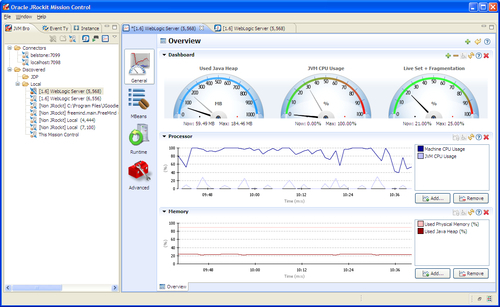
A nice console delivered with JRockit is the JRockit Mission Control.
It includes tools to monitor, manage, profile, and eliminate memory leaks in your Java application.
The following is a screenshot of JRockit Mission Control:
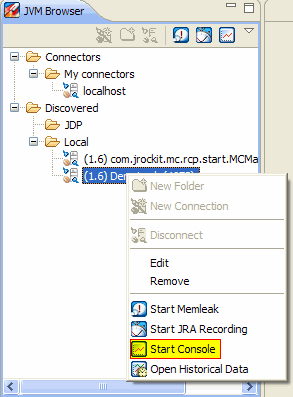
In here, you can create your connections to your WebLogic JVMs:
When connecting remotely, you should add the following start parameters for your JVM:
JAVA_OPTIONS="-Djava.rmi.server.hostname=<WebLogic Server> -Djavax.management.builder.initial=weblogic.management.jmx.mbeanserver.WLSMBeanServerBuilder -Xmanagement:ssl=false,authenticate=false,autodiscovery=true,port=7090"
export JAVA_OPTIONS
The port 7090 should be accessible from your own client.
Another useful option could be -XX:FlightRecorderOptions=defaultrecording=true, for having default recording when you connect.
There are several components to be found in JRMC such as:
- JRockit Browser: Browses several JRockit JVM instances and starts monitoring through the Management Console or the Memory Leak Detector.
- Historical Data: For trend watching; historical data is stored to get an overview over a longer period of time.
- JRockit Runtime Analyzer: To analyze recorded data with JRockit Flight Recorder.
- Memory Leak Detector: Detects memory leaks within your application.
- Management Console: To monitor live data from the JRockit JVM. This tool allows you to monitor the running Java application, create triggers that notify you when the condition is met and mail notifications.
There are two more things to get JRMC working with your WebLogic Server:
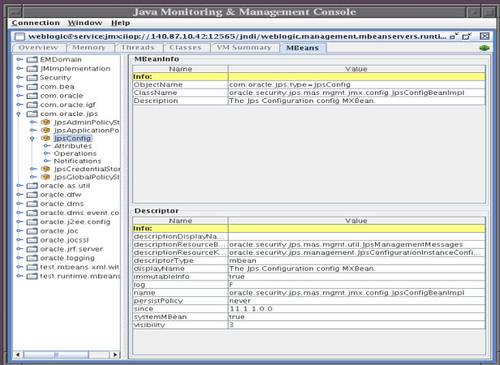
JConsole is shipped as part of the Sun JDK, and doesn't require any specific download or installation.
In order to connect to a WebLogic MBeanServer, JConsole needs to be started as follows:
jconsole -J-Djava.class.path=$JAVA_HOME/lib/jconsole.jar:$JAVA_HOME/lib/tools.jar: $WL_HOME/server/lib/wljmxclient.jar -J-Djmx.remote.protocol.provider.pkgs=weblogic.management.remote -debug
The previous code uses WebLogic's thin client classes. In some cases when you access server side classes, or you want to take full advantage of the t3 protocol, you are required to use WebLogic's thick client classes. To do so, you first need to build wlfullclient.jar as follows:
cd $WL_HOME/server/lib
java -jar wljarbuilder.jar
You can then start JConsole as follows:
jconsole -J-Djava.class.path=$JAVA_HOME/lib/jconsole.jar:$JAVA_HOME/lib/tools.jar: $WL_HOME/server/lib/wlfulclient.jar -J-Djmx.remote.protocol.provider.pkgs=weblogic.management.remote -debug
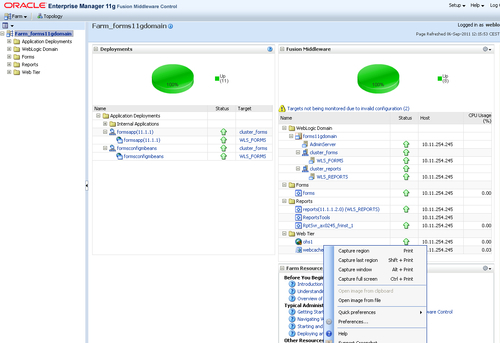
With a standard WebLogic Server installation, this component is not automatically installed. You will have to install ADF 11g runtime libraries and extend your domain with it.
When you have installed it, it's accessible through http://<wl_hostname:ip>/em.
The console has a rich set of tools such as performance overviews and extended diagnostic logging.
Basic WebLogic Server is not shipped with EM.