Visual Studio has great testing features and management tools for testing. These features are greatly improved from previous versions of Visual Studio. The Test Impact View is the new test management tool added to the existing tools, such as Test View, Test List Editor, Test Results, Code Coverage Results, and Test Runs from the main IDE.
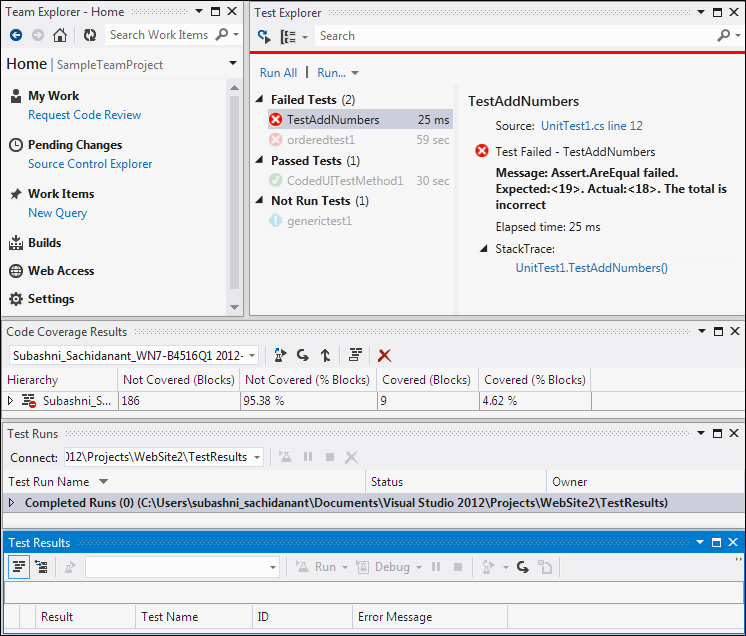
Visual Studio provides tools to create, run, debug, and view results of your tests. The following screenshot is the overview of the tools and windows provided by Visual Studio for viewing the test and output details:
Let us create a new Test Project using Visual Studio 2012 and then test a sample project to get to know about the tools and features:
Open Visual Studio 2012 and create a new solution. Let's not get into the details of sample application, AddNumbers, but create the Test Project and look at the features of the tools and windows. The application referred throughout this chapter is a very simple application for adding two numbers and showing the result.
Now in a similar way to adding the projects and code files to the solution, create the Test Project and test files and add the Test Project to the solution.
Select the solution and add a project using the shortcut menu options Add | New Project.... Then select the project type as Test from the list of project types under the language. Next select a template from the list. Visual Studio 2012 has three templates as follows:
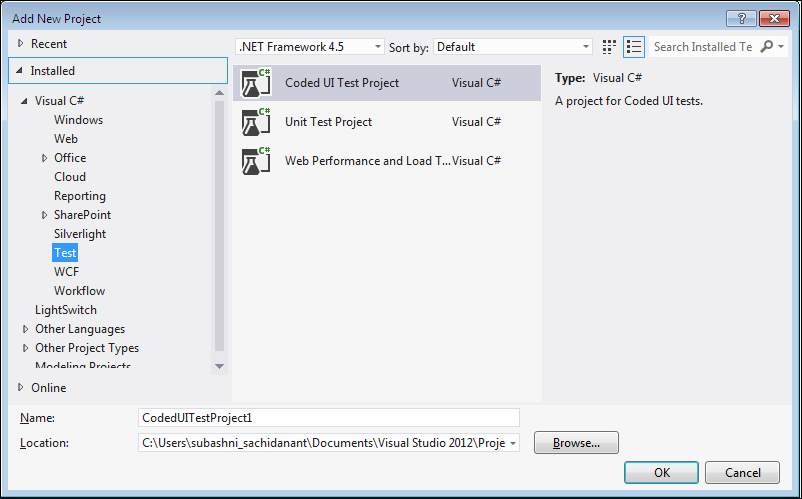
For the sample testing application, select the second option, Unit Test Project. This option creates the project and also adds the unit test to the project.
The first option creates a Coded UI Test to capture the UI actions and controls, and automate the testing by generating and customizing the code. The last option is to record the user actions and re-run the recording to test with validations and verification rules, use the recording to test the performance and stability of the system under multiple user load.
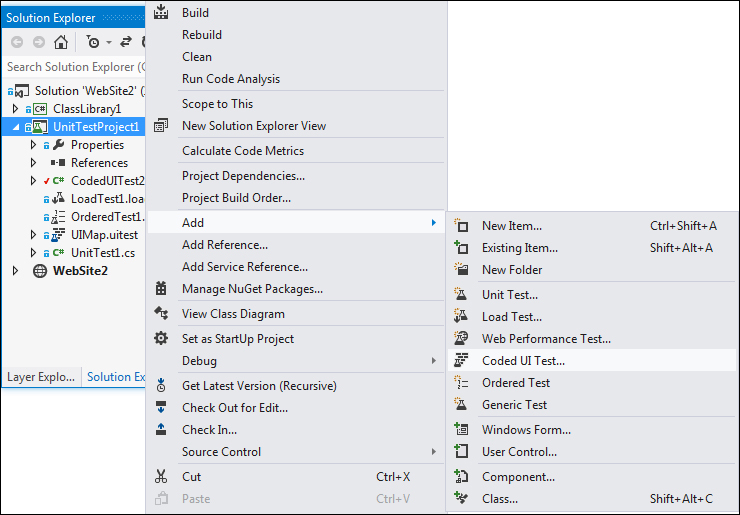
The Context menu from the project has the option to choose new tests. The menu provides six different options for creating and adding the tests. The following is the file extension for each of the Visual Studio test types shown in the preceding screenshot:
.vbor.cs: This extension is for all types of Unit Test and Coded UI Test..generictest: This extension is for the Generic Test type..loadtest: This extension is for the Load Test type..webtest: This extension is for the Web Performance Test type.
After selecting the test type, the test file gets created and added to the project with a default name and extension. Open the properties and change the name as required.
The next step is to use the Test Explorer window to view and run the tests that are created.
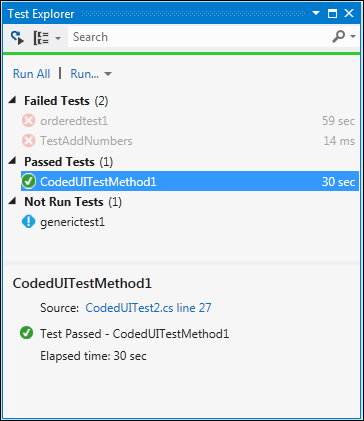
The Test Explorer window helps us to run tests from multiple projects in a solution. On building the Test Projects, the tests in each project appear in the Test Explorer window. To open Test Explorer, navigate to Test | Windows | Test Explorer. The tests are grouped into four different categories in Test Explorer, such as Failed Tests, Passed Tests, Skipped Tests, and Not Run Tests as shown in the following screenshot:
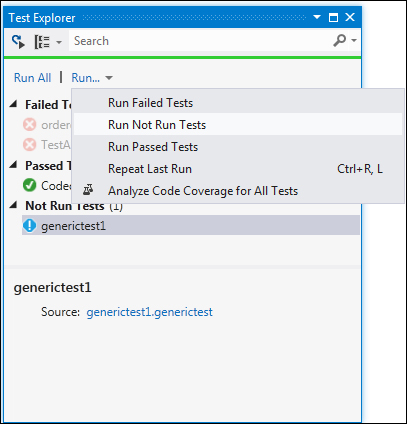
The Test Explorer window has the following options to run the tests:
- Choose Run All... to run all the tests in the solution
- Choose Run… and then a group to run all the tests under that group
- Select an individual test, open the Context menu, and then select Run Selected Tests to run only the selected tests
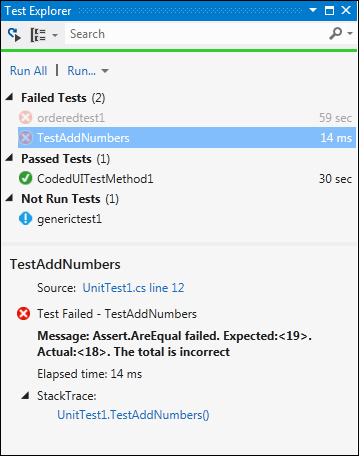
To view the details of the Test Run, select the test in the Test Explorer window. The Details pane displays the details as follows:
- Source: This is the source file name and the line number of the test method.
- Status: This is the test status whether it has passed or failed.
- Message: If the test is failed, the detailed message of the failure is also displayed.
- Elapsed time: This is the time that the method took to run.
- StackTrace: This is the stack trace information for the failed test.
At any time if you double-click on the Test option or select Test and choose Open Test, Visual Studio opens the source code of the selected test. This is very helpful when starting to debug the code.
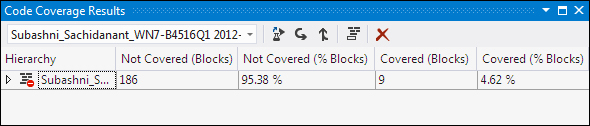
Visual Studio provides this code coverage feature to find out the percentage of code that is covered by the test execution. Through this window we can find out the number of lines covered by the test in each method.
Select the test from the Test Explorer window, and then right-click on the test and select Analyze Code Coverage for Selected Tests, or you can open the same by navigating to Test | Windows | Code Coverage Results from the Menu option. The following screenshot shows the code coverage results for the selected test. The result window provides information such as number of code blocks not covered by the test, percentage of code blocks not covered, covered code blocks, and the percentage of covered code blocks from the selected assembly: