Visual Studio provides the feature to debug the .NET code using the integrated debugger. As the coded web performance test generates code using one of the .NET programming languages, debugging is very much possible. It is required to debug the code in any application to verify the runtime behavior of the code and to fix any issues that occur.
Select the coded web test from the solution explorer and open the test. Right-click on the line of code and select the option to insert a new breakpoint. Repeat this for all places wher breakpoints are required. From the code area of the test, right-click to open the shortcut menu and choose the option to debug the code.
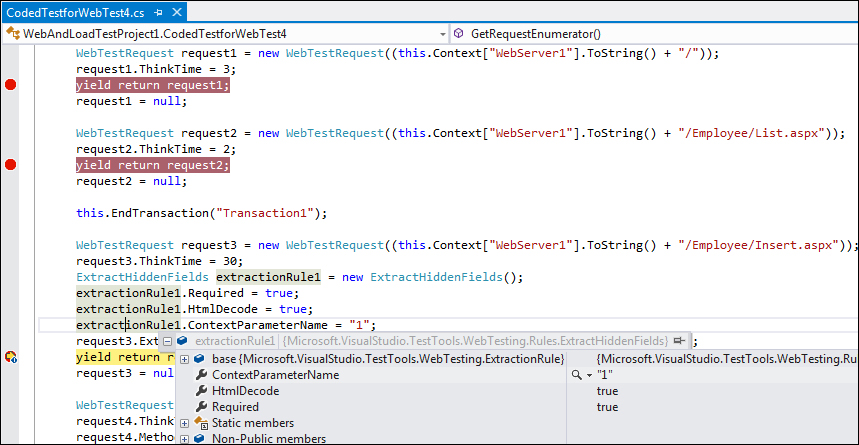
For example, the following screenshot shows the web test with a couple of breakpoints at different locations. This option actually breaks the test execution at the point where breakpoints are set.
We can step through the code and find out the values for the context variables and object properties. Different options are provided under the Debug menu option.
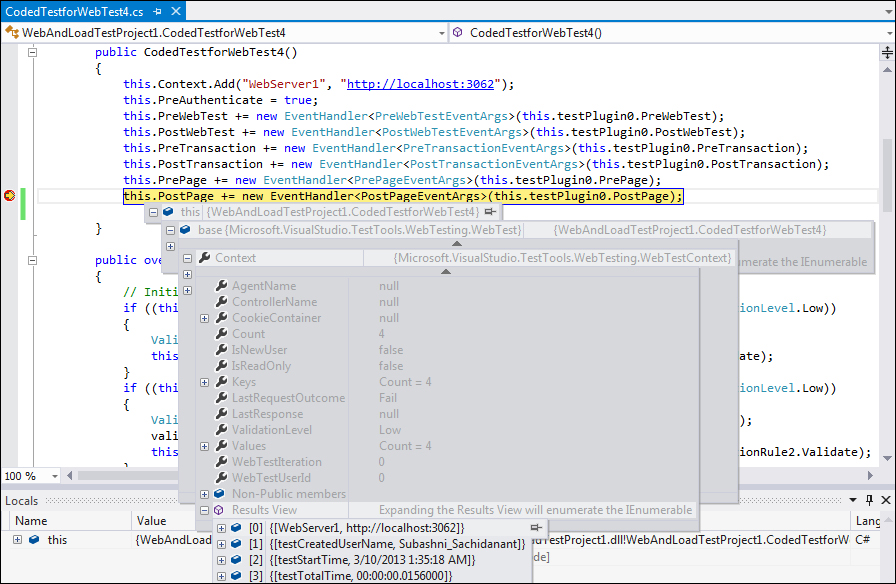
Step through the code and watch some of the object properties and attributes while debugging. The following screenshot shows the debug information for the context variables set at the end of the constructor code. It shows the values of those variables added to the context and the other properties set for the context.
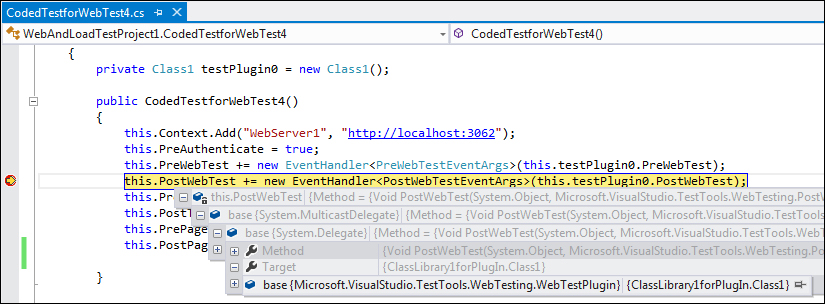
Similarly, we can step through the code line-by-line and find out if the current values show the status of the objects and the properties. The following screenshot shows another example of the PostWebTest event that refers to methods in the plugin ClassLibrary1forPlugIn: