
Visual Studio has a built-in report wizard that creates a report definitions file associated with report viewer control. The wizard provides the steps to define a report by specifying report data, organizing the data into row and column groups in a tablix data region, selecting a layout format and choosing a style.
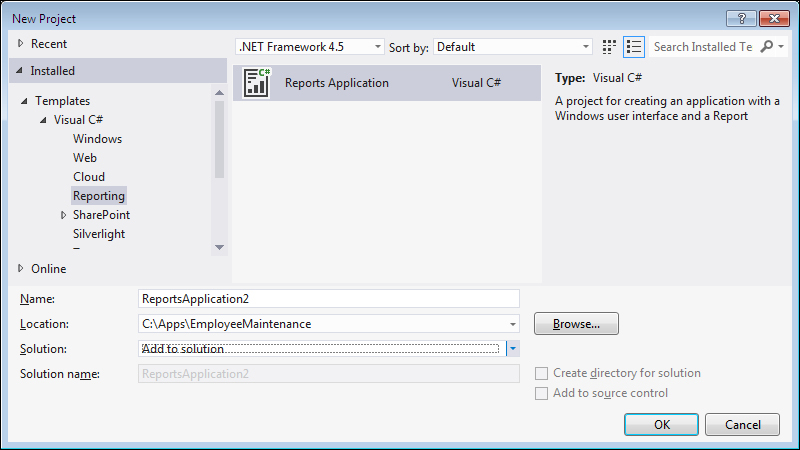
Open Visual Studio and navigate to File | New | Project, which opens the project templates. Select Reports Application from the Reporting Templates, which will open the Report Wizard.
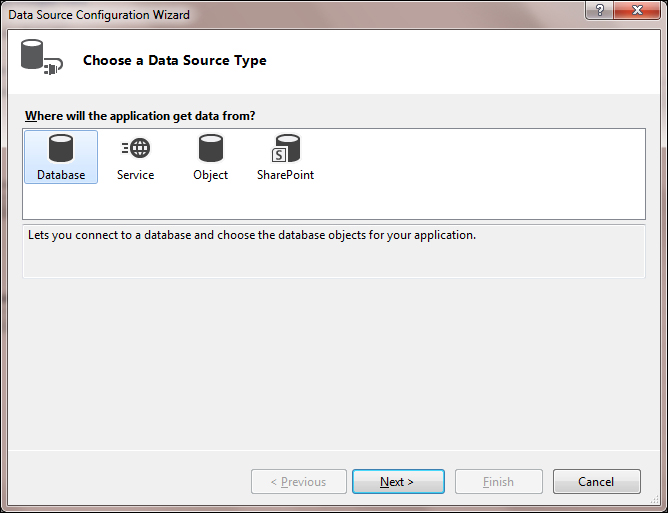
The first step is to define the dataset to use from the data source. The wizard provides the list of all data sources: Database, Service, Object, and SharePoint. Select the required data source as shown in the following screenshot and continue by selecting Database as the source for this example.
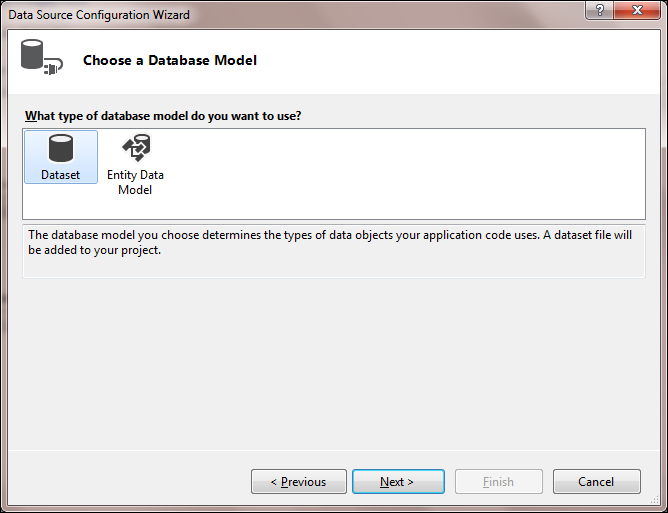
The next step is to select the database model which could be a Dataset or Entity Data Model to determine the type of data objects to be used by the application, as shown in the following screenshot. Select Dataset and click on Next as shown in the following screenshot:
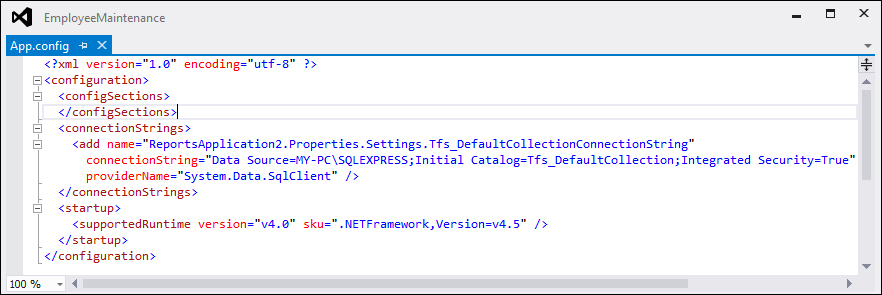
Next, we must select or create a new connection to be used by the application to connect to the database. The selection of database is based on the information that is required for the report. In this case, the database would be the TFS database where the Test Results are stored. Based on the selection, the corresponding connection string will be added to the application configuration. There will be a confirmation message with the connection string name to save to the application configuration file. The connection string would look like the one shown in the following screenshot:
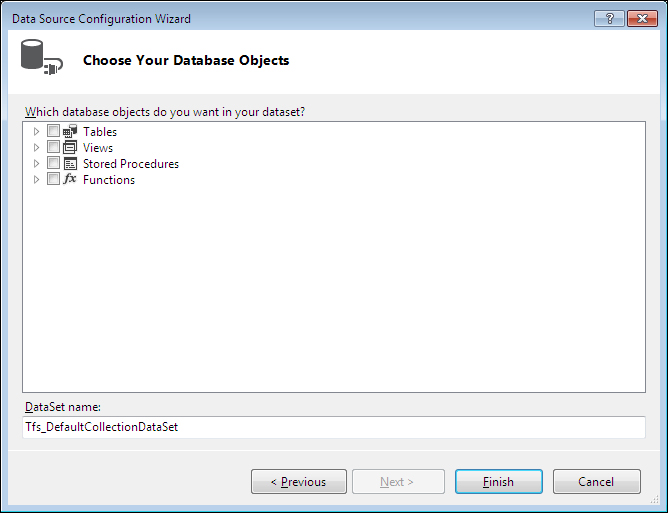
After a successful connection, choose the database objects from the database. The objects are Tables, Views, Stored Procedures, and Functions. Provide a name for the dataset or leave it as the default and click on the Finish button to proceed with the next step in the wizard.
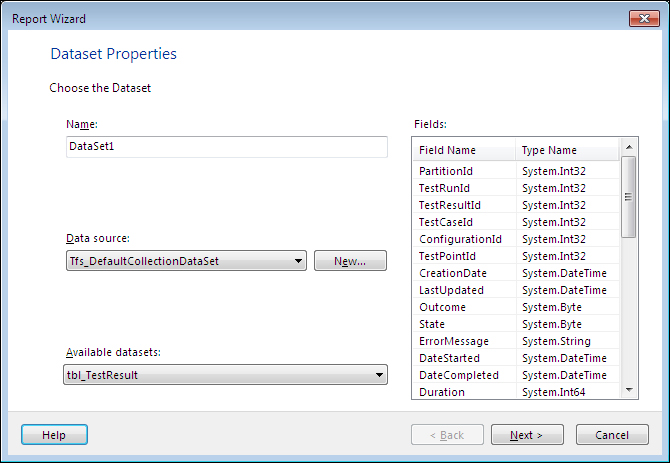
The next step in the wizard is to set the new dataset and its properties such as Data source and the datasets from the available datasets list.
The datasets list contains the objects from the chosen database. Once the Data source and dataset is selected, Fields on the right shows a list of all available fields from the selected dataset. Provide a name for the new dataset for the report and click on the Next button to proceed with the wizard.
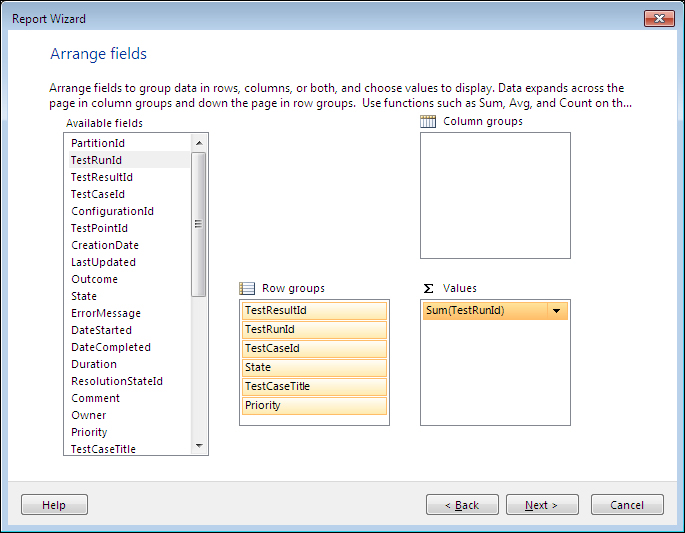
The Arrange fields section is for grouping fields into Row groups, Column groups, and detail rows for the data region as shown in the following screenshot. Based on the Row groups and Column groups the region displays the data in grid layout.
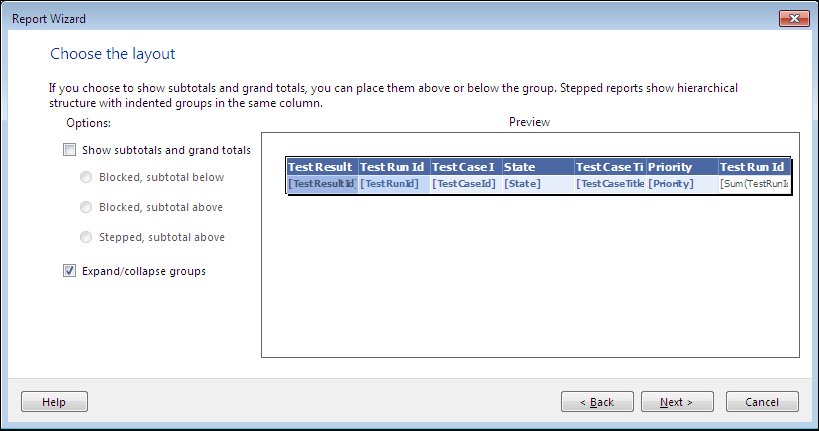
On the next screen, choose the layout for the report. The layout defines the place where the totals, subtotals, and aggregates should be shown in the report.
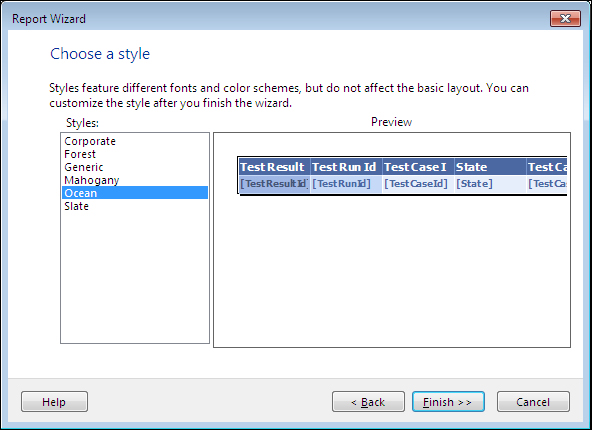
The final step is to define the style for the report. Select any specific style from the list of available styles as shown in the following screenshot. A preview of the style will be shown on the right pane.
After selecting the style, the report is created and added to the project. Run the project to see the result.
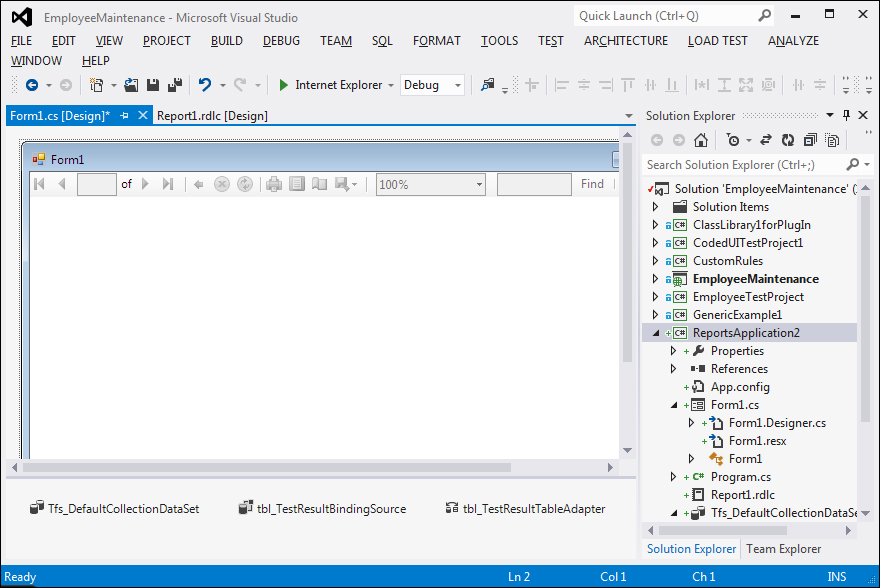
The report can be modified by dragging and dropping fields from the dataset and defining the layout. The previous example is a very simple example using fields directly from the table. Reports are very flexible to create complex reporting from the available datasets.
Reporting is not limited to Visual Studio; other reporting tools such as Report Builder can create the report layout and structure by accessing the SQL Server database. Using Microsoft Excel, reports can be generated by creating pivot tables and pivot charts and pulling the data from the SQL analysis service. Once the pivot table is created, customize the report based on the columns. To get connected to SQL Server database or an analysis service database, the user must have access to read the data from the database to use in the Excel report.