
The Code coverage feature in Visual Studio has been simplified and provides lots of information on coverage. It also provides different colors for coding the coverage and a detailed report. Basically, code coverage is used to determine the percentage of actual project code covered and tested as a part of unit testing. Covering a large proportion of code is always better. The Code coverage analysis can be applied for both managed and unmanaged code.
In the current and recent version of Visual Studio, the Code Coverage Results option is merged along with the Test Explorer window. The results table shows the percentage of the code that was run in each assembly, class, and method. The source code editor also shows which code has been tested.
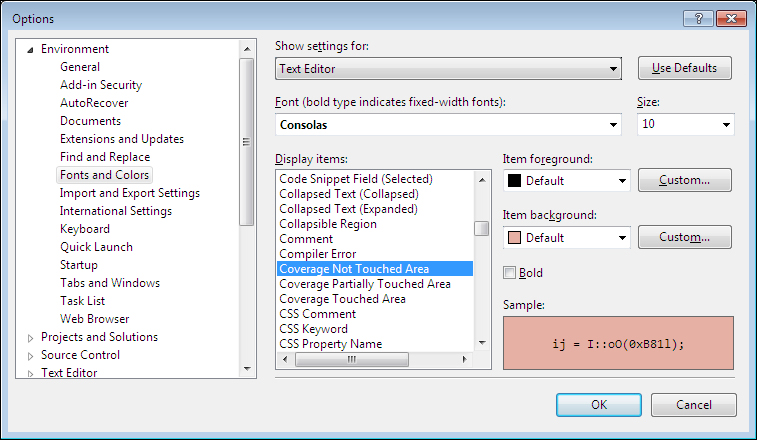
The Analyze Code Coverage option is available under the Test menu as well as in the Test Explorer window. In order to check which line has been run or not, choose the Show Code Coverage Coloring option from the results window. To alter the colors and formats, choose Tools | Options and then use similar settings as follows:
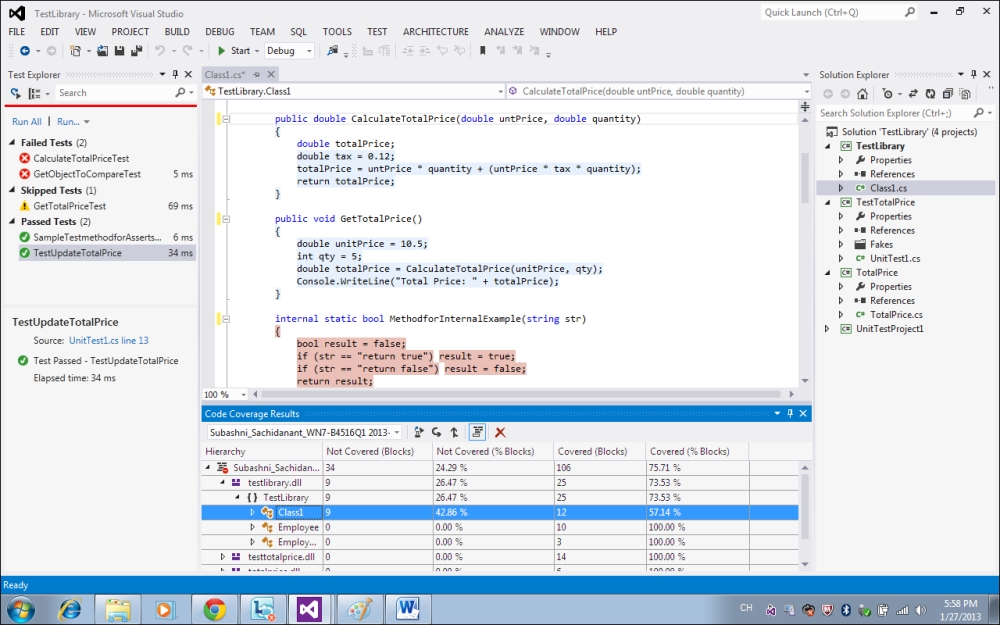
The screenshot shows the Code coverage analysis result for the unit testing samples that was created for the previous sections. If the coverage is low, it means that more analysis and investigation is required, and thus we need to write more tests to get better coverage:
The coverage of the most recent run is shown in the results window. The Results window has multiple options to view the results as follows:
- Previous Results: To view previous coverage results, use the drop-down list at the top of the results window and choose a particular result.
- Export Results: This option generates a readable
.coveragexmlfile, which can be processed with other tools. This file can also be e-mailed to someone, so that they can import it and see the coverage results. If they have the source code, they will be able to see the coverage coloring as well. - Import Results: The Import option is used to import the
.coverageor.coveragexmlfile exported earlier. After importing, the results are shown in the results window. This is useful to import multiple results and do analysis of differing coverage. - Merge Results: In some situations, different blocks in the code will get executed based on the test data. To combine the results for all test data and see it as one result, the merge option is used. For example, if the parameter or the test data is passed as True, certain blocks will get executed. The remaining would get executed if the test data is passed as False. To get the consolidated coverage result, the coverage result from both the tests should be imported and merged.
By default, the code coverage is counted in blocks. A block is a piece of code with one entry and one exit point. The block is counted only if the control flows through the block during the Test Run. The number of entry and exit points through the block does not matter for the coverage.
By default, the results are shown by blocks but it can also be changed to lines by using the Add/Remove columns option in the table header. Some users prefer count of lines instead of blocks:
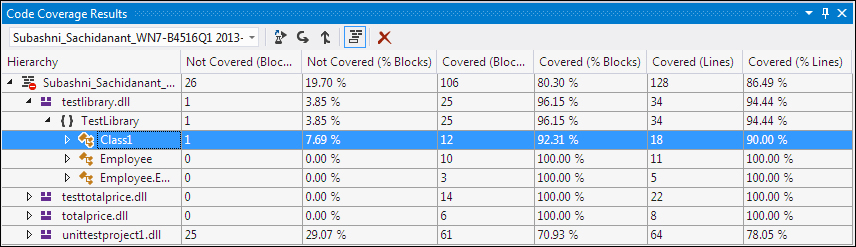
The count of lines shows the coverage to the granular level whereas a block are counted only once even if it contains several lines of code.
All blocks of code within the files and project are taken for consideration during Code coverage analysis. In some cases, it may be neccessary to exclude one or more blocks from the coverage altogether for various reasons. It could be because of system-generated code or because the block may not be ready for the coverage. In these circumstances add the System.Diagnostics.CodeAnalysis.ExcludeFromCoverage attribute to those elements. Excluding a class does not exclude its derived classes. For example, one of the code blocks named as MethodforInternalExample is excluded using the ExcludeFromCoverage attribute as shown in the following screenshot:
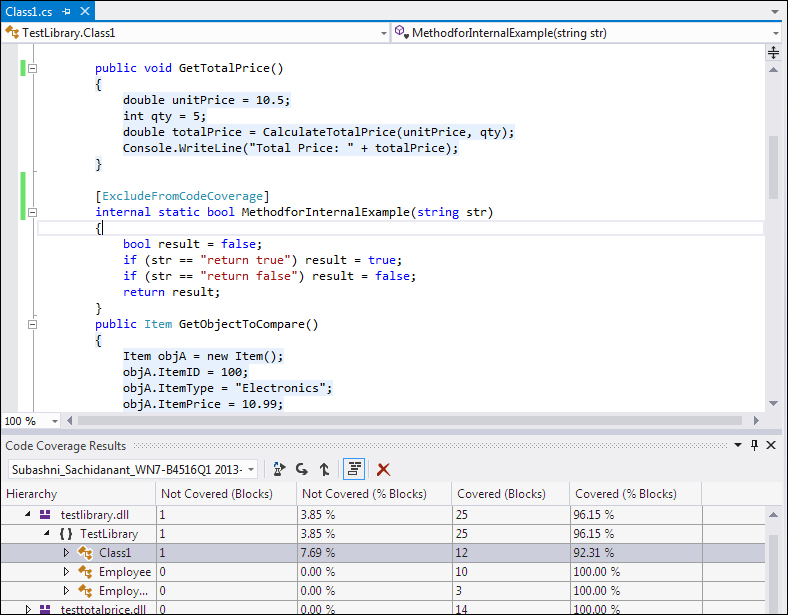
Now the Code Coverage Results for the Class1 shows as 92.31% instead of 57.14% last time.