
The previous chapter, Working with Test Results, explained about different types of testing methods and running these tests using Visual Studio 2012. There is one other new type of testing in Visual Studio, which helps testers to work without any dependency on test cases or tools, which is called exploratory testing. Exploring the application and testing on your own is called the exploratory testing. This type of testing is a free flow of testing the application without any predefined test steps or scripts. Test Manager 2012 provides the option to perform exploratory testing and capture actions, steps, and screenshots to track activities. The only drawback of exploratory testing was reproducing the steps and actions, but with the use of Test Manager 2012, this can be automated, which helps the test steps to be reproducible. Test case is automatically created using the recording. This is very helpful when redoing the test later if there are any code fixes.
The Test Results and Test Run windows in Visual Studio are used in getting details of the Test Results. The Test Result summary window provides the summary of results summary for the selected test after the Test Run. But how do we get the collective information about all the tests run based on specific parameters? Visual Studio 2012 integrated with Team Foundation Server 2012 provides built-in reports to get collective information on all the tests run. There are several reports to get information about the work items, Team Project builds, and task level status of the project. These reports are very useful in analyzing the project quality and status at any time.
The most recent version of Team Foundation Server (TFS) comes with different process templates, such as Visual Studio Scrum 2.1, Microsoft Solutions Framework (MSF) for Agile Software Development v6.1, and MSF for Capability Maturity Model Integration (CMMI) Process Improvement v6.1 that can be used for the Team Project. Each of these process templates contains a number of predefined reports. The Team Project is the central data store for multiple projects. The data store maintains all information about projects including source code, build details, and tests. The Team Explorer is the user interface for getting details about the work items, Test Results, and builds.
TFS and Visual Studio 2012 integrate with the SQL Server reporting/analysis services to create and manage reports. SQL Server is the default data store used by TFS 2012 to maintain all information about projects, including the source code, tests, reports, documents, and build information. Whenever a new Team Project is created, a set of predefined reports from the selected process template is created and viewed under the Reports folder in Team Explorer. All these reports can be customized based on your needs. Alternatively, new reports can be created and shared to the other projects.
Creating reports for Team Project can be done by using any tool that connects to a relational database or analysis database, such as Microsoft Excel or Visual Studio Report Designer. Excel is easier to use, but provides less functionality compared to Report Designer. Some of the important features provided by Report Designer are:
- Detailed reporting
- Sharing reports using Team Explorer
- Updating existing reports
- Faster report retrieval and management
All these reports include a feature to export and print the current report. The report can be exported in different formats such as XML, CSV, TIFF, PDF, and Excel files. They also have a print option that comes along with the report to print the current report result for the selected parameters.
This chapter provides detailed information on the following features that can be used along with TFS integration with Visual Studio 2012.
- Exploratory testing using Test Manager
- Reports available from Team Foundation Server
- Creating report definitions using Visual Studio 2012
The Testing Center in Microsoft Test Manager contains two new features to do the exploratory testing and to view exploratory sessions that have already been. To begin exploratory testing there are few options.
One is to just start exploring the application without selecting any work items. Simply click on the Explore option in the Do Exploratory Testing window. This is appropriate in the case of there being no backlog stories or requirement work items created. The exploratory test session will not be associated to any of the existing requirements in this case.
The second option is to start exploring the application by selecting a work item. This will associate the actions, recordings, test cases, images, and errors to the selected work item. Any task in software development is associated with a requirement in the form of a work item or requirement backlog. This is mainly to link and track the defects, test cases, comments, code fixes along with requirement. Select a work item from the list and click on Explore work item to start the testing.
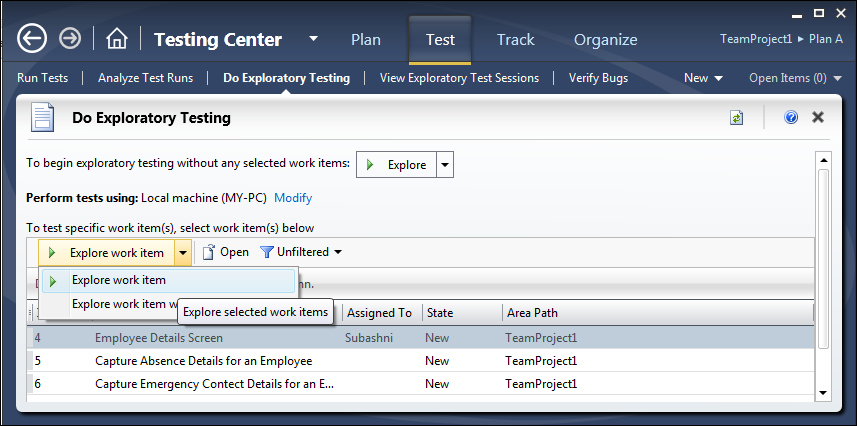
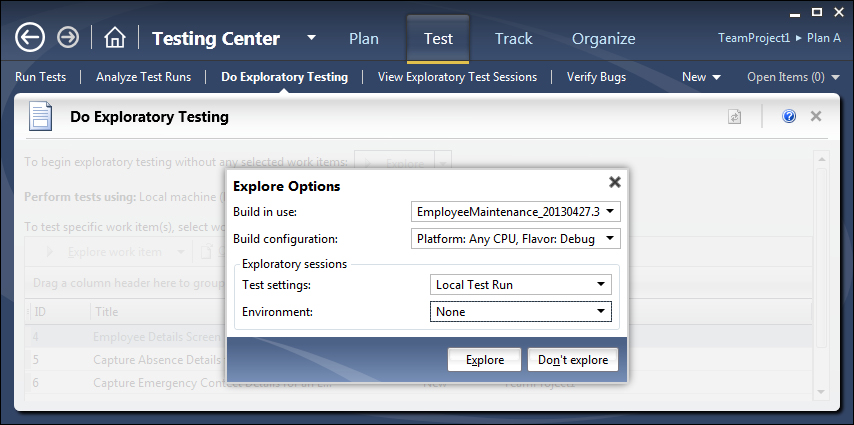
Another way of exploring the application is to select the option Explore work item with options which opens a new window to choose environment information to associate with the requirement. This includes the build information and session information such as test settings.
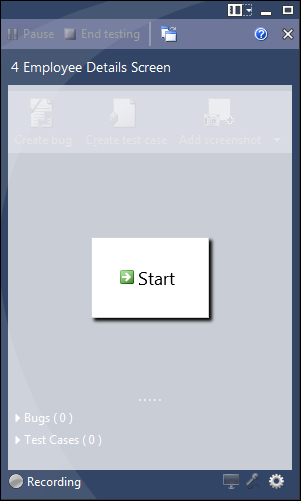
Select the work item from the list and choose the third option of exploring with options. A new window which is similar to the web test recorder opens with options to start the testing, create a bug, create test case, and to add a screenshot. Only the Start option will be enabled, the other options will only be enabled after exploratory testing of the application has started. At the top of the window is the work item selected for testing.
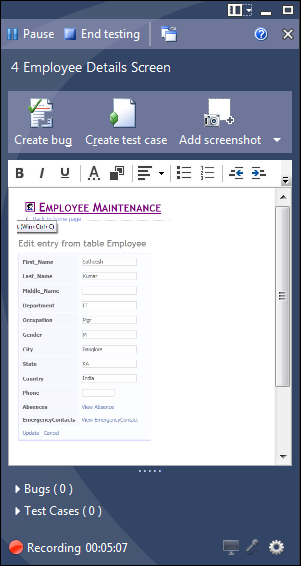
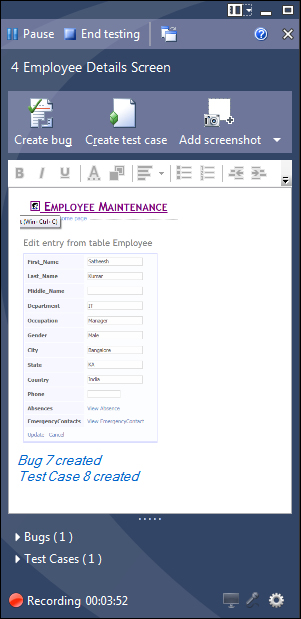
Start the testing and open the browser to launch the application under testing. The recorder starts recording all your actions, and also contains a text area where comments can be added and notes taken. The following screenshot shows a screenshot of the current screen under test added to the text area. To do this, click on Add screenshot, move the mouse over the screen and drag the area of the screen to be captured as a screenshot.
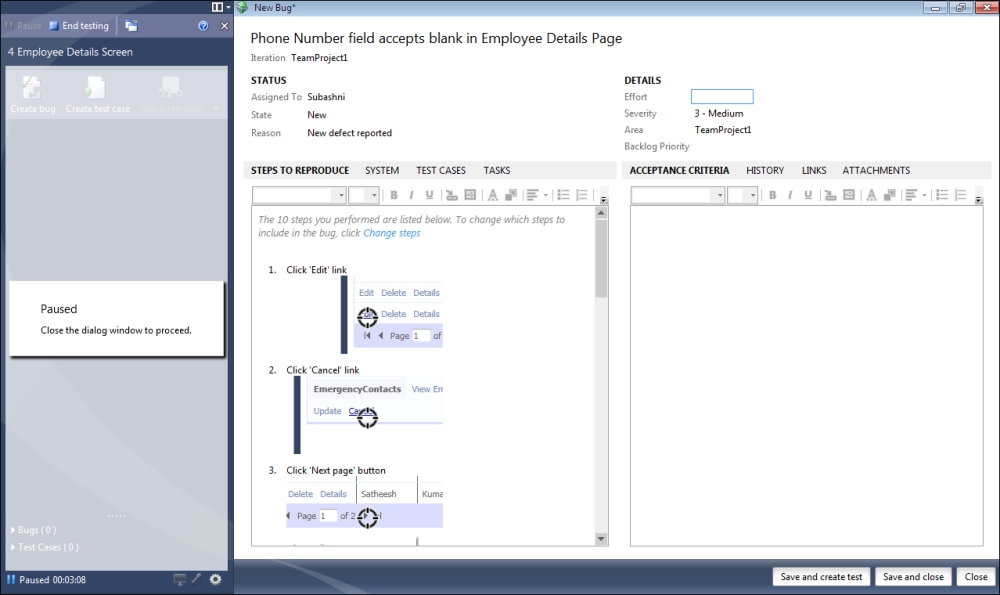
If any defects are found while testing the application, just click on Create bug from the options listed above in the recorder window. This will pause the recording and open the New Bug window to log the defect. The STEPS TO REPRODUCE area lists the last ten steps followed during testing. This can be modified using the Change steps option available at the top of the text area. Click on the Save and close button to create a defect only, and return to the recording process. Alternatively, click on the Save and create test button to save the defect with the current details and also create a new test case for the current exploratory test.
Enter the required details in the new test case window then save and close. You may notice that the bug and test case are created and added to the recording window. Comments are also shown in the text area.
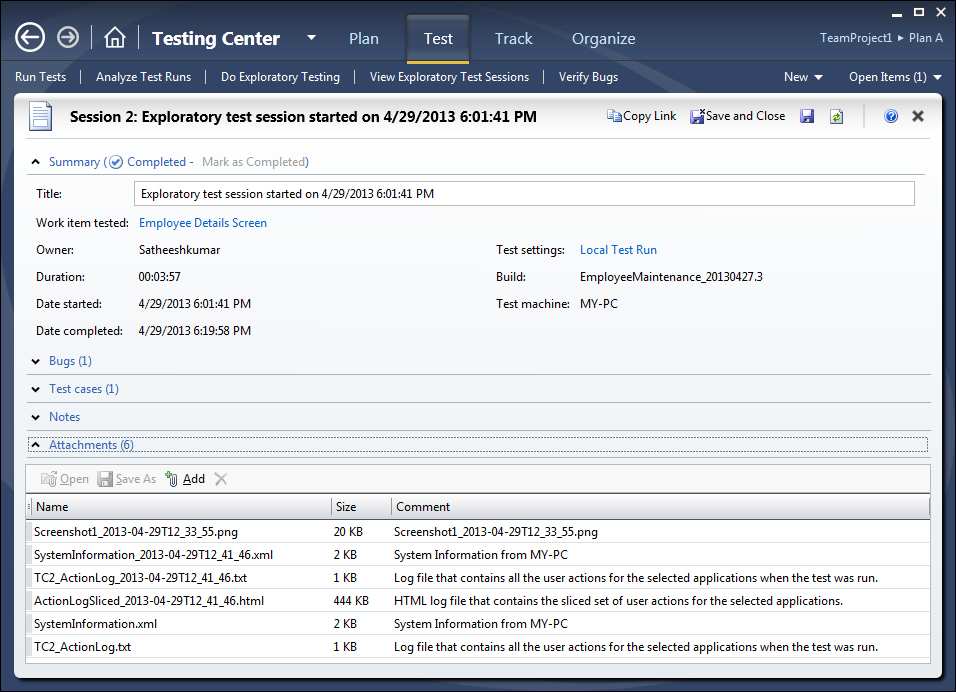
If the exploratory testing is complete, click on the End Testing option at the top of the recording window. This option closes the recorder and opens the Testing Center showing the details of the completed session. The summary shows the start and completed date time, test settings used for the test, build associated to the testing, the owner, and the work item with which this exploratory testing is associated.
The Bugs section contains all the bugs raised during the testing session. It provides options to open each bug to see the details, create a new test case, and link to a test case. If the test case was not created during the testing, an existing test case can be linked to the defect using this option.
The Test Cases section lists the test case to which the testing session is associated. The Notes section shows the details entered, screenshots taken and notes added to the text area of the recorder are shown in this section.
The following screenshot shows the details of an exploratory test session with details captured in each section:
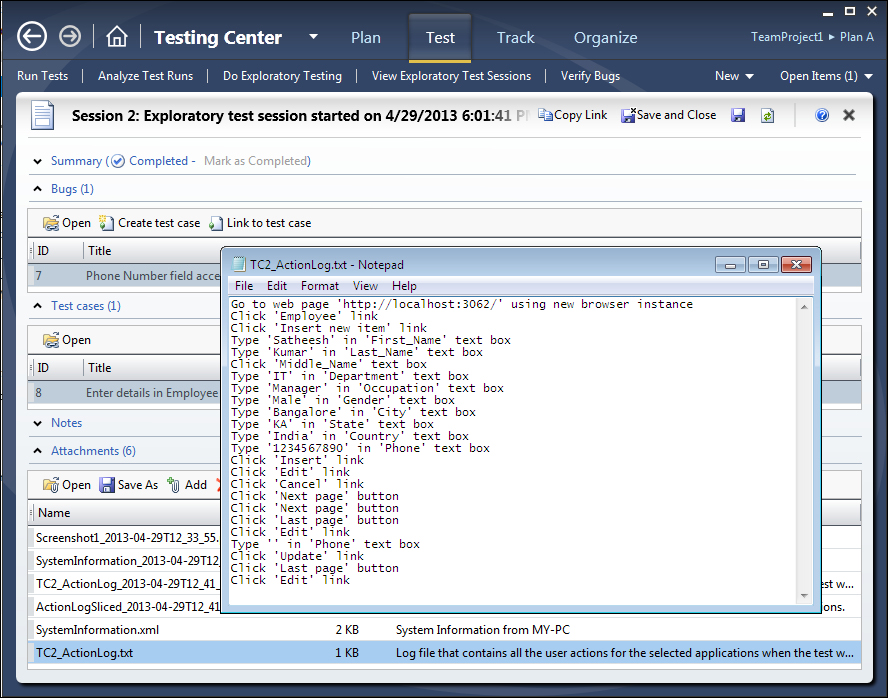
The Attachments section contains the full details required for detailed analysis of the testing session. The section contains multiple attachments, such as screenshots, log information, system information, and an action log in HTML format which has screenshots of each step as well. This section has loads of information which helps the team get to the root cause of any issues occurring during testing. Additional information can also be added to this section. The following screenshot shows one of the action logs captured during testing:
The View Exploratory Test Sessions window displays a list of all conducted sessions. This window provides options to open the selected session in order to look at the details and to delete the selected session if it is not useful.