Appendix A. The Ajax craftsperson’s toolkit
Ajax is a very easy technology to work with. The toolset required to get the job done is minimal, and it is possible to develop complex Ajax applications using nothing more than a web browser, a text editor, and access to a web server—either on your development machine or through your ISP or hosting provider. Nonetheless, tools are important to programmers, and toolsets are becoming increasingly sophisticated.
As yet, there are no dedicated Ajax IDEs, although these will probably appear in time. Several development tools do, however, offer support for some parts of the Ajax development process. In this appendix, we present an overview of the types of tools available and how they can help you to work smarter and faster.
A.1. Working smarter with the right toolset
The right development tools can be invaluable in speeding up repetitive or difficult processes, and they can have an enormous impact on a developer’s productivity. The wrong tools can be distracting, gimmicky, and constraining, forcing a project into a particular process or way of doing things that doesn’t really fit. Different tools suit different people and will suit them better or worse on different kinds of projects. It’s arguably a key part of a developer’s job to devote time and effort to finding the right toolset. Abraham Lincoln put it nicely:
Give me six hours to chop down a tree and I will spend the first four sharpening the axe.
If sufficient attention is invested in doing so, the returns can be considerable. Finding the balance between perfecting your tools and actually using them is important, too, particularly in a fragmented situation such as the current Ajax tools offerings, as you’ll see in the following section.
A.1.1. Acquiring tools that fit
Many tools can be acquired relatively easily, in the form of free downloads, open source projects, or commercial products. There are no mature tools dedicated to Ajax yet, but several are available that are designed for developing web applications, and many of these support JavaScript, HTML, and CSS.
Ajax uses the same technologies as classical web applications but in quite different ways, as we outlined in chapter 1. Instead of being built out of lots of little pages presented in sequence, an Ajax application will tend to have only a few pages—and often only one—that undergo a variety of programmatic transitions as the user works with them and that talk to the server asynchronously in the background. Further, because of the much greater volume of JavaScript being generated, the Ajax programmer is more likely to be developing with JavaScript frameworks (see appendix C for a round-up of frameworks, and chapter 3 for a discussion of a few of the more popular ones).
These differences raise two concerns, then. First, the tool may make assumptions about page-based workflows that are at odds with the Ajax approach. Second, support for JavaScript may be based on the use of a particular set of functions or coding practices that don’t play well with third-party frameworks that the user is employing.
The differences, then, are mainly in the high-level structure of an application rather than in the details. The concerns raised here are more likely to apply to complex tools, such as IDEs, than to simpler tools, such as JavaScript-aware text editors.
It’s important to bear these considerations in mind when evaluating tools for an Ajax project. We’ll raise them again later when we look at the different classes of tools on the market.
Finally, it’s worth noting that many tools these days provide extensible feature sets, in the form of plug-ins. Complex tools such as general-purpose IDEs and web browsers are used by different types of users in different ways. Plug-ins allow users to customize a base application with the specific features that they need, avoiding bloat in the base feature set, and empower them to extend the functionality of an app in ways that the original development team hadn’t anticipated. Two notable cases of plug-in–based applications are the Eclipse IDE, which, although it is mainly a Java developer’s tool, supports a range of Ajax functionality through plug-ins, and the Firefox browser, which has an active plug-in (a.k.a. extensions) community and several useful extensions targeted at web developers.
Eclipse and Firefox both have very active plug-in communities, and the chances are that a plug-in already exists that does more or less what you want. There is also a strong tradition in computing, and in web development, of building your own tools, to which the plug-in approach also caters. Let’s have a look at that tradition now.
A.1.2. Building your own tools
As an alternative to buying or downloading a ready-made tool, you can always write your own tool. This may sound daunting and unrealistic, given that the discussion has focused so far on IDEs and large-scale tools. We certainly wouldn’t suggest that you begin an Ajax project by writing its own IDE!
There’s a strong tradition in UNIX culture of developing small tools that do a single job. These kinds of tools are easily developed in a short time and are simple enough to be maintained easily, too. The stopwatch classes that we developed for profiling JavaScript code in chapter 7 are an example of this kind of tool, as is the output console that we’ll demonstrate in section A.3.4.
Tools written in JavaScript and other Ajax technologies have the advantage of being portable across any browser. However, the capabilities available within the browser are severely limited, owing to the JavaScript security model that we discussed in chapter 6. Sometimes it makes more sense to write a tool as a standalone program, whether in .NET, Java, or any other programming language. The HTTP debuggers that we describe in section A.3.3 are a case in point here.
A middle way between writing tools within the browser and writing a standalone tool is to develop a plug-in. Many of the larger web development tools support the development of plug-ins these days, and some have made it quite easy to develop plug-ins, too. Two notable examples are the Firefox web browser and the Eclipse IDE, as discussed in the previous section. Eclipse even offers a set of plug-ins, bundled with the core download, that make it easy to write plug-ins. Nonetheless, plug-in development is somewhat more advanced than developing in-browser tools and probably only justifiable within the time budget of a larger project.
A variety of tools can be useful in Ajax development. These are rather scattered at present, and actively maintaining them is an ongoing task. Let’s say a few words about that before moving on to look at some specific tools.
A.1.3. Maintaining your toolkit
As noted, Ajax tools are currently rather fragmented, a rather different situation for the Java or .NET programmer used to sitting in front of the comfortable bulk of Eclipse, NetBeans, or Visual Studio.
Developers owe it to themselves to keep their toolkit up to date. Without the central focus of a de facto standard IDE, this task is somewhat more problematic and will generally rely on word of mouth, mailing lists, portal sites, blogs, and the other distributed communications media of the Internet.
The most fundamental tool for any developer is the editor into which he types his code. Let’s take a look at them next.
A.2. Editors and IDEs
Code-editing tools vary a great deal in complexity, from the simple Notepad to complex IDEs that model the code objects in a variety of ways as you type. JavaScript, HTML, and CSS aren’t as well supported as enterprise-class languages such as C#, Visual Basic, and Java, but there’s still quite a wide range of functionality from which to choose. Let’s run through the types of features that we might look for before we consider the products available today.
A.2.1. What to look for in a code editor
Code editors can do many things, arguably too many. A lot of it comes down to individual tastes. Some developers prefer a simple tool that processes text; others like the visual aids and cues of a full-blown IDE.
When it comes to supporting Ajax code, in the form of HTML, CSS, and JavaScript, there are a number of ways in which the editor can help us. Many of these may seem like overkill for the web content of a classic web app, but as the codebase of an Ajax application is typically much larger and more structured, support for that structuring becomes more critical. Here’s a quick rundown of useful features to look for.
Multiple file support
This is a very basic requirement but worth noting anyway. Ajax projects will typically entail a large number of files, and an editor that cannot manage multiple files or buffers (such as Windows Notepad) will quickly become annoying. Nearly all coding editors support multiple files through tabbed panels, a selector panel, or something similar.
Syntax highlighting
This is a fairly basic feature nowadays and one that most programmer’s editors will support. Syntax highlighting simply colors, italicizes, or otherwise marks language keywords, symbols, quoted strings, and code comments, making it easier to read a sequence of code.
Most editors support syntax coloring for a range of languages, often with pluggable syntax definition files. The key issue for Ajax programming is that a variety of languages are typically used. There are HTML, CSS, XML, and JavaScript on the client side, all of which can benefit from syntax highlighting, and some or all of Java, C#, VB, and the more complex ASP, PHP, and JSP, in which blocks of HTML and code alternate with one another. Not all syntax-aware editors support the full range of languages in use in an Ajax project.
Higher-level code support
Coloring in the code provides useful visual cues, but some editors go beyond this to model the code at a higher level of function, methods, and object declarations. This higher-level understanding of a codebase opens up a broader range of tools such as outliners that summarize a file’s contents, navigational aids such as maps of object hierarchies, and the ability to search for uses of a specific property or invocations of a method or function. Tools of this type become invaluable as a codebase matures.
Project-level support tools
Taking another step up from modeling individual object definitions, some IDEs will also manage a codebase as an integrated project, recognizing linkages between the various components and resources that lead to a deployed product. In an IDE for a compiled language, a key benefit of this is the ability to build the entire project into executable form, but this isn’t a concern for Ajax, in which all client-side resources are deployed in their human-readable form. Nonetheless, this capability may be useful when working with server-side code.
Further, project-level support may provide the ability to deploy a project to a web server, even to manage the web server itself, either by controlling an external server through RPC calls or by embedding a simple server into the IDE. A tool that supports the codebase at the project level can release the developer from maintaining a build-and-deploy system.
Version control integration
Version control is a necessity in larger projects and good practice in a project of any size. Version-control systems themselves generally work on text and binary files without understanding their higher-level semantics, so there is little to say about them that is specific to Ajax, but integrating version control into your toolset can be a great help.
Mixed-language development: client and server integration
As we noted earlier, many Ajax projects will require a server-side component in addition to the many web browser technologies being employed. Server-side JavaScript is possible but not fashionable, and the Ajax developer will usually make use of different languages on the server side and the client side. It is possible to use completely different tools for server and client coding, but some tasks will involve rapidly switching between the tiers, and an editor that can support the full range of languages can be a distinct advantage.
Those, then, are our main criteria for choosing a code editor, whether it be a plain text editor or an IDE. In the next section, we’ll have a look at some of the available tools at the time this book was written.
Two-way visual designers
Many web-design tools provide visual WYSIWYG designers for web pages. These can be useful for prototyping, although they are often poorly adapted to Ajax’s more dynamic approach to rearranging the user interface through DOM manipulation. Most visual editors will also allow the programmer to switch to a text-based view of the HTML. When you’re using this kind of tool with Ajax, it is important that the visual editor preserve elements that it does not understand, such as comments and custom tag types and attributes, particularly as the latter may be used by the JavaScript code that rearranges the DOM tree.
A.2.2. Current offerings
A variety of text editors and IDEs offer some support for Ajax technologies. We’ll start by looking at the programmer’s editors and move on from there to the more complex IDEs.
Text editors
Depending on your operating system, a wide range of open source, freeware, and shareware text editors is available these days, such as shareware tools TextPad, Notepad2, EditPlus, the UNIX veterans Vim and Emacs, and the extensible cross-platform jEdit, whose plug-in system enables some IDE-like functionality. Figure A.1 shows a few common text editors in JavaScript mode.
Figure A.1. Syntax highlighting support for JavaScript in (left to right) the TextPad, Gvim, and jEdit programmer’s editors
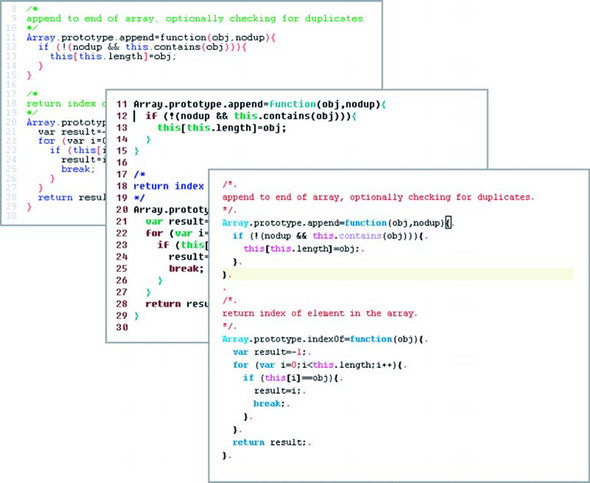
TextPad provides a staggeringly diverse base of user-contributed syntax definition files, including several for CSS, JavaScript, XML, and HTML, and for most popular server-side languages. There is minimal support for running user-defined commands such as compilers against the current file. TextPad runs on Microsoft Windows only. NotePad2 and EditPlus fill similar niches.
jEdit is Java based and can run on any platform that supports Java. It supports syntax highlighting for over 100 languages, including all the main Ajax ones. Several more advanced features are available through a plug-in system, which is well integrated. Plug-ins can be automatically browsed, downloaded, and installed from within jEdit itself. Useful plug-ins include support for syntax checkers, debuggers, compilers, and version-control interfaces, and specific support for CSS and XSLT.
Vim and Emacs are powerful extensible text editors with a long tradition in UNIX operating systems, although both have been ported to Windows, too. Both have well-developed modes for JavaScript coding.
Integrated development environments
Enterprise programming languages such as .NET and Java have a long history of integrated development environments. The market for these is mature, and in recent years, a number of mature, feature-rich open source and freeware IDEs have appeared. IDEs designed for server-side coding languages are often extensible enough to allow for client-side development using Ajax.
Microsoft technologies are still dominated by Microsoft’s own Visual Studio. Visual Studio includes support for web development through the Visual InterDev component, which supports JavaScript and CSS. Free, cut-down versions have recently become available under the name Visual Studio Express, including one targeted at web developers.
The most prominent Java IDE at present is the IBM-sponsored Eclipse. Eclipse is mostly a Java development tool and ships with a complex set of plug-ins specifically written for Java developers. A thriving plug-in community exists, including some relatively simple JavaScript plug-ins providing syntax highlighting and outline views of methods and classes (figure A.2).
Figure A.2. The JavaScript editor plug-in for Eclipse provides rudimentary outlining support for JavaScript objects but doesn’t handle the full object-based syntax.
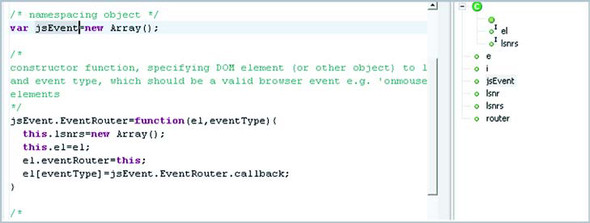
With the recent Eclipse version 3.1, a broader range of web developer plug-ins is being developed by the Web Tools Platform project, which in addition to supporting server-side J2EE technologies, has editors for JavaScript, XML, HTML, and CSS. Eclipse also offers strong project-level codebase-management features and full integration with CVS version control out of the box. Third-party integration with Subversion, Visual SourceSafe, and other version-control systems is available.
Some enterprise Java development tools such as the Sun Java Studio Creator and SAP NetWeaver offer high-level design facilities for web applications. In our experience, these are based heavily on the classic web application metaphor, with an application being modeled as a series of discrete pages, and may translate poorly to the Ajax approach. Studio Creator uses Java ServerFaces (JSF) behind the scenes, however. We discussed JSF and Ajax in chapter 5, and although the two technologies have some challenges to overcome before being fully interoperable, it may be possible that JSF-based tools will support Ajax better in the near future.
As well as having a foot in the enterprise-development camp, Ajax has roots in the web-design community, for whom an entirely different type of toolset has developed. Macromedia Dreamweaver and Microsoft FrontPage are two notable web-design tools of this type, and both offer support for the basic client-side technologies used by Ajax. Dreamweaver provides good support for basic JavaScript and CSS editing (figure A.3) and a two-way HTML editor with visual and text modes, but for WYSIWYG orchestration of complex JavaScript user interfaces, it supports only its own code library. Integrating third-party libraries such as x, Prototype, and Rico into a Dreamweaver or FrontPage project would require a lot of hand-crafting the scripts, making use of the text editor functionality of the tools and relatively little else.
Figure A.3. Dreamweaver’s editor supports JavaScript and CSS. The CSS file being edited in the upper-right pane is also shown in outline form in the upper left.

The final tool worth a mention here is ActiveState’s Komodo, which is a crosslanguage scripting IDE, supporting Perl, Python, PHP, Tcl, JavaScript, and XSLT. Komodo has very good support for JavaScript codebase navigation and a sophisticated outliner that recognizes JavaScript classes as well as functions and methods (figure A.4). As a general-purpose scripting IDE, it deals only with JavaScript the generic language, not the browser-based implementations. As such, it is most useful when developing domain models for Ajax. Komodo is a commercial tool with free trials available. As an interesting aside, the Komodo UI is built using the XML-based XUL toolkit used to create the Firefox web browser.
Figure A.4. The Komodo IDE provides high-quality outlining features for JavaScript objects and can understand a number of coding idioms. Here the code outliner has recognized that various functions belong to the ObjectViewer prototype.
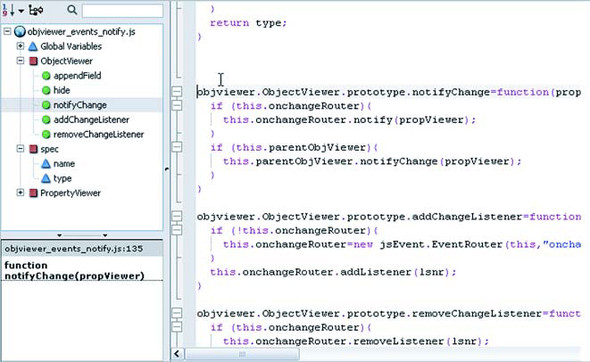
In the next section, we’ll consider another key tool in the developer’s arsenal: the source code debugger.
A.3. Debuggers
The behavior of simple computer programs can often be figured out by looking at the code, but larger, more complex programs are often too large to hold in your mind all at once. Debugger tools provide a way of controlling the flow of execution of a piece of running code, allowing it to be stopped and started manually and the state of the program inspected while it is running.
A.3.1. Why we use a debugger
Debuggers provide a very practical way of finding out what a program does. In any programming effort, a debugger can be useful in testing whether you have understood a piece of code correctly. In Ajax, this is particularly valuable.
When the term debugger is used, most developers tend to think of source code debuggers, and server-side and JavaScript debuggers are indeed handy to have at your disposal when writing Ajax. However, it is also helpful to be able to debug network traffic when writing Ajax, as HTTP can be surprisingly complicated, too. In the following sections, we’ll consider both source code and HTTP debugging tools. Let’s look at the state of JavaScript debuggers first.
A.3.2. JavaScript debuggers
Being able to debug JavaScript code is especially useful because of the fluidity of the language. A C# or Java programmer generally knows which properties and methods are available on a given object by examining its class definition and knows the types and number of a method’s arguments from its declared signature. It isn’t always possible with JavaScript, though, to work out from the code how many arguments a function will be invoked with, or even what the variable this will resolve to inside a function. This latter issue is particularly problematic for callback handlers, for which the invocation of the function may be done by an unknown object or by the browser itself.
At its simplest, a source code debugger allows the user to set breakpoints that halt program execution and hand it over to the user when that line of code is executed. The user may then step through the code a line at a time, inspecting the values of any variables that are in scope, or resume normal execution until the next breakpoint is encountered. In JavaScript, breakpoints may be set by the debugger tool itself or by the coder, by adding a debugger statement to the code. For example, when the browser executes the following code
var x=3;
var y=x*7;
debugger;
var z=x+y;
control will be handed over to any debugger that is registered with the browser on the third line of code (figure A.5), at which point the values of variables x and y can be inspected. z has not been declared yet and so can be inspected only after the user has stepped the debugger forward over the fourth line.
Figure A.5. Using the JavaScript debugger statement triggers a breakpoint programmatically.

This defines the basic functionality of a source-debugging tool. A more sophisticated debugger may support further features, as discussed next.
Call stack navigation
When a function is executed in JavaScript, a new execution context is created, with its own set of local variables. When a debugger stops inside a function, it can see the local variables inside that function but not those in the function that called it. Consider the following example:
function doASum(){
  var a=3;
  var b=4;
  var c=multiply(a-2,b+6);
  return (a+b)/c;
}

function multiply(var1,var2){
  var n1=parseFloat(var1);
  var n2=parseFloat(var2);
  debugger;
  return n1*n2;
}
At the point at which the debugger is invoked, we can see variables n1, n2, var1, and var2. While examining a problem with our program, we may decide that the issue lies with the arguments being passed into our function. We need to know what values a and b held in the enclosing doASum() method. We could set an extra breakpoint in doASum() and run the program again, but it might take us some time to return to this state in a complex program. If the debugger supports call stack navigation, then we can simply move up the call stack to the doASum() function and inspect its state as though we had set a breakpoint on the third line, where multiply() is invoked (figure A.6). In a complex program, the call stack may be very deep, and the debugger is capable of moving up and down among all layers.
Figure A.6. The Mozilla Venkman debugger allows inspection of local variables in functions higher up the call stack than the current point of execution.
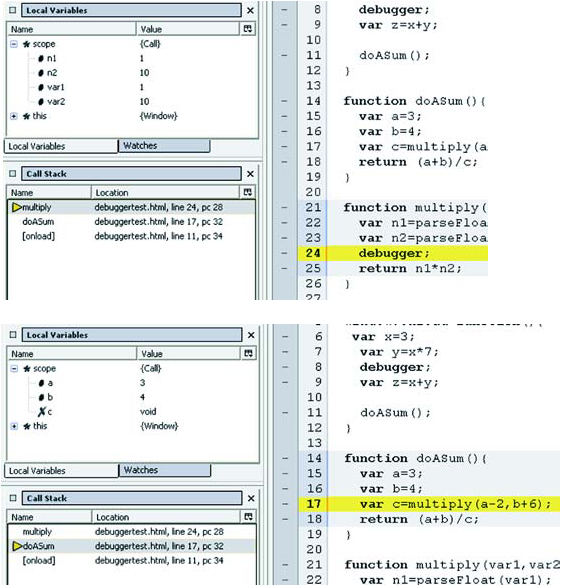
Watching expressions
Some debugger tools are capable of evaluating expressions on the fly and allow the user to predefine code expressions that will be reevaluated as the debugger moves across the code. These expressions can make use of any variables currently in scope, allowing the developer to interact with the program while it is running.
Conditional breakpoints
Setting a breakpoint at a particular point in the code can give a developer fine-grained control over when to invoke the debugger, but in some cases, this control is not enough. When executing a loop, for example, any breakpoint inside the body of the loop will be executed each time the loop is executed. Let’s take the following example:
for (var i=0;i<100;i++){
  var divisor=i-57;
  var val=42/divisor;
  plotOnGraph(i,val);
}
Running this code causes an exception to be thrown midway through the loop. In this case, a quick inspection of the code tells us that this will happen when i is 57, and we attempt to divide by zero. However, let’s pretend for now that it isn’t so obvious, as will often be the case with real-world code. We suspect that the divisor being set to zero is the problem but don’t know when such a condition will occur.
We could set a debugger breakpoint inside the loop:
for (var i=0;i<100;i++){
  var divisor=i-57;
  debugger;
  var val=42/divisor;
  plotOnGraph(i,val);
}
but we would need to click the resume button on our debugger numerous times to step through the loop to the point where we encounter the error condition. If we’re being clever, we can test for the error condition in our code:
for (var i=0;i<100;i++){
  var divisor=i-57;
  if (divisor==0){ debugger; }
  var val=42/divisor;
  plotOnGraph(i,val);
}
This will take us straight to the fifty-seventh iteration of the loop, the one at which our error condition occurs. We could describe this as a conditional breakpoint—that is, it will break the flow of execution only if a certain condition is met.
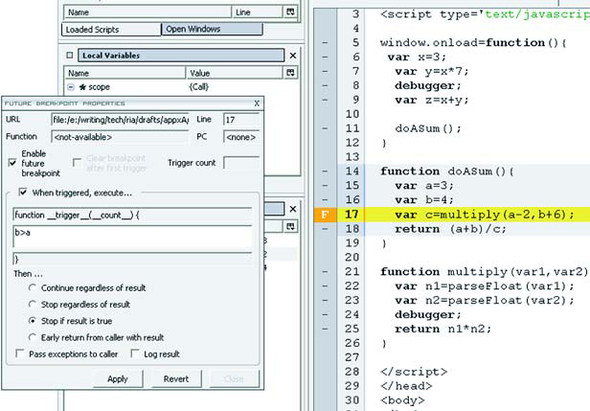
We can set up conditions in this way only by modifying the code. However, if we are assigning breakpoints through the debugger IDE, we can set a condition on the breakpoint independently of the actual code (figure A.7). Some debuggers do support this facility, allowing the user to attach expressions to a breakpoint, and break the flow only if the expression evaluates to true.
Figure A.7. Setting up a conditional breakpoint in the Mozilla Venkman debugger
Changing the values of variables
If we encounter an error condition, our program execution halts. In a debugging session, we may realize what the solution is but want to coerce the program into continuing anyway, in order to test some later piece of code under the current set of conditions.
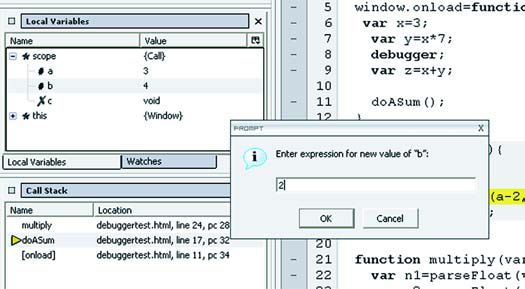
Some debuggers will allow us to do this by providing write as well as read access to local variables (figure A.8). In the case of our loop example shown previously, if we know that a divisor value of 0 is going to be problematic but want to explore some code following the loop, we could temporarily reassign a value of 1 to the divisor, letting the flow of execution continue.
Figure A.8. Changing the value of a variable in a running program using the Mozilla Venkman debugger
A number of debuggers for JavaScript are available. Free debugging tools include the Venkman plug-in for Mozilla Firefox and the Microsoft Script Debugger (see the Resources section at the end of this appendix for information on both of these) for Internet Explorer. Venkman supports all of the advanced features described previously, as well as having an inbuilt profiling tool, which we describe in chapter 7. The Microsoft Script Debugger supports call stack navigation and an “immediate window” for executing JavaScript on the fly, including querying and reassigning local variable values.
Visual Studio and Komodo IDEs also support JavaScript debuggers with an advanced set of capabilities.
Server-side debugging
In addition to being able to debug JavaScript on the client, it is often useful to debug the server-side code, too. Java and .NET IDEs generally ship with high-quality debuggers. Eclipse’s Java tools and Visual Studio both offer debugging out of the box, as do most other IDEs. For debugging Java-based web applications, the JBoss application server and Eclipse plug-ins provide a simple system for deploying and debugging web applications. Web development versions of Visual Studio ship with a built-in ASP.NET-enabled web server for development purposes. Visual Studio is the only development environment to my knowledge to support debugging of client-side and server-side code within the same user interface.
It can be also very useful to debug network traffic. Again, a range of free and commercial tools is available for this purpose. Let’s look at them now.
A.3.3. HTTP debuggers
Between the Ajax client and the web server, all communications take place over HTTP. This in itself can be a complex business and may be a source of errors. At times, it is reassuring to be able to inspect the HTTP traffic, to look at the headers, querystrings, content of the request and response, and sequence of interchanges.
LiveHTTPHeader
Mozilla Firefox supports an extension called LiveHTTPHeaders, which is capable of logging HTTP traffic from the browser (figure A.9). Request and response headers are recorded and displayed, and they can be exported as text files to provide a permanent record of an Ajax session. Querystrings from GET and POST methods are also recorded, but the response content is not.
Figure A.9. The Mozilla LiveHTTPHeaders extension can log HTTP traffic and present details of request and response headers.

LiveHTTPHeaders supports only reading headers. Other Firefox extensions are available for modifying headers in transit, such as the Modify Headers extension.
Fiddler
Microsoft Research recently released a .NET-based application called Fiddler that fulfills a similar role to LiveHTTPHeaders but also allows for scripted rewriting of headers on the fly, using JavaScript. This provides a similar capability to the ability to change variable values in some debuggers during a session, and it can be used to quickly work around bugs in an application while it is running.
Unlike LiveHTTPHeaders, which is integrated into the browser, Fiddler is an independent process that acts as a proxy between the client and server. As such, it can be used with any combination of browser and web server.
Charles
Charles is a shareware tool written in Java. Like Fiddler, it acts as a proxy between browser and server. It can log request and response data, including the content, and export sessions as spreadsheet files. It also provides a highly configurable built-in bandwidth-shaping tool, which allows easy simulation of very slow connections over a fast LAN or even when the client and server are both deployed to the same machine.
There are a number of other useful tools in this category, which we don’t have space to cover fully here. If Charles and Fiddler don’t do what you want, a quick online search for “Ethereal” or “Apache TCPMon” might help you out.
This concludes our review of off-the-shelf debugging tools. By combining a server-side code debugger, a JavaScript debugger on the client, and an HTTP debugger in between, it is possible to intercept your application at any point in its lifecycle and be able to see what it is really getting up to.
Debuggers are, by their nature, intrusive. Although they are very powerful in many ways, there are times when a background logging system is preferable. Plenty of mature server-side logging frameworks are available, such as Apache log4j for Java, but, once again, the JavaScript toolset is lagging. In the final part of this section, we’ll look at a simple logging tool written in JavaScript that can be integrated into your browser code to provide a record of background activity.
A.3.4. Building your own cross-browser output console
A debugger gives a developer a very detailed view of running code, but it interrupts the ordinary flow of events. When tracking a user’s interactions for usability testing or monitoring the execution of code in a tight loop, it is sometimes more useful to log activity without interrupting the flow.
Web browser JavaScript doesn’t provide a built-in logging facility. (The Mozilla JavaScript console may look like one at first glance, but it can only be written to by the browser and by extensions.) In this section, we’ll develop our own simple logging system and demonstrate its use in one of our example applications. Let’s sketch out our requirements first. We can’t write to a local file because of the JavaScript security model, so we’ll opt to write to an on-screen console element instead. We want to be able to append messages to our console. Ideally, we’d like to be able to use HTML markup in our logging, as well as plain text. We’d also like to clear the console of existing messages.
To keep things simple, we’ll pass a DOM element in as an argument to the object constructor. The placement of the console can then be determined on a page-by-page basis. The constructor simply sets up a two-way reference between the DOM element and the console object itself:
Console=function(el){
  this.el=document.getElementById(el);
  this.el.className='console';
  this.el.consoleModel=this;
  this.clear();
}
To append to the console, we simply pass in an argument, which may be a textual string or a DOM element, and optionally pass in a CSS class name as well:
Console.prototype.append=function(obj,style){
  var domEl=styling.toDOMElement(obj);
  if (style) {
    domEl.className=style;
  }
  this.el.appendChild(domEl);
}
The toDOMElement() method calls a generic styling function, which ensures that the message is wrapped up as a DOM element. If the argument is already a DOM element, it is returned unchanged. If it is a string, it is wrapped in a DIV element:
styling.toDOMElement=function(obj){
  var result=null;
  if (obj instanceof Element){
    result=obj;
  }else{
    var txtNode=document.createTextNode(String(obj));
      var wrapper=document.createElement('div'),
      wrapper.appendChild(txtNode);
      result=wrapper;
  }
  return result;
}
To clear the console, we simply remove all child elements from it, one by one:
Console.prototype.clear=function(){
  while(this.el.firstChild){
    this.el.removeChild(this.el.firstChild);
  }
}
That provides a simple implementation of an in-browser logging console. Let’s have a look at how we use it now. We’ll take the ObjectViewer example from chapters 4 and 5. First, we define a DOM element in our page to contain the logging console
<div id='console'></div>
and a CSS class to position it on screen for us:
div.console {
  position:absolute;
  top:32px;
  left:600px;
  width:300px;
  height:500px;
  overflow:auto;
  border: 1px solid black;
  background-color: #eef0ff;
}
We are using absolute positioning here, but we could use any Ajax user interface technique to do the job for us. Next, we need to create the logging object. We’ll define it as a global variable in this example for convenience.
var logger=null;
window.onload=function(){
  logger=new Console("console");
  logger.append("starting planets app");
  ...
}
We initialize the logger in the window.onload event, so that the DOM element that it requires is guaranteed to be created. Now let’s suppose that we want to log a message whenever a planet object is created in our domain model. We simply need to invoke logger.append():
planets.Planet=function
  (id,system,name,distance,diameter,image){
  this.id=id;
  ...
  logger.append("created planet object '"+this.name+"'");
}
Similarly, we can add logging statements to the ObjectViewer code when we edit values and launch pop-up subwindows, to the ContentLoader object when we load network resources, and so on, in order to track the behavior of our codebase while it is running. We can style important messages, for example, network failures:
net.ContentLoader.prototype.defaultError=function(){
  logger.append("network error! "+this.url, "urgent");
}
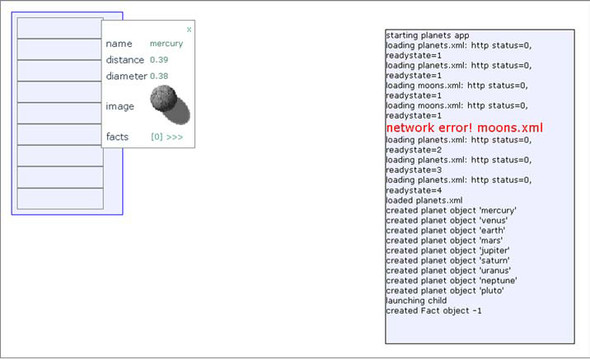
Figure A.10 illustrates the logger console in operation as part of the modified planet viewer application.
Figure A.10. The logging console in operation, monitoring object creation, network activity, user edits, and so on. We have added a second network request to a nonexistent server resource, moons.xml, to demonstrate the display of the styled logging message.
This demonstration shows how straightforward it is to add simple logging capabilities to an Ajax application. The system is considerably simpler than server-side logging frameworks such as Apache’s log4j. We leave it as an exercise for the reader to add multiple categories of logging that can be turned on and off independently.
Now let’s move on to our next type of tool: the DOM inspector.
A.4. DOM inspectors
In an Ajax application, it is common to modify the user interface by modifying the DOM programmatically. Using a JavaScript debugger, we can walk through our DOM manipulation code one step at a time and ensure that it is doing what we want it to do.
The DOM, however, is still one step removed from the view presented to the user. We may be confident that our code is altering the DOM in the way that we think it is, but this won’t necessarily translate into the user interface that we expect. A DOM inspector is a tool that allows the developer to inspect the relationships between the DOM tree that our code works with and the visible interface that the end user sees.
DOM inspectors need to be tightly integrated with the browser and always support only one make of browser. The most popular DOM inspector is the one that ships with Mozilla Firefox, so we’ll look at that first, and then we’ll look at the alternatives for Internet Explorer.
A.4.1. Using the Mozilla DOM Inspector
The DOM Inspector tool is bundled with Firefox but needs to be selected as a custom option during installation. If the DOM Inspector is installed, it will appear in the browser’s menu system under the Tools menu as the option DOM Inspector. When initially opened, the DOM Inspector consists of two panes side by side (figure A.11). The left-hand pane presents a tree-table widget, typically showing only a document and an HTML node initially. The nodes may be opened to reveal a head and body to the document, and within the body, an assortment of nodes representing the HTML markup of a page, plus any elements that have been constructed programmatically. Where nodes have been assigned ID or CSS class attributes, these will be displayed in additional columns of the tree-table widgets.
Figure A.11. The Mozilla DOM Inspector presents a structural view of the DOM behind a web page, including nodes declared in the HTML and those generated programmatically.

This tree widget is synchronized to the page being displayed in the main browser window. Selecting a tree node with the mouse will make the related element in the page layout flash a red border. The relationship is two-way, too. By invoking the Search > Select Element by Click menu option on the DOM Inspector, the user can click on the web browser window and highlight the tree element corresponding to the element clicked upon. (There’s also a toolbar button for this functionality.)
The right-hand pane lists information about the current node in one of several possible formats, including DOM node, CSS style rules, and as a JavaScript object (figure A.12). In the latter mode, the object may be programmatically scripted by right-clicking on the right-hand pane and selecting the Evaluate JavaScript button. The currently selected DOM element can be referred to as target, so, for example, typing in
Figure A.12. The Mozilla DOM Inspector allows direct scripting access to elements in the DOM. The variable name target refers to the currently selected DOM node, in this case the image of the planet, whose border we have just altered.
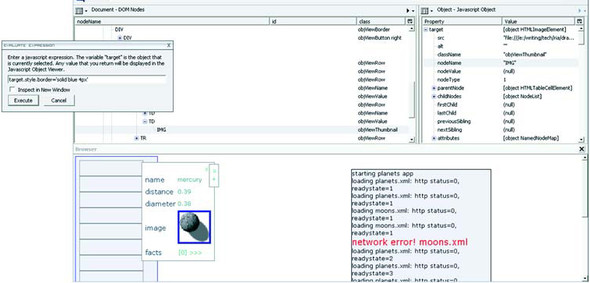
target.style.border='4px solid blue'
will outline that element with a thick blue border.
The DOM Inspector also has a third pane, below the other two, into which the visible content of a document can be rendered (figure A.13). If the user types a page address into the URL bar and clicks on the Inspect button, this pane will appear, allowing the abstract DOM and the visible document to be examined side by side.
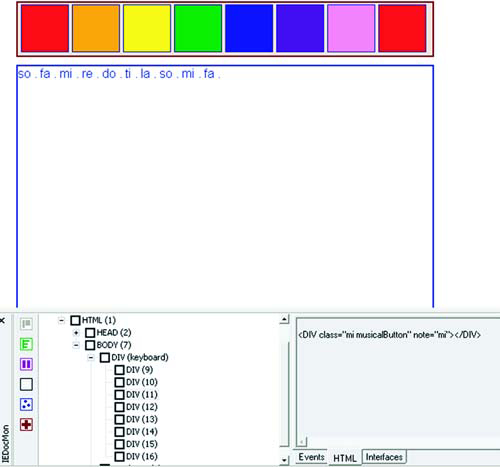
Figure A.13. The IEDocMon toolbar for Internet Explorer provides functionality similar to the Firefox DOM Inspector, allowing for rapid resolution of rendering issues with programmatically generated user interfaces.
A.4.2. DOM inspectors for Internet Explorer
As with all the Mozilla-based toolkits, a major drawback is that the inspectors can’t be used to inspect problems that occur only in Internet Explorer. Several DOM inspectors with similar functionality are available for Internet Explorer. Many are commercial or shareware, but some workable free versions also exist, such as the IEDocMon utility (see the Resources section for URLs).
Like the Mozilla DOM Inspector, IEDocMon provides a simple two-pane view of the DOM, with a tree on the left and node details on the right (figure A.13).
That concludes our discussions of specific types of development tools. One very active source of Ajax tools is the community that has sprung up around the Firefox browser’s extensions capabilities. In the following section, we’ll briefly outline how to find and install Firefox extensions.
A.4.3. The Safari DOM Inspector for Mac OS X
The Mac OS X browser Safari has a built-in DOM inspector too. This is available from the debug menu. The debug menu is not enabled by default. To enable it, open the Terminal application and type in the following:
defaults write com.apple.Safari IncludeDebugMenu 1
Depending on your privileges, you may need to sudo this command. Once it has executed, restart Safari and the debug menu should appear.
A.5. Installing Firefox extensions
We’ve already looked at two very useful Firefox extensions, the Venkman debugger and the LiveHTTPHeaders network debugger. There are many extensions available for Firefox, and several are designed for use by web developers. In this section, we’ll walk briefly through the process of installing a Firefox plug-in, using the Modify Headers extension as an example.
Firefox extensions are installed from the web browser itself. Initially, you need to locate the download page for the extension; in this case it’s found at https://addons.mozilla.org/extensions. The Mozilla add-ons site can also be launched from the browser by clicking the Tools > Extensions menu and then selecting the Get More Extensions link in the pop-up dialog. Figure A.14 shows Firefox pointing at the Mozilla Update site page for the Modify Headers extension.
Figure A.14. The Firefox browser lists all installed extensions in a pop-up dialog. More extensions can be installed from the Web.

In this case, the hyperlink we need is the large Install Now button. We click on it, and a dialog appears, warning us of the dangers of installing unsigned extensions (figure A.15).
Figure A.15. Firefox extensions can be installed from the Web, using a special downloadable archive format.

Unlike ordinary JavaScript code, extensions have full access to the local filesystem. Signing extensions offers a guarantee from the author that the extension hasn’t been tampered with, but in practice, not all extensions are signed. After installation, the extension is registered in the pop-up Extensions dialog (figure A.16).
Figure A.16. Newly installed extensions are visible in the Extensions dialog immediately but won’t become active until the browser is restarted.
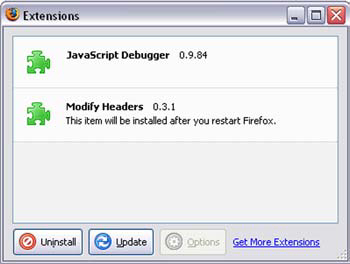
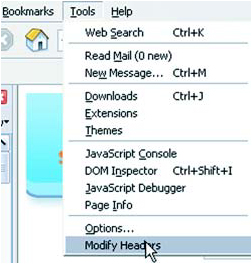
All that remains is to close down all open Firefox windows (including DOM inspectors, debuggers, and so on), and restart Firefox. The extension is then ready to run, appearing as an option in the Tools menu (figure A.17).
Figure A.17. After you restart the browser, the extension is ready to use.
Firefox supports a large number of extensions, many of which are aimed at web developers. Not all extensions are hosted on the addons.mozilla.org site, but this is certainly the first port of call for such things. The installation procedure is generally similar for all extensions, including the Venkman debugger that we discussed earlier.
This concludes our review of development tools for Ajax. We hope that it has provided you with some useful advice in getting your project off the ground.
A.6. Resources
This chapter was all about tools. Here are links to those that we featured:
- Textpad: www.textpad.com
- jEdit: www.jedit.org
- Eclipse: www.eclipse.org
- Eclipse JavaScript plug-ins: http://jseditor.sourceforge.net/
- Visual Studio Express: http://lab.msdn.microsoft.com/express/
- Dreamweaver: www.macromedia.com/software/dreamweaver/
- Komodo: www.activestate.com/Products/Komodo/
- Venkman Debugger: www.mozilla.org/projects/venkman/
- Microsoft Script debugger: www.microsoft.com/downloads/details.aspx?FamilyID=2f465be0-94fd-4569-b3c4-dffdf19ccd99&displaylang=en
- Charles: www.xk72.com/charles/
- Fiddler: www.fiddlertool.com
- LiveHttpHeaders: http://livehttpheaders.mozdev.org/
- Modify Headers extension: https://addons.mozilla.org/extensions/moreinfo.php?id=967&vid=4243
- IEDocMon DOM inspector for IE: www.cheztabor.com/IEDocMon/index.htm
