Utility Energy Efficiency Programs
Lessons from the Past, Opportunities for the Future
Steven Nadel, Executive Director, American Council for an Energy Efficient Economy
1 Introduction
Utility energy efficiency programs in the United States began with limited efforts following the 1973 Arab oil embargo. Programs became more common in the 1980s and 1990s and following retrenchment in the second half of the 1990s, have rapidly grown since about 2005. In 2010, approximately $4.6 billion was invested in U.S. electric sector energy efficiency programs – plus an additional $0.9 billion in natural gas programs [1]. Spending on energy efficiency programs over time is summarized in Figure 2.1. In 2010, these programs reduced U.S. electricity use by an estimated 88 billion kWh, which represents 2.3 percent of sales that year [2]. Annual energy savings are summarized in Figure 2.2. However, some states have used energy efficiency programs to reduce electric consumption by more than 10 percent, including a few places where energy efficiency savings are greater than underlying sales growth. As a result consumption is actually declining, hence the subtitle of this volume. In this chapter, it is argued that similar results can be achieved in much of the United States, and in other somewhat similar countries.

Figure 2.1 Annual Spending on U.S. Utility Sector Energy Efficiency Programs. Source: [1].
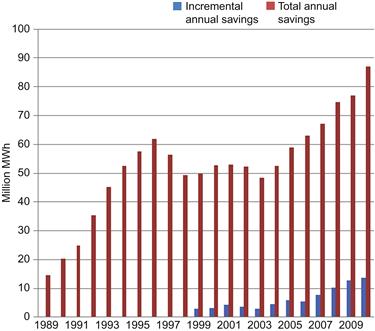
Figure 2.2 Annual Energy Savings from U.S. Utility Sector Energy Efficiency Programs.
Notes: “Incremental annual savings” are the savings from energy-saving measures installed that year. “Total annual savings” include savings from all measures in place in a given year, regardless of when the measures were installed. The latter measure accounts for the fact that the typical energy efficiency measure has a service life of multiple years. These figures only include savings from programs operated by electric utilities that report to the Energy Information Administration. Programs operated by non-utility entities (e.g., the New York State Energy Research and Development Authority) are generally not included, even if programs are funded out of utility rates. Source: ACEEE analysis using data from [2] (1999–2010 data) and [3] (1989–1998 data).
This chapter reviews the history of utility sector energy efficiency programs and summarizes some of the key lessons learned. In particular, this chapter focuses on recent efforts by leading utilities to maximize cost-effective energy savings. These results are interpreted in light of underlying sales growth trends, showing how some utilities are saving enough through energy efficiency to actually result in sales decline, not growth. The chapter ends with a look to the future, discussing longer-term energy-savings opportunities and strategies to capture these savings.
More specifically, section 2 provides a brief history of utility energy efficiency efforts, discussing four different eras of utility programs. Section 3 discusses the major reasons many utilities invest in energy efficiency. Section 4 discusses recent efforts by leading states, efforts that are flattening, and in some cases eliminating sales growth. Section 5 summarizes some of the key lessons learned as a result of these three decades of efforts. Section 6 summarizes the results of several recent studies that estimate the potential for energy efficiency savings out to 2050. Section 7 discusses a variety of issues that utilities will need to address as they seek to capture these savings. Section 8 discusses a variety of program strategies for the coming decades to address these issues and achieve the available savings. Finally, sections 9 and 10 discuss these results and draw conclusions.
2 A Brief History of U.S. Utility Energy Efficiency Efforts
U.S. electric utility energy efficiency programs began in the 1970s following the first “energy crisis” triggered by the Arab oil embargo. These initial programs primarily provided information to consumers and businesses, but did not offer financial incentives. In the early 1980s, some utilities recognized that only modest amounts of energy savings resulted from information-type programs and began to include in financial incentives in order to increase participation levels and savings. For example, a review of evaluation results by Collins et al. [4] found that most information programs resulted in energy savings of 0 to 2 percent. On the other hand, a review by Geller [5] of several programs in which different groups received no financial incentives, low incentives, or high incentives, found much higher participation with incentives. For example, Geller describes a study of refrigerator rebates by New York State Electric and Gas (NYSEG) that found the market share for efficient refrigerators was 60 percent in an area receiving information, advertising, and $50 rebates, 49 percent in an area with information, advertising, and $35 rebates, 35 percent in an area with information and advertising, and 15 percent in a control area without any information, advertising, or incentives. These more robust programs began in New Jersey – where replacement power was needed after the Three Mile Island reactors were shut down – the Northwest following the cancelation of multiple nuclear power plants there – and California. Such programs gradually spread to about half the states in the early 1990s, aided by improved understanding of what worked and what didn’t (see, e.g., [6]) and initial efforts to remove disincentives to utility investment in energy efficiency and to provide shareholder incentives ([7]; also chapter by Cavanagh).
In the mid-1990s, however, utility investments in energy efficiency contracted (see Figure 2.1), driven by efforts to restructure the electric utility industry in many states. Restructuring began in California in 1994 and was intended to introduce more competition into electricity markets, with the objective of using competition to lower prices. In some states, such as California, utilities sold their power plants, leaving only a regulated distribution utility. Other power providers were free to market directly to customers and many utilities cut their energy efficiency spending in order to cut short-term prices, allowing them to better compete for customers. There was also a belief among some restructuring adherents that improving the operations of the market would unleash increased investment in energy efficiency, without reliance on utility programs (multiple examples of this belief are cited by [8]).
However, over time, it became clear that restructuring did not reduce rates on average nor did it spur increased investments in energy efficiency. For example, a paper by Cain and Lester [9] found that restructured states had lower rate increases in the early years, but by 2008 average rate increases in restructured and non-restructured states were the same. And while these were averages, some well-publicized failures, such as in California, took the wind out of restructuring’s sails (see, e.g., [10] and [11] for views from the left and right). Furthermore, data presented by Kushler et al. [8] found that “private market actors each face significant limitations in their interest and ability to deliver energy efficiency and thus far have demonstrated no realistic capability to replace government/regulatory policies and programs to provide energy efficiency.”
In the 1990s, the market transformation approach to program design also gained increased attention. The market transformation approach seeks to identify and remove barriers to specific energy-saving technologies and practices, so that the energy-efficient measures can thrive in the market and become business-as-usual. The market transformation approach was found to often have large savings and low costs per kWh saved, although the approach could only be applied in some markets and not all [12].
Starting in 1999, energy efficiency spending by utilities began to increase again, and this increase has picked up speed since 2006 (Figure 2.1). This increase is driven by two factors – the spread of energy efficiency to many more states and increases in savings goals in states that had been offering programs. The spread of programs to more states is illustrated in Figure 2.3, which shows states with significant commitments to energy efficiency before and after 2007, where “significant commitment” means either enactment of mandatory energy-savings targets for utilities, often called energy efficiency resource standards (EERS) and/or incremental annual savings achieved of at least 0.2 percent of electricity sales. Growth in savings in specific states is illustrated by Vermont, where savings have steadily ramped-up to incremental annual savings of about 2 percent of sales each year (Figure 2.4).
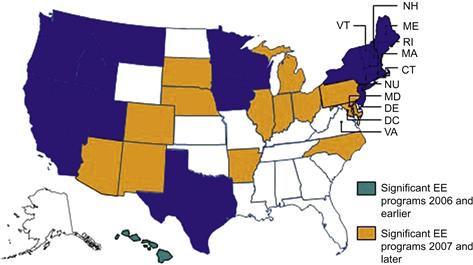
Figure 2.3 States With a Significant Commitment to Utility Sector Energy Efficiency Programs. Source: ACEEE analysis.

Figure 2.4 Energy efficiency saving as a percentage of Vermont’s electricity needs. Source: [13].
3 Why Do Utilities Invest in Energy Efficiency?
There are multiple reasons many utilities invest in energy efficiency, with the motivations varying from utility to utility. This section summarizes some of the main reasons, with an emphasis on how these motivations have increased in recent years. Major rationales for utility investments in energy efficiency include the following:
![]() Energy efficiency is generally the lowest cost resource, less expensive than new power plants.1 This is illustrated in Figure 2.5, which compares the range of costs to the utility per kWh for energy efficiency and new power plants. In recent years, the cost of new power plants has increased, but energy efficiency costs have not changed much.2
Energy efficiency is generally the lowest cost resource, less expensive than new power plants.1 This is illustrated in Figure 2.5, which compares the range of costs to the utility per kWh for energy efficiency and new power plants. In recent years, the cost of new power plants has increased, but energy efficiency costs have not changed much.2

![]() Energy efficiency is popular with many customers as it is something that helps customers lower their energy bills. For example, Leuthauser and Weaver [16] found that demand-side management programs were a leading contributor to improved customer satisfaction ratings for Mid-American Energy from 2001 to 2005.
Energy efficiency is popular with many customers as it is something that helps customers lower their energy bills. For example, Leuthauser and Weaver [16] found that demand-side management programs were a leading contributor to improved customer satisfaction ratings for Mid-American Energy from 2001 to 2005.
![]() It can be difficult and take many years to get all the necessary approvals for new power plants. Getting approvals for energy efficiency is generally easier.
It can be difficult and take many years to get all the necessary approvals for new power plants. Getting approvals for energy efficiency is generally easier.
![]() Many utility regulators are supportive of utility energy efficiency investments, and regulated utilities generally prefer to satisfy regulators. In recent years, as discussed in the chapter by Cavanagh, many states have improved the business case for utility investments in energy efficiency, including program cost recovery, addressing impacts of lost sales on the ability to recover fixed costs, and providing shareholder incentives for meeting energy efficiency goals. Figure 2.6 shows the status of shareholder incentives as of April 2012. An analysis by Hayes et al. [18] found that utilities that received such incentives on average spend 2.1 to 5.0 times more on energy efficiency per customer, varying by year, than utilities without such incentives. These issues are described more fully by York et al. [19].
Many utility regulators are supportive of utility energy efficiency investments, and regulated utilities generally prefer to satisfy regulators. In recent years, as discussed in the chapter by Cavanagh, many states have improved the business case for utility investments in energy efficiency, including program cost recovery, addressing impacts of lost sales on the ability to recover fixed costs, and providing shareholder incentives for meeting energy efficiency goals. Figure 2.6 shows the status of shareholder incentives as of April 2012. An analysis by Hayes et al. [18] found that utilities that received such incentives on average spend 2.1 to 5.0 times more on energy efficiency per customer, varying by year, than utilities without such incentives. These issues are described more fully by York et al. [19].
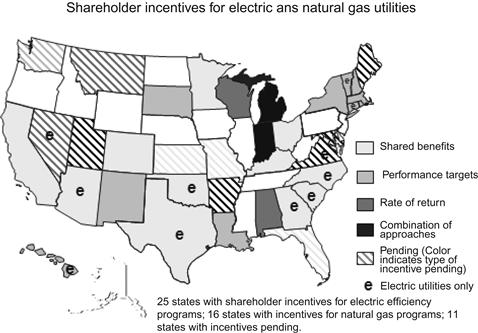
Figure 2.6 States with Shareholder Incentives for Energy Efficiency as of April, 2012. Source: [17].
![]() Energy efficiency programs can typically be ramped up in a few years, much quicker than a new baseload power plant.
Energy efficiency programs can typically be ramped up in a few years, much quicker than a new baseload power plant.
![]() To buy time until regulatory uncertainties are resolved. Presently there is a lot of uncertainty regarding future environmental regulations, particularly regarding greenhouse gas emissions. Some utilities are postponing major new power plant investments until these uncertainties are resolved. Energy efficiency can help get demand and supply in balance in the mean time.
To buy time until regulatory uncertainties are resolved. Presently there is a lot of uncertainty regarding future environmental regulations, particularly regarding greenhouse gas emissions. Some utilities are postponing major new power plant investments until these uncertainties are resolved. Energy efficiency can help get demand and supply in balance in the mean time.
![]() To help meet environmental rules. Many new environmental rules are being set, including for air toxics, nitrogen oxide levels in eastern states, coal ash, cooling water, and carbon dioxide emissions. Energy efficiency has zero or very low emissions and can be part of a compliance plan with these rules. Hayes and Young [79] discuss these issues in more detail.
To help meet environmental rules. Many new environmental rules are being set, including for air toxics, nitrogen oxide levels in eastern states, coal ash, cooling water, and carbon dioxide emissions. Energy efficiency has zero or very low emissions and can be part of a compliance plan with these rules. Hayes and Young [79] discuss these issues in more detail.
![]() Energy efficiency has been shown to work. As more and more states and utilities embrace and are successful with energy efficiency, states and utilities that were initially skeptical can become convinced that efficiency investments have a role to play.
Energy efficiency has been shown to work. As more and more states and utilities embrace and are successful with energy efficiency, states and utilities that were initially skeptical can become convinced that efficiency investments have a role to play.
However, not all utilities have embraced these rationales. In particular, some states have not addressed the business case for utility investments in energy efficiency and as a result, energy efficiency investments may be less profitable than investments in new power plants. Likewise, some utilities are accustomed to proposing new power plants and other “supply-side” investments without a careful analysis of energy efficiency and other “demand-side” alternatives, and some utility commissions are willing to approve these proposals.
While these rationales for energy efficiency apply to the United States in particular, many of them are likely to apply in many other countries.
4 Recent Efforts in Leading States
As noted above, the average American utility is saving about 2 percent of kWh sales from energy efficiency programs [2]. Incremental annual savings of measures installed in 2009 averaged 0.37 percent of sales [1]. However, results vary widely from state to state, as is illustrated in Figure 2.7. In 2009, the last year for which complete data are available, five states were saving more than 1 percent of sales from efficiency measures installed that year under their programs. In addition, several states have recently made major commitments to expand their energy efficiency programs. In the sections below we discuss some of these leading states.

Figure 2.7 Electricity Savings from Utility sector Energy Efficiency Programs in 2008 and 2009. Source: [1].
4.1 California
California was one of the first states to aggressively pursue energy efficiency, and the combination of utility sector energy efficiency programs combined with equipment efficiency standards and building code improvements has stabilized electricity use per capita in the state, while electricity use per capita has grown in most other states (Figure 2.8). Since the state’s population is growing slowly (e.g., about 1 percent per year from 2000 to 20103), electricity use is growing as well, albeit slowly.
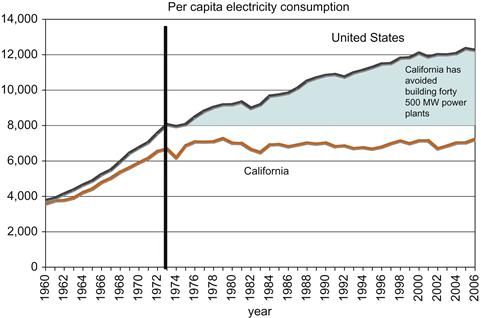
Figure 2.8 Per Capita Electricity Consumption in California and the United States. Source: [21].
As shown in Figure 2.7, California utility programs have been averaging savings of about 0.9 percent of sales each year. As discussed in the sections that follow, several states are doing even more.
4.2 Pacific Northwest
The Pacific Northwest – Washington, Oregon, Idaho, and western Montana – is another region that has been pursuing utility energy efficiency investments since the 1980s. In the Northwest, power sector planning is driven by a regional council, the Northwest Power and Conservation Council (NWPCC). Every five years they prepare a regional power plan that guides activities by the Bonneville Power Administration (a regional wholesale power provider owned by the federal government) and is also generally used by state utility commissions and many utilities. They also regularly summarize the role of energy efficiency in the region since 1980. A recent summary is presented in Figure 2.9 and shows that energy efficiency has “supplied” about half of the regional sales growth since 1980.
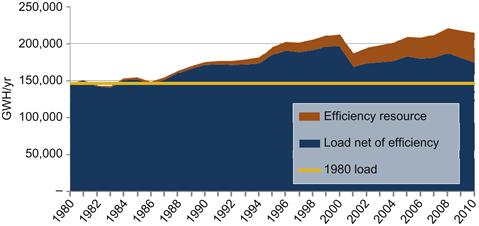
Figure 2.9 Role of Energy Efficiency in the Northwest Since 1980 Relative to Regional Electricity Sales. Source: [22].
In their Sixth Power Plan, adopted in 2010, the NWPCC decided to significantly ramp up energy efficiency investment and savings because it was cost effective, was subject to less uncertainty than other new energy sources, and would also help meet environmental objectives such as reducing emissions of greenhouse gases. Specifically, they ramped up incremental efficiency savings to 1.5 percent of sales each year, essentially ending sales growth. This is illustrated in Figure 2.10. They estimate that energy efficiency (labeled “conservation”) will meet 85 to 90 percent of their resource needs – some renewable energy and natural gas generation will be added to offset power plant retirements.

Figure 2.10 Role of Energy Efficiency in the 6th Northwest Power Plan. Source: [23].
In fact, over the 2000–2010 period, electricity sales actually declined in Oregon and Washington by 9 percent and 6 percent, respectively [24] although some of this decline is likely due to the impact of the 2007–2009 “Great Recession” as well as the closure of some major aluminum and paper plants in the northwest.
4.3 New England
New England states have been operating energy efficiency programs since the late 1980s. Figure 2.4 shows energy efficiency savings in Vermont, which in the past few years have been greater than the underlying sales growth of about 1.5 percent per year and therefore sales in Vermont are declining. Vermont has been a leader, setting aggressive energy savings goals that keep challenging them to do better, and then meeting these goals. As a result, Vermont leads the nation in electricity savings as a percent of sales (Figure 2.7). Vermont is also relatively unique in that they have established an “Efficiency Utility” to run programs statewide, with money for this utility provided by the individual electric utilities in the state. Program administration by utilities versus non-utilities is discussed later in this chapter in the section Issues to Address.
In southern New England – Connecticut, Massachusetts, and Rhode Island – efficiency programs have historically saved around 0.8 percent of sales each year (Figure 2.4). But in the past three years all three states have decided to approximately triple efficiency program spending and savings, driven by the lower cost of energy efficiency savings and a desire to help meet climate change goals. In all three states, legislation was enacted calling for utilities to acquire “all cost-effective energy efficiency.” Advisory boards and collaborative program development efforts involving major stakeholders have developed plans to implement these directives, for review and approval by state utility commissions. As a result, all three states in 2012 or 2013 are targeting incremental energy efficiency savings of more than 2 percent per year, turning sales growth negative. Charts from the Massachusetts and Connecticut plans are shown in Figure 2.11. Over the 2000–2010 period, sales in Connecticut were essentially level, while Massachusetts and Rhode Island had modest growth –0.7 percent and 1.0 percent per year, respectively (EIA SEDS, 2012). With energy efficiency programs tripling in size, all three states are likely to “go negative” even when their economies recover.

4.4 Midwest
Most of the midwestern states began or increased their utility energy efficiency program efforts in the 2007–2012 period. As shown in Figure 2.7, two midwestern states – Iowa and Minnesota – used efficiency programs to reduce electricity use by nearly 1 percent per year in 2009. Both states have set energy savings goals of about 1.5 percent of sales each year [20], and as of 2009 savings from these programs were still ramping up. However, these two states had above average growth in electricity use in the 2000–2010 decade (1.2 percent/year for Minnesota, 1.6 percent for Iowa) [24], and thus even with increases in energy savings, these states may still see very modest growth in electricity use. Many of the other Midwestern states also have energy savings goals of 1 to 2 percent per year including Illinois, Indiana, Michigan, and Ohio [20], but these programs typically began around 2009 and are still ramping up. Most of these states are growing slowly, if at all, and therefore it appears that using energy efficiency to end sales growth is possible (e.g., over the 2000–2010 period sales in Michigan and Ohio declined while sales in Indiana and Illinois grew by about 0.75 percent per year) [24]. Notably, Wisconsin also set similar energy efficiency goals as its neighbors, but following a change in ruling party in the 2010 election, reversed the decision to ramp up efficiency programs as part of efforts to cut spending across most areas affected by state government.
4.5 Southwest
Energy efficiency efforts have also surged in this region in the 2007–2012 period. Nevada is among the top states in Figure 2.7, and Arizona, Utah, and Colorado have been ramping up their efforts. Particularly notable is Arizona, which has established a savings goal for its utilities of 22 percent savings by 2020, including savings of more than 2 percent per year starting in 2014 [20]. However, despite the recent recession, electricity use in these states grew by an average of 1.8 to 2.1 percent per year over the 2000–2010 decade (EIA SEDS, 2012) and thus it will take 2 percent per year savings to stabilize sales. Arizona is planning for such an event but under current policy, modest sales growth is likely to prevail in the other states in the region.
4.6 Why the Regional Differences?
A key question is why have these five regions chosen to embrace energy efficiency much more than other regions of the United States? There are no absolute answers to this question, but there are some theories.
![]() First, many of these regions tend to be more environmentally concerned than other regions.
First, many of these regions tend to be more environmentally concerned than other regions.
![]() Second, many of these regions tend to be more liberal than the nation as a whole, but there are also some fairly conservative states in this group such as Arizona, Utah, Idaho, Montana, Indiana, and New Hampshire.
Second, many of these regions tend to be more liberal than the nation as a whole, but there are also some fairly conservative states in this group such as Arizona, Utah, Idaho, Montana, Indiana, and New Hampshire.
![]() Third, some of these regions (California and New England) have above average electricity prices, although other regions are average (midwest) or even below average (southwest and northwest).
Third, some of these regions (California and New England) have above average electricity prices, although other regions are average (midwest) or even below average (southwest and northwest).
5 Key Lessons Learned
This brief review of past history and recent efforts helps to illustrate a number of key lessons that have been learned in the United States regarding utility energy efficiency programs over the past 30 years. Among the key lessons are the following:
![]() Large savings can be achieved. For example, Figure 2.4 illustrates how Vermont has used energy efficiency over the past decade to reduce energy use by about 14 percent relative to business-as-usual. Figure 2.9 illustrates how energy efficiency has met about half of sales growth in the northwest since 1980. In Vermont, as well as states such as Connecticut, Massachusetts, Washington, Oregon, Iowa, and Minnesota, energy efficiency has helped to dramatically reduce sales growth, and in some cases, even eliminate sales growth.
Large savings can be achieved. For example, Figure 2.4 illustrates how Vermont has used energy efficiency over the past decade to reduce energy use by about 14 percent relative to business-as-usual. Figure 2.9 illustrates how energy efficiency has met about half of sales growth in the northwest since 1980. In Vermont, as well as states such as Connecticut, Massachusetts, Washington, Oregon, Iowa, and Minnesota, energy efficiency has helped to dramatically reduce sales growth, and in some cases, even eliminate sales growth.
![]() Achieving large savings can be very cost effective. This is illustrated in Figure 2.5, which shows how the utility cost for energy efficiency savings has averaged about 2.5 cents per kWh, while power from new power plants costs two to ten times more. This is also shown in Figure 2.12, which shows financial savings from energy efficiency programs in the Northwest over the past 15 years.
Achieving large savings can be very cost effective. This is illustrated in Figure 2.5, which shows how the utility cost for energy efficiency savings has averaged about 2.5 cents per kWh, while power from new power plants costs two to ten times more. This is also shown in Figure 2.12, which shows financial savings from energy efficiency programs in the Northwest over the past 15 years.
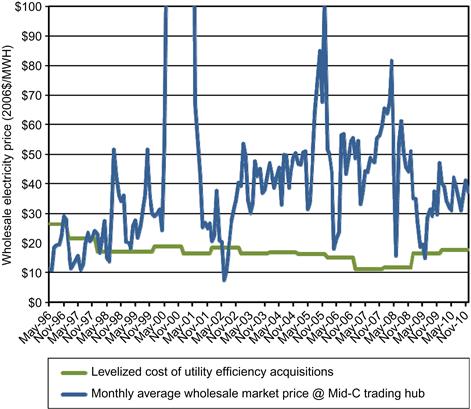
Figure 2.12 Comparison of Utility Cost of Energy Efficiency to Wholesale Power Costs in the Pacific Northwest, 1996–2010. Source: [22].
![]() While some states and regions have embraced utility energy efficiency programs, others have not. This is illustrated in Figure 2.7. Of the kWh savings from utility sector programs in 2009, the top ten states accounted for 61 percent of the total savings [1].
While some states and regions have embraced utility energy efficiency programs, others have not. This is illustrated in Figure 2.7. Of the kWh savings from utility sector programs in 2009, the top ten states accounted for 61 percent of the total savings [1].
![]() Effective policies can help drive utility energy efficiency investments. For example, of the 33 states with significant utility sector programs shaded in Figure 2.3, all but six have mandatory EERS in place. Likewise, as discussed previously, Hayes et al. [18] found much higher spending per capita on utility sector energy efficiency programs in states with shareholder incentives relative to states without such incentives. These findings are illustrated in Figure 2.13.
Effective policies can help drive utility energy efficiency investments. For example, of the 33 states with significant utility sector programs shaded in Figure 2.3, all but six have mandatory EERS in place. Likewise, as discussed previously, Hayes et al. [18] found much higher spending per capita on utility sector energy efficiency programs in states with shareholder incentives relative to states without such incentives. These findings are illustrated in Figure 2.13.
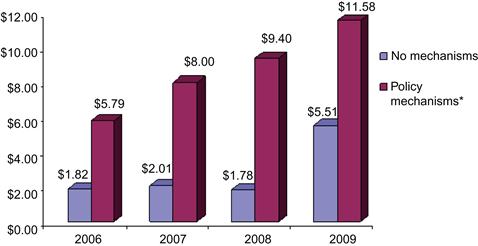
Figure 2.13 Comparison of Utility Spending Per Capita in State With and Without Shareholder Incentives. Source: [18].
![]() It requires many different programs and program approaches to achieve large savings. Programs need to serve each of the major customer classes (residential, commercial, and industrial), and even within these classes, each of the major submarkets (e.g., single-family and multi-family, space conditioning as well as lighting and appliances). There are no “silver bullets,” but instead many “silver BBs.”
It requires many different programs and program approaches to achieve large savings. Programs need to serve each of the major customer classes (residential, commercial, and industrial), and even within these classes, each of the major submarkets (e.g., single-family and multi-family, space conditioning as well as lighting and appliances). There are no “silver bullets,” but instead many “silver BBs.”
![]() Achieving high participation rates requires both financial incentives and good information/marketing. Neither can do it alone. Earlier we discussed the results of a NYSEG refrigerator rebate program, but other examples are discussed by Geller [5]. The market transformation approach can be very effective in some markets, with high savings and low costs per kWh saved. For example, the Northwest Power and Conservation Council estimates that in 2010 the Northwest Energy Efficiency Alliance, a regional market transformation organization, captured energy savings at about 35 percent of the cost of other efficiency programs in the region [27]. Financing can also help, but so far participation rates in most financing programs have been modest (see [28] and the chapter by Hesser).
Achieving high participation rates requires both financial incentives and good information/marketing. Neither can do it alone. Earlier we discussed the results of a NYSEG refrigerator rebate program, but other examples are discussed by Geller [5]. The market transformation approach can be very effective in some markets, with high savings and low costs per kWh saved. For example, the Northwest Power and Conservation Council estimates that in 2010 the Northwest Energy Efficiency Alliance, a regional market transformation organization, captured energy savings at about 35 percent of the cost of other efficiency programs in the region [27]. Financing can also help, but so far participation rates in most financing programs have been modest (see [28] and the chapter by Hesser).
![]() Building energy codes and appliance and efficiency standards can also result in large energy savings. And in many cases, utility sector energy efficiency programs can lay the groundwork by building the market share for efficient equipment and practices and by helping to teach designers, builders, and developers about efficient construction techniques. Figure 2.14 illustrates the contribution that codes and standards have played as part of California’s energy efficiency achievements. Utility efforts in California substantially contributed to the savings attributed in the graph to codes and standards.
Building energy codes and appliance and efficiency standards can also result in large energy savings. And in many cases, utility sector energy efficiency programs can lay the groundwork by building the market share for efficient equipment and practices and by helping to teach designers, builders, and developers about efficient construction techniques. Figure 2.14 illustrates the contribution that codes and standards have played as part of California’s energy efficiency achievements. Utility efforts in California substantially contributed to the savings attributed in the graph to codes and standards.
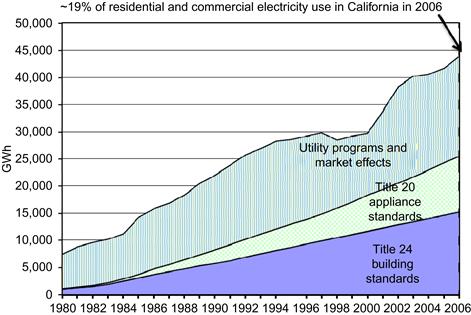
Figure 2.14 Efficiency Savings in California from Utility Programs, Codes and Standards. Source: [21].
6 Long-Term Efficiency Opportunities
This book addresses the end of demand growth. For demand growth to end, energy efficiency opportunities need to be available over many years and not just for a few years. In order to assess what may be possible going forward, it is useful to look at studies of available energy efficiency opportunities relative to established base case forecasts.
Probably the most widely used energy forecast is the Annual Energy Outlook (AEO), published each year by DOE’s Energy Information Administration. The 2012 AEO projects that U.S. electricity use will increase by an average of 0.8 percent per year over the 2010–2035 period [29], slightly less than the 0.97 percent actual growth over the 2000–2010 period [30] but significantly slower than growth in earlier decades. The AEO forecast includes savings from federal energy efficiency standards and other federal policies that have already been adopted, but does not include any new federal standards nor savings from state policies such as state EERS. The EIA forecast is shown in Figure 2.15.

Figure 2.15 Energy Information Administration Forecast of Future Demand for Electricity. Source: [29].
Several recent studies have projected business-as-usual energy use out to 2050 and then estimated how much this use could be reduced with cost-effective energy efficiency investments. The intent of these studies was to see if energy efficiency savings would be exhausted, or could be sustained over time, and also to look at opportunities for reducing greenhouse gas emissions in the long-term.
The first of these studies, entitled California’s Energy Future – the View to 2050 [31], charted paths to meet the state’s objective of reducing greenhouse gas emissions by 80 percent by 2050. They found this goal could be met by a combination of improved energy efficiency, reducing energy use by about 40 percent overall, use of low-carbon fuels and electricity, and increased electrification. The latter figured into their strategy because there are more zero- or low-carbon electricity resources than low-carbon fuel resources. Their approach is illustrated in Figure 2.16, which shows how efficiency is squeezing demand from both sides while electrification is pushing this reduced demand to the right.
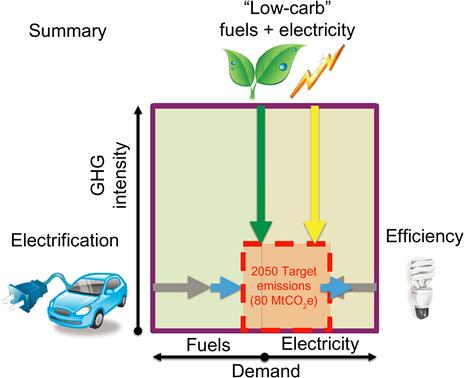
Figure 2.16 Summary of California’s Energy Future in 2050. Source: [32].
The second study was conducted by Amory Lovins and the Rocky Mountain Institute and published as a book titled Reinventing Fire. Their study sought to determine if the United States could wean itself off of oil and coal by 2050 and concluded, as illustrated in Figure 2.17, that such changes are achievable through a combination of reducing demand, better managing when demands occur, and shifting to low-carbon energy supplies. In terms of reducing demand, they estimate that end-use energy can be reduced by 46 percent relative to the EIA reference case. In terms of reducing and shifting demands, their analysis emphasizes looking at entire systems and not just individual technologies. Another key aspect of their study is to identify opportunities for profitable business investments in making the transition to a society that does not rely on oil and coal [33].

Figure 2.17 Estimated 2050 Energy Consumption Under Business-as-Usual and “Reinventing Fire” Scenarios. Source: [33].
Third, in early 2012, Laitner et al. at the American Council for an Energy-Efficient Economy (ACEEE) published an analysis of energy efficiency opportunities out to 2050 [34]. Like Lovins and RMI they examined savings by sector and their interactions. Also, like Lovins and RMI, there was a significant emphasis on savings from systems integration. They examined two scenarios – an advanced scenario that looked at just advanced technologies and practices and a “phoenix” scenario which included some changes in development patterns and existing infrastructure that further reduce energy requirements for buildings and mobility. Relative to the EIA reference case forecast, they found opportunities to use energy efficiency to reduce energy use by 42 percent (advanced case) to 59 percent (phoenix case). They estimate that pursuing these two paths will require $2.4 to 5.3 trillion dollars of public and private investment but will result in benefits of $15.0 to 23.7 trillion and will increase employment by a net 1.3 to 1.9 million jobs. Their results are summarized in Figure 2.18 and discussed in more detail in the chapter by Laitner et al.
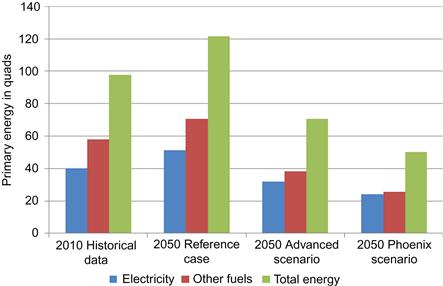
Figure 2.18 Summary of Savings Opportunities in ACEEE Study. Source: [34].
All three of these studies found opportunities for at least 40 percent energy efficiency savings by 2050. Forty percent savings over 35 years (allowing some time for ramp-up) is about 1.45 percent per year, while 2 percent per year savings for 35 years means 51 percent savings. These findings suggest that energy efficiency programs should be able to find cost-effective opportunities to reduce electricity use by 1.5 to 2 percent per year for many decades.
7 Issues to Address
The discussion up to this point indicates large opportunities to use utility sector energy efficiency programs to reduce or eliminate sales growth, if a utility and state policymakers make serious commitments to energy efficiency. However, before such results can be achieved on a widespread basis, a number of issues need to be addressed. In this section we discuss many of the major ones.
7.1 Savings from Utility Programs Vs. from Codes and Standards
As discussed above, significant savings can be achieved from codes and standards. This has led some utilities and utility organizations to wonder if there will be much savings left to harvest with utility programs. For example, the Institute for Electric Efficiency [35] estimates that if codes and standards are set aggressively, these savings alone will be enough to eliminate sales growth in the United States overall. Their results are shown in Figure 2.19. In their moderate case, code and standard savings total 9 percent of 2025 electric sales; this climbs to 14 percent in their aggressive case. These estimates are more aggressive than other recent estimates. For example, Lowenburger et al. [36] estimate 7 percent electric savings from new equipment efficiency standards in 2025. As discussed above, utility programs can help lay the groundwork for achieving these savings. At times, utilities can even get credit for these savings [37]. Still, future increases in code and standard stringency mean that utilities will need to tap into other sources of savings to meet aggressive energy savings goals. As discussed in Section 6, system optimization is one such source of savings. Other new savings opportunities are discussed in Section 8.
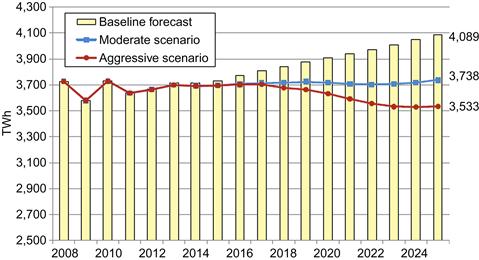
Figure 2.19 Estimated Impact of Code and Standard Energy Savings on Total US Electricity Consumption. Source: [35].
7.2 Where Will Future Energy Savings Come from?
Many energy efficiency programs have relied extensively on a few specific energy efficiency measures to achieve large savings. These include compact fluorescent lamps and upgrades of commercial, industrial, and outdoor lighting systems. For example, Efficiency Vermont [38] reports that in 2010, 69 percent of the savings they achieved came from lighting. Eventually these “tried and true” measures will be exhausted. Also, some of these measures will be driven by minimum efficiency standards that have been set but not yet taken effect. Efficiency program operators wonder where they can get large savings once these tried and true measures have run their course. A few additional options are discussed by Platt et al.
As discussed in Section 6, substantial future savings will come from improved system efficiencies in residential and commercial buildings and in factories. Programs that spur energy saving behavior in homes and businesses are also growing – CEE [39] identified 105 such programs. New technologies will also provide significant savings, such as emerging LED lighting technologies [40], heat pump water heaters [41], variable speed air conditioning [42], and efficient electronic goods (to address growing loads in these end-uses). Some of these future savings targets are discussed further in Section 8.
7.3 Will Energy Efficiency Costs Increase or Decrease?
Standard economic theory says that markets will first acquire the lowest-cost resources, and as these are exhausted, costs per kWh from energy efficiency will go up. However, new energy efficiency opportunities continue to be invented and identified, adding new low-cost resources to the mix. Also, there can be economies of scale as programs ramp-up. As a result, an analysis by Takahashi and Nichols [43] estimates that the average price of a saved kWh has gone down, not up for utilities with high-savings programs (defined as annual savings of 1 percent or more of sales). Still, after many years of 2 percent per year efficiency savings, at some point costs may well go up, but when and by how much is very uncertain.
7.4 Evaluation, Measurement, and Verification
Energy efficiency savings are evaluated according to a variety of protocols, which can vary from state to state and even utility to utility and program to program. While some evaluation is very rigorous, other evaluation can be sloppy and can overestimate savings. In order to defer the need for new generation, transmission, and distribution infrastructure, the energy savings need to be real. While most states have evaluation protocols [80], some of these protocols can be improved. Increased standardization of protocols will also make it easier to compare and add together different evaluation results. Several regions have undertaken such efforts [44,45], and DOE is also beginning such an effort [46]. These efforts are important as they improve the credibility and accuracy of energy efficiency savings estimates, allowing systems planners to better count on energy efficiency as a system resource.
7.5 Sales Growth Versus Load Growth
Most of the discussion in this chapter is on total kWh sales. But utilities also need to have sufficient capacity to serve peak demand. In recent years, peak demand has been growing more than total sales. For example, over the 2000–2010 period U.S. electricity sales grew at an average annual rate of 0.97 percent [30], while peak demand grew at about 1.1 percent [47]. Going forward, the Energy Information Administration (EIA) projects electricity sales to grow at about 0.8 percent per year over the next decade [29], while the North American Electric Reliability Corporation (NERC) expects non-coincident peak demand to grow by about 1.1 percent per year [48]. Energy efficiency program portfolios tend to reduce loads during all hours and seasons, so that a 1 percent reduction in sales will, across an entire portfolio, result in roughly a 1 percent reduction in peak demand. In order to further reduce peak demand growth, demand response programs can be used that target peak demand reductions, including shifting loads from peak to off-peak and shoulder periods. A 2009 analysis for the Federal Energy Regulatory Commission [49] estimates that demand response programs can be used to reduce peak demand by 14 percent over a decade under an “achievable participation” scenario. Business-as-usual reductions (e.g., current efforts) save only 4 percent, indicating an opportunity for an additional 10 percent peak demand reduction from demand response.
7.6 Who Should Administer Utility Sector Energy efficiency Programs?
In much of the United States utilities take the lead on administering energy efficiency programs, but in some states non-profit organizations (Efficiency Vermont, Energy Trust of Oregon), state agencies (New York State Energy Research and Development Authority, New Jersey Board of Public Utilities), or private contractors selected via an RFP take the lead. Some of these alternative administrators have been very successful, such as Vermont, and others less so. For example, in New Jersey the governor has diverted money intended for energy efficiency to help cover the state budget. Other papers have discussed the pros and cons of utility vs. non-utility administration [50,51]. State administration can be problematic, as shown by the New Jersey example and in a case in Wisconsin more than a decade ago where a political appointee steered financial incentives to friends of the governor. On the other hand, state administration has worked well in New York as the administering agency has a structure that makes political interference more difficult. Utility administration varies, with some utilities doing excellent jobs and others not so well. A key for utility administration is whether utility management really wants to make the programs succeed and puts competent and creative staff in charge. A non-profit can also do a good job if they have the appropriate experience and staff. While a few states have recently hired third-party for-profit administrators, to our knowledge such an approach is too new to be evaluated.
7.7 Supporting Policies and Policy Stability
The majority of U.S. electricity is provided by investor-owned utilities that have a fiduciary responsibility to their shareholders. These companies will generally invest in energy efficiency only if it makes business sense to their customers and shareholders. Regulators and other policymakers need to establish a foundation for this business case. As discussed above, this involves cost recovery for programs, decoupling profits from sales in some manner, and providing a return to shareholders for successful achievement of energy efficiency goals. Essentially all states provide cost recovery and about half of the states are now addressing the other two criteria (see Figure 2.6). For utility energy efficiency programs to prosper nationwide, most of the remaining states will need to address these criteria.
In addition, top policymaker support is very useful, as is policy stability. In some states, policy support for utility energy efficiency programs has ebbed and flowed, particularly as political power changes from one administration to another, making it difficult for energy efficiency programs to prosper. Particularly troublesome can be “raids” on funds for energy efficiency programs, diverting funds to other purposes such as helping to balance state budgets. Policymakers need to recognize that energy efficiency programs operate best when they are allowed to “hit stride” and continue at a stable level. If changes are made, ramp-up or ramp-down time should be allowed. If efficiency programs are suddenly scaled back, the long-term relationships with trade allies such as retailers and equipment contractors are eroded, making it more difficult for programs to be successful in the future.
7.9 Potential Wild Card: Role of Electric Vehicles
One wild card regarding future electric demand is the role of electric vehicles. Currently, very little electricity is used for transportation. If electric vehicles become very common, this will be a major new load that will affect recent sales growth patterns. For example, in August 2011 the California Energy Commission forecast that peak demand for electric vehicles will be slightly above 250 MW in 2022. As noted by Kim et al. [52], “this is almost a rounding error in a state that hit a non-coincident peak load of 60,455 MW in 2010.” Kim et al. go on to estimate peak loads in the United States for a level of 1 million electric vehicles and estimate peak demand could be as high as 1200 MW. This is about 1 percent of projected U.S. non-coincident peak demand for 2021 [48]. One million electric vehicles by 2021 might be optimistic4 and thus electric vehicles are unlikely to be a major source of new sales over this next decade. But in the much longer term, electric vehicles could play a substantial role in electric demand. For example, a 2009 National Academy of Sciences study estimated 103 million plug-in vehicles in 2050 in a “probable penetration” scenario [54].
8 Program Strategies for the Future
As noted in Section 7, some widely used energy efficiency measures will soon be mandated as part of new federal equipment efficiency standards, while some other measures have been widely promoted and therefore available remaining savings will decline. To address these trends, while continuing to achieve savings at robust annual levels, program administrators will need to modify existing programs and in some cases add new programs. In this section we summarize some of the likely program strategies for the future. These include:
![]() New construction programs that promote savings substantially higher than required under new building codes. Circa 2011 versions of national model building codes will reduce energy use in new buildings by about 30 percent relative to prior codes [55]. Utilities can promote this level of savings to lay the groundwork for adoption of these codes and will then need to promote higher levels of savings, such as 50 percent savings relative to current codes. Notably, the 50 percent savings level is targeted by federal tax incentives enacted in 2005 [56], is targeted by the American Society of Heating, Refrigerating and Air-conditioning Engineers for their 2013 model code [57], and is also the subject of a set of building profiles [58]. In addition, programs should begin to focus on “zero net energy” as a long-term new construction target. Zero net energy buildings typically reduce energy use by roughly 75 percent relative to current codes and then generate the remaining power internally, at least on an annual average basis (e.g., they generate extra power some hours, less power other hours). Some programs are already beginning to target zero net energy [59]. The goal should be to eventually ratchet up building codes to achieve these levels of performance. Further information about zero net energy buildings can be found in several relevant chapters in this book.
New construction programs that promote savings substantially higher than required under new building codes. Circa 2011 versions of national model building codes will reduce energy use in new buildings by about 30 percent relative to prior codes [55]. Utilities can promote this level of savings to lay the groundwork for adoption of these codes and will then need to promote higher levels of savings, such as 50 percent savings relative to current codes. Notably, the 50 percent savings level is targeted by federal tax incentives enacted in 2005 [56], is targeted by the American Society of Heating, Refrigerating and Air-conditioning Engineers for their 2013 model code [57], and is also the subject of a set of building profiles [58]. In addition, programs should begin to focus on “zero net energy” as a long-term new construction target. Zero net energy buildings typically reduce energy use by roughly 75 percent relative to current codes and then generate the remaining power internally, at least on an annual average basis (e.g., they generate extra power some hours, less power other hours). Some programs are already beginning to target zero net energy [59]. The goal should be to eventually ratchet up building codes to achieve these levels of performance. Further information about zero net energy buildings can be found in several relevant chapters in this book.
![]() Industrial process improvements and combined heat and power. There are large savings available by modernizing industrial processes, particularly when production lines are reconfigured roughly every 20 years. Programs need to be in touch with customers to know when process refits will happen and have a cadre of expert consultants available who know about particular industries and can help with redesign. Programs can also encourage good operations and maintenance practices and can also encourage the incorporation of energy management into overall corporate management systems. A good example of the former is the Energy Trust of Oregon Industrial Efficiency Improvement program (see [76]). A good example of the latter is the Northwest Energy Efficiency Alliance Strategic Energy Management program (see [60]). In addition, programs should help identify good applications of combined heat and power (CHP) and waste energy recovery systems – systems that generate power and thermal energy for processes together, increasing efficiency relative to separate generating plants and steam boilers. The New York State Energy Research and Development Authority (NYSERDA) has run a successful program using rate-payer funds for several years [61].
Industrial process improvements and combined heat and power. There are large savings available by modernizing industrial processes, particularly when production lines are reconfigured roughly every 20 years. Programs need to be in touch with customers to know when process refits will happen and have a cadre of expert consultants available who know about particular industries and can help with redesign. Programs can also encourage good operations and maintenance practices and can also encourage the incorporation of energy management into overall corporate management systems. A good example of the former is the Energy Trust of Oregon Industrial Efficiency Improvement program (see [76]). A good example of the latter is the Northwest Energy Efficiency Alliance Strategic Energy Management program (see [60]). In addition, programs should help identify good applications of combined heat and power (CHP) and waste energy recovery systems – systems that generate power and thermal energy for processes together, increasing efficiency relative to separate generating plants and steam boilers. The New York State Energy Research and Development Authority (NYSERDA) has run a successful program using rate-payer funds for several years [61].
![]() Programs targeted at the largest customers and at cohesive commercial and industrial sectors. Large savings can be achieved by building a long-term relationship with major customers where the customer and utility make multi-year commitments to work together on energy efficiency projects. For example, NStar Electric in Massachusetts has established several multiyear partnerships with its largest customers. To provide one example, in 2010 NStar and the Massachusetts Institute of Technology (MIT) instituted a $13 million three-year partnership designed to reduce MIT’s energy use by 34 million kWh, about 15 percent of MIT’s electricity use [62]. Likewise, Efficiency Vermont has established its Leadership Challenge program where it seeks commitments from its 300 largest customers to reduce energy use by 7.5 percent over 2 years. Efficiency Vermont has committed to helping each business create a comprehensive, long-term energy savings plan and is providing enhanced resources – both technical and financial – to help participants meet their goals [63]. There are also opportunities to work together with major cohesive business segments on efficiency projects involving an entire industry. For example, the Northeast Energy Efficiency Alliance has had successful programs with regional hospital associations [64] and with the Northwest Food Processors Association [65].
Programs targeted at the largest customers and at cohesive commercial and industrial sectors. Large savings can be achieved by building a long-term relationship with major customers where the customer and utility make multi-year commitments to work together on energy efficiency projects. For example, NStar Electric in Massachusetts has established several multiyear partnerships with its largest customers. To provide one example, in 2010 NStar and the Massachusetts Institute of Technology (MIT) instituted a $13 million three-year partnership designed to reduce MIT’s energy use by 34 million kWh, about 15 percent of MIT’s electricity use [62]. Likewise, Efficiency Vermont has established its Leadership Challenge program where it seeks commitments from its 300 largest customers to reduce energy use by 7.5 percent over 2 years. Efficiency Vermont has committed to helping each business create a comprehensive, long-term energy savings plan and is providing enhanced resources – both technical and financial – to help participants meet their goals [63]. There are also opportunities to work together with major cohesive business segments on efficiency projects involving an entire industry. For example, the Northeast Energy Efficiency Alliance has had successful programs with regional hospital associations [64] and with the Northwest Food Processors Association [65].
![]() Deep retrofits to substantially reduce energy use in existing buildings. Even in 2050 the majority of building floor area will be in buildings that are in existence today [29]. We need to reduce their energy use substantially through deep energy-saving retrofits at the time of major renovation. An example is the Empire State Building, which was recently retrofitted to reduce energy use by 38 percent [66]. Additional commercial building examples have been compiled by the New Buildings Institute [67]. Residential examples are being compiled by the 1000 Home Challenge, which is seeking to document 1000 deep retrofit examples [68]. Several program operators are now conducting pilot-deep retrofit programs such as National Grid [69].
Deep retrofits to substantially reduce energy use in existing buildings. Even in 2050 the majority of building floor area will be in buildings that are in existence today [29]. We need to reduce their energy use substantially through deep energy-saving retrofits at the time of major renovation. An example is the Empire State Building, which was recently retrofitted to reduce energy use by 38 percent [66]. Additional commercial building examples have been compiled by the New Buildings Institute [67]. Residential examples are being compiled by the 1000 Home Challenge, which is seeking to document 1000 deep retrofit examples [68]. Several program operators are now conducting pilot-deep retrofit programs such as National Grid [69].
![]() Advanced technologies, including “intelligent efficiency.” There are many emerging technologies that efficiency programs can promote in the future, ranging from LED lighting (particularly once prices decline), variable speed air conditioners, heat pump water heaters, and “intelligent efficiency” strategies. Intelligent efficiency uses sensors, controls, software and information and communication technology to continually monitor and identify energy waste and opportunities to improve efficiency in building, manufacturing, and transportation systems and to provide this information to people or automatic controllers that can act on this information. Intelligent efficiency differs from component energy efficiency in that it is adaptive, anticipatory, and networked [70]. For all of these, market transformation strategies should be considered – multistage interventions that improve availability, reduce cost, and eventually make targeted efficiency measures normal practice, such as leveraging codes and standards when possible. In the case of intelligent efficiency, work will also be needed on the best evaluation approaches so that savings can be documented.
Advanced technologies, including “intelligent efficiency.” There are many emerging technologies that efficiency programs can promote in the future, ranging from LED lighting (particularly once prices decline), variable speed air conditioners, heat pump water heaters, and “intelligent efficiency” strategies. Intelligent efficiency uses sensors, controls, software and information and communication technology to continually monitor and identify energy waste and opportunities to improve efficiency in building, manufacturing, and transportation systems and to provide this information to people or automatic controllers that can act on this information. Intelligent efficiency differs from component energy efficiency in that it is adaptive, anticipatory, and networked [70]. For all of these, market transformation strategies should be considered – multistage interventions that improve availability, reduce cost, and eventually make targeted efficiency measures normal practice, such as leveraging codes and standards when possible. In the case of intelligent efficiency, work will also be needed on the best evaluation approaches so that savings can be documented.
![]() Strategies to reduce growing “miscellaneous” energy uses. DOE’s Energy Information Administration estimates that by 2035, electronics and other miscellaneous energy uses will account for 50 percent of electricity use in the commercial sector and 39 percent in the residential sector [29]. These uses need to be better understood and strategies developed to reduce their energy use. For example, the New Buildings Institute and Ecova monitored these loads in a library and small office, installed a variety of no- and low-cost upgrades and reduced plug-load energy use by 17 percent in the library and 46 percent in the small office [71].
Strategies to reduce growing “miscellaneous” energy uses. DOE’s Energy Information Administration estimates that by 2035, electronics and other miscellaneous energy uses will account for 50 percent of electricity use in the commercial sector and 39 percent in the residential sector [29]. These uses need to be better understood and strategies developed to reduce their energy use. For example, the New Buildings Institute and Ecova monitored these loads in a library and small office, installed a variety of no- and low-cost upgrades and reduced plug-load energy use by 17 percent in the library and 46 percent in the small office [71].
![]() Smart grid and smart behavior. The “smart grid” has received a lot of attention but thus far has not been widely used to help promote energy efficiency. There is a need to develop and test strategies for taking the information the smart grid makes available and providing this information to people and automatic controllers in ways that they can use to save energy. This will require learning by trial and error. For example, in the commercial sector, data on energy use can be monitored in real time and warnings given to building operators when systems are operating out of defined ranges [72]. Campaigns can be undertaken using the best social marketing and engagement techniques to encourage efficient workplace behaviors [73]. In the residential sector, feedback on energy use in real-time, presented in ways that catch attention and motivate action, can spur reductions in energy consumption. Foster and Mazur-Stommen [74] reviewed several pilot programs in this area and found they achieved an average of 4 percent energy savings, although results are preliminary and there is likely substantial room for improvement.
Smart grid and smart behavior. The “smart grid” has received a lot of attention but thus far has not been widely used to help promote energy efficiency. There is a need to develop and test strategies for taking the information the smart grid makes available and providing this information to people and automatic controllers in ways that they can use to save energy. This will require learning by trial and error. For example, in the commercial sector, data on energy use can be monitored in real time and warnings given to building operators when systems are operating out of defined ranges [72]. Campaigns can be undertaken using the best social marketing and engagement techniques to encourage efficient workplace behaviors [73]. In the residential sector, feedback on energy use in real-time, presented in ways that catch attention and motivate action, can spur reductions in energy consumption. Foster and Mazur-Stommen [74] reviewed several pilot programs in this area and found they achieved an average of 4 percent energy savings, although results are preliminary and there is likely substantial room for improvement.
9 Moving Forward
The proceeding discussion shows how the best utility sector programs are reducing electricity use by 1.5 to 2 percent per year and that available savings opportunities could allow this level of savings to continue for many decades. A few states have even “bent the curve” and electricity use is now declining rather than increasing.5 A key question is whether this could happen for the entire United States. For the country as a whole, the answer is probably yes. EIA projects U.S. electricity use to grow only about 0.8 percent per year over the 2012–2035 period [29]. This projection includes only limited utility programs – utility program savings are implicitly assumed to continue at historic levels, and the EIA projections do not include expected increases in utility program spending and savings in response to mandatory energy savings targets (EERS) and other drivers. The latest estimates from Lawrence Berkeley National Laboratory based on a detailed review of state laws and regulations is that utility sector energy efficiency spending will likely double relative to 2010 spending (see Figure 2.20) and could triple or even quadruple relative to 2009 spending (see Figure 2.1). If historic programs, as represented by 2009 savings, are saving about 0.4 percent of sales each year [1], then ramping-up average savings to 1.2 percent per year, commensurate with tripling spending, would eliminate overall sales growth.
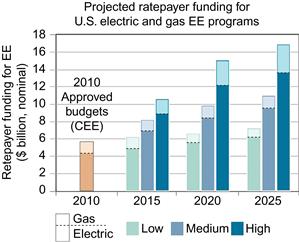
Figure 2.20 Note: “Low,” “Medium,” and “High” are scenarios for spending on programs. Source: [78].
This possibility is illustrated in Figure 2.21, which compares the EIA reference case forecast of electricity sales to a scenario in which energy efficiency savings are increased by 0.8 percent per year, with the increased savings phased in over four years. Under this scenario electricity use grows slightly in the early years and then levels off. We also include lines for 1.5 percent and 2 percent per year total efficiency savings (0.4 percent savings in base plus additional savings of 1.1 percent and 1.6 percent per year phased-in over six and eight years, respectively). The latter scenario results in a decline in total U.S. electricity use over the period of analysis.

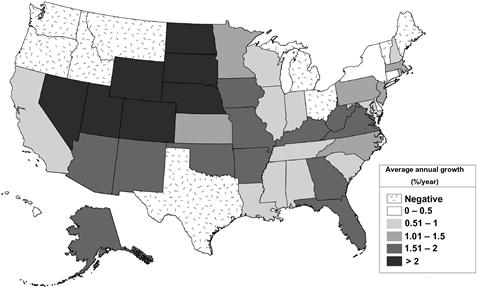
However, sales growth is uneven, with some regions growing and some not. In order to get a rough picture of sales growth, electric sales in 2000 and 2010 by state can be compared, calculating the average annual percentage change over this period. These calculations are shown in Figure 2.22. Electricity sales in nine states actually declined over this period, driven by such factors as the Great Recession, changes in industry mix, and energy efficiency programs. Electricity sales in an additional 22 states grew by 1.5 percent per year or less and thus if these growth rates continue, expanded energy efficiency programs could eliminate sales growth. But in seven states, primarily in the mountain west and upper Great Plains, sales grew by more than 2 percent per year. In these states this rough analysis indicates that energy efficiency could reduce but not eliminate sales growth. And 12 states are on the cusp, with annual growth rates of 1.5 to 2 percent. This analysis is very rough, as past changes in sales are not necessarily indicative of the future. Still, this analysis does illustrate what might be possible and what is not.
10 Conclusions
Utility sector energy efficiency programs have a multi-decade history in the United States but have increased substantially in recent years. Leading states are using energy efficiency programs to reduce sales by 1.5 to 2.5 percent per year, and long-term analyses of energy efficiency potential indicate that savings of 1.5 to 2 percent per year could continue out to 2050. In the post-2030 period, growth in electric vehicles could have a substantial impact on sales growth, but until then, energy efficiency programs could eliminate sales growth in a substantial majority of states and overall.
However, achieving these savings will not be easy. We will need improved and new program approaches in order to move beyond lighting and other “tried and true” measures. We will need strong policy support, such as mandatory energy savings targets and a “three-legged stool” to support the business case for utility investments in energy efficiency – cost-recovery, decoupling/lost revenue recovery, and shareholder incentives. Most importantly, we will need smart, creative people to make this all happen. Energy efficiency programs involve both art and science, and we will need to be creative and learn by doing to make such large savings happen.
The benefits of such large energy savings are likely to be substantial. Even if energy efficiency savings double in cost from recent experience, energy efficiency will still be the low-cost resource, saving consumers and businesses money, thereby freeing up resources to spur a strong economy and meet other societal objectives.
This chapter has focused on the United States. However, many of these lessons are likely to apply to other countries while recognizing each country’s unique characteristics. All countries for the most part have the same major uses of electricity and therefore similar efficiency opportunities. Where countries perhaps differ most is in their growth rates. For countries where electricity use is growing by about 2 percent per year or less, efficiency may be able to eliminate load growth. For countries growing more rapidly, efficiency opportunities may increase somewhat as they generally have a lot of new construction, and new construction presents particular opportunities to incorporate efficiency at modest cost. Still, for countries growing rapidly, efficiency investments are likely to reduce but not eliminate load growth.
References
1. Sciortino M, Neubauer M, Vaidyanathan S, et al. The 2011 state energy efficiency scorecard Washington, D.C.: American Council for an Energy-Efficient Economy; 2011; Report E115, <http://aceee.org/research-report/e115>.
2. [EIA] U.S. Energy Information Administration. Electric power annual Washington D.C.: U.S. Energy Information Administration; 2011; , <http://www.eia.gov/electricity/annual/>.
3. [EIA] U.S. Energy Information Administration. Annual energy review Washington D.C.: U.S. Energy Information Administration; 2011; , <http://205.254.135.24/totalenergy/data/annual/index.cfm>.
4. Collins N, Berry L, Braid R, et al. Past efforts and future directions for evaluating state energy conservation programs ORNL-6113 Oak Ridge, Tenn: Oak Ridge National Laboratory; 1985.
5. Geller H. Lessons from utility experimentation with appliance efficiency incentive programs. Proceedings of the 1988 ACEEE summer study on energy efficiency in buildings 1988;6.50–6.54.
6. Nadel S. Lessons learned: a review of utility experience with conservation and load management programs for commercial and industrial consumers Washington, D.C.: American Council for an Energy-Efficient Economy; 1990; Report U901, <http://aceee.org/research-report/u901>.
7. Nadel S, Reid MW, Wolcott DR. Regulatory incentives for demand-side management Washington, D.C.: American Council for an Energy-Efficient Economy; 1992; , <http://aceee.org/ebook/regulatory-incentives-for-demand-side-management>.
8. Kushler M, Witte P. Can we just “Rely on the Market” to provide energy efficiency?. An examination of the role of private market actors in an era of electric utility restructuring Washington, D.C.: American Council for an Energy-Efficient Economy; 2001; , Report U011.
9. Cain C, Lester JA. Retail rate comparisons and the electric restructuring debate bates. San Diego, Calif.: Bates White, LLC; 2008.
10. Bacon D. California’s disaster with electrical deregulation, <http://dbacon.igc.org/PJust/02ElecDereg.htm>; 2001.
11. Taylor J, Van Doren P. Lights out on restructuring? <http://www.cato.org/publications/commentary/lights-out-electric-restructuring>; 1998.
12. Nadel S, Amann J, Sachs H, Prindle B, Neal Elliott R. Market transformation: substantial progress from a decade of work Washington, D.C.: American Council for an Energy-Efficient Economy; 2003.
13. Efficiency Vermont. Year 2010 savings claim Burlington, Vt.: Vermont Energy Investment Corporation; 2011; , <http://www.efficiencyvermont.com>.
14. Nadel S, Langer T. Comments on “Is There an Energy Efficiency Gap?” Washington, DC: American Council for an Energy-Efficient Economy; 2012.
15. Kushler M, York D, Witte P. Five years in: an examination of the first half-decade of public benefits energy efficiency policies Washington D.C.: American Council for an Energy-Efficient Economy; 2004; Report U042, <http://aceee.org/research-report/u042>.
16. Leuthauser F“Rick”, Weaver E. Leveraging customer satisfaction through energy efficiency. Proceedings of the 2006 ACEEE summer study on energy efficiency in buildings Washington, D.C.: American Council for an Energy-Efficient Economy; 2006; , <http://www.aceee.org/proceedings-paper/ss06/panel05/paper20>.
17. Sciortino M. Energy efficiency resource standards: definitions and state progress. Presentation to IEA Washington, D.C.: American Council for an Energy-Efficient Economy; 2012.
18. Hayes S, Nadel S, Kushler M, York D. Carrots for utilities: providing financial returns for utility investments in energy efficiency Washington, D.C.: American Council for an Energy-Efficient Economy; 2011; Report U111.
19. York D, Kushler M. The old model isn’t working: creating the energy utility for the 21st century Washington, D.C.: American Council for an Energy-Efficient Economy; 2011; , <http://aceee.org/white-paper/the-old-model-isnt-working>.
20. Sciortino M, Nowak S, Witte P, York D, Kushler M. Energy efficiency resource standards: a progress report on state experience Washington, D.C.: American Council for an Energy-Efficient Economy; 2011; , <http://aceee.org/research-report/u112>.
21. Rosenfeld A, Poskanzer D. A graph is worth a thousand gigawatt- hours. Innovations J 2009; <http://www.energy.ca.gov/commissioners/rosenfeld_docs/INNOVATIONS_Fall_2009_Rosenfeld-Poskanzer.pdf>.
22. Eckman T. The value energy efficiency as a resource option: three decades of pnw experience. Presented at DOE, IEA and RAP workshop on policies for energy provider delivery of energy efficiency Portland, Ore: Northwest Power and Conservation Council; 2012.
23. Eckman T. In the PNW we do more than plan!. Presented at ACEEE energy efficiency as a resource conference Portland, Ore: Northwest Power and Conservation Council; 2011.
24. [EIA] U.S. Energy Information Administration. State energy data system Washington D.C.: U.S. Energy Information Administration; 2012; , <http://www.eia.gov/state/seds/#> [visited 21.04.12].
25. Horowitz P, Schlegel J, Sherman M. Programs and strategies to achieve all available cost-effective energy efficiency: early report on bending the curve in Massachusetts. Proceedings of the 2010 ACEEE summer study on energy efficiency in buildings Washington D.C.: American Council for an Energy-Efficient Economy; 2010; , <http://eec.ucdavis.edu/ACEEE/2010/data/papers/2082.pdf>.
26. [DEEP] Connecticut Department of Energy and Environmental Protection. Integrated resource plan−2012 Hartford, Conn: Connecticut Department of Energy and Environmental Protection; 2012; , <http://www.ct.gov/deep/cwp/view.asp?a=4120&q=486946>.
27. Eckman T. Spreadsheet titled “regional conservation summary 1978–2009 adjusted for BPA co-funding and including line losses” Portland, Ore: Northwest Power and Conservation Council; 2012.
28. Hayes S, Nadel S, Granda C, Hottel K. What have we learned from energy efficiency financing programs? Washington, D.C.: American Council for an Energy-Efficient Economy; 2011; Report U115, <http://www.aceee.org/research-report/u115>.
29. [EIA] U.S. Energy Information Administration. AEO Washington D.C.: U.S. Energy Information Administration; 2012.
30. [EIA] U.S. Energy Information Administration. Electric power monthly. March Washington D.C.: U.S. Energy Information Administration; 2012; , <http://www.eia.gov/electricity/monthly/>.
31. [CCST] California Council on Science and Technology. California’s energy future – the view to 2050, summary report Sacramento, Calf: California Council on Science and Technology; 2011; , <http://www.ccst.us/publications/2011/2011energy.pdf>.
32. Long J. Chair’s lecture: California energy futures study results, <http://www.arb.ca.gov/research/lectures/speakers/long.pdf>; 2011 [15.07.11].
33. Lovins A, Rocky Mountain Institute. Reinventing fire: bold business solutions for the new energy era White River Junction, Conn: Chelsea Green; 2011.
34. Laitner JA“Skip”, Nadel S, Neal Elliott R, Sachs H, Siddiq Khan A. The long-term energy efficiency potential: what the evidence suggests Washington, D.C.: American Council for an Energy-Efficient Economy; 2012; , Report E121, <http://aceee.org/research-report/e121>.
35. [IEE] Institute for Electric Efficiency. Assessment of Electricity Savings in the U.S Achievable through new appliance/equipment efficiency standards and building efficiency codes (2010–2025) Washington D.C.: Institute for Electric Efficiency; 2011; , <http://www.edisonfoundation.net/iee/Documents/IEE_CodesandStandardsAssessment_2010-2025_UPDATE.pdf>.
36. Lowenberger A, Mauer J, deLaski A, DiMascio M, Amann J, Nadel S. The efficiency boom: cashing in on the savings from appliance standards Washington, D.C.: American Council for an Energy-Efficient Economy; 2012; .Report A123, <http://aceee.org/research-report/a123>.
37. [IEE] Institute for Electric Efficiency. Integrating codes and standards into electric utility energy efficiency portfolios Washington D.C.: Institute for Electric Efficiency; 2011; , <http://www.edisonfoundation.net/iee/Documents/IEE_IntegratingCSintoEEPortfolios_final.pdf>.
38. Efficiency Vermont. Efficiency vermont annual plan 2012 Burlington, Vt.: Vermont Energy Investment Corporation; 2012; , <http://www.efficiencyvermont.com/docs/about_efficiency_vermont/annual_plans/EVT_AnnualPlan2012.pdf>.
39. [CEE] Consortium of Energy Efficiency. Consortium for energy efficiency 2012 behavior program summary Boston, Mass: Consortium for Energy Efficiency; 2012.
40. Navigant Consulting, Inc. Energy savings potential of solid-state lighting in general illumination applications Washington, D.C.: Navigant Consulting, Inc; 2012; , <http://apps1.eere.energy.gov/buildings/publications/pdfs/ssl/ssl_energy-savings-report_jan-2012.pdf>.
41. Shapiro C, Puttagunta S, Owens D. Measure guideline: heat pump water heaters in new and existing homes Washington, D.C.: U.S. Department of Energy; 2012; , <http://www.nrel.gov/docs/fy12osti/53184.pdf>.
42. [DOE] U.S. Department of Energy. Building technologies program Washington D.C.: U.S. Department of Energy; 2011; , <http://apps1.eere.energy.gov/buildings/publications/pdfs/alliances/techspec_rtus.pdf>.
43. Takahashi K, Nichols D. The sustainability and costs of increasing efficiency impacts: evidence from experience to date. Proceedings of the 2008 ACEEE summer study on energy efficiency in buildings Washington, D.C.: American Council for an Energy-Efficient Economy; 2008; , <http://www.aceee.org/proceedings-paper/ss08/panel08/paper30>.
44. [RTF] Regional Technical Forum. Guidelines for the development and maintenance of rtf savings estimation methods Portland, Ore.: Northwest Power and Conservation Council; 2011; , <http://www.nwcouncil.org/energy/rtf/subcommittees/deemed/Guidelines%20for%20RTF%20Savings%20Estimation%20Methods%20%28Release%206-1-11%29.pdf>.
45. [NEEP] Northeast Energy Efficiency Partnerships. Northeast energy efficiency partnerships, EM&V forum Portland, Ore.: Northwest Energy Efficiency Alliance; 2012; , <http://neep.org/emv-forum>.
46. Schiller S, Goldman C, Galawash E. National energy efficiency evaluation, measurement and verification (em&v) standard: scoping study of issues and implementation requirements Berkeley, Calf.: Lawrence Berkeley National Laboratory; 2011; , <http://eetd.lbl.gov/ea/EMP/reports/lbnl-4265e.pdf>.
47. [NERC] North American Electric Reliability Corporation. Reliability assessment 2000–2009: the reliability of bulk electric systems in North America Atlanta, Ga.: North American Electric Reliability Corp; 2000.
48. [NERC] North American Electric Reliability Corporation. 2011 long-term electric reliability assessment Atlanta, Ga.: North American Electric Reliability Corp; 2011; , <http://www.nerc.com/files/2011%20LTRA_Final.pdf>.
49. [FERC] Federal Energy Regulatory Commission. A national assessment of demand response potential Washington, D.C.: U.S. Department of Energy; 2009.
50. Eto J, Goldman C, Nadel S. Ratepayer-funded energy efficiency programs in a restructured electricity industry: issues and options for regulators and legislators Berkeley, CA: Lawrence Berkeley National Laboratory; 1998; Report Number LBNL-41479.
51. Harrington C. Who should deliver ratepayer funded energy efficiency programs? Montpelier, VT: Regulatory Assistance Project; 2003.
52. Kim EL, Tabors RD, Stoddard RB, Allmendinger TE. Carbitrage: utility integration of electric vehicles and the smart grid. The Electricity J. 2012;25(2):16–23.
53. Power JD, Associates. Future global market demand for hybrid and battery electric vehicles may be over-hyped Westlake Village, Calf: J.D. Power and Associates; 2010; , <http://businesscenter.jdpower.com/news/pressrelease.aspx?ID=2010213>.
54. [NAS] National Academy of Science. Transition to alternative transportation technologies – plug-in hybrid electric vehicles Washington, D.C.: The National Academies; 2009.
55. [DOE] U.S. Department of Energy. 2012 IECC final action hearing delivers DOE’s 30 percent energy savings goals. Building energy codes program Washington D.C.: U.S. Department of Energy; 2011; , <http://www.energycodes.gov/status/2012_Final.stm>.
56. Nadel S. The federal energy policy act of 2005 and its implications for energy efficiency program efforts Washington, D.C.: American Council for an Energy-Efficient Economy; 2005; Report E053.
57. [ASHRAE] American Society of Heating, Refrigerating and Air Conditioning Engineers. SSPC 90.1 2013 work plan Atlanta, Ga: American Society of Heating, Refrigerating and Air Conditioning Engineers; 2011.
58. Higgins C, Castillo G, Egnor T. Getting to 50: drivers and data of measured energy performance. Proceedings of the 2010 ACEEE summer study on energy efficiency in buildings Washington D.C.: American Council for an Energy-Efficient Economy; 2010; , <http://eec.ucdavis.edu/ACEEE/2010/data/papers/2008.pdf>.
59. [NBI] New Buildings Institute and Preservation Green Lab. Getting to zero 2012 status update Vancouver, Wash: New Buildings Institute; 2012; , <http://www.newbuildings.org/getting-zero-2012-status-update-first-look-costs-and-features-zero-energy-commercial-buildings>.
60. Jones T, Crossman K, Eskil J, Wallner J. The evolution of continuous energy improvement programs in the northwest: an example of regional collaboration Consortium for energy efficiency. Proceedings of the 2011 ACEEE summer study on energy efficiency in buildings Washington D.C.: American Council for an Energy-Efficient Economy; 2011.
61. Chittum A, Kaufman N. Challenges facing combined heat and power today: a state-by-state assessment Washington D.C.: American Council for an Energy-Efficient Economy; 2011; Report IE11, <http://aceee.org/research-report/ie111>.
62. MIT. MIT efficiency forward exceeds electricity reduction goal Cambridge, Mass: Massachusetts Institute of Technology; 2011; (press release), <http://web.mit.edu/press/2011/nstar-mit.html>.
63. Edwards Bruce. Companies commit to major energy savings. Rutland Herald. 2011;Decemeber:25 <http://www.efficiencyvermont.com/docs/about_efficiency_vermont/news_articles/RutlandHerald_122511.pdf>.
64. [NEEA] Northwest Energy Efficiency Alliance. Undated1. NEEA Success story: commercial. Portland, Ore.: Northwest Energy Efficiency Alliance, <http://neea.org/successstories/docs/neea_success_story_commercial.pdf>.
65. [NEEA] Northwest Energy Efficiency Alliance. Undated2. NEEA Success story: industrial. Portland, Ore.: Northwest Energy Efficiency Alliance, <http://neea.org/successstories/docs/neea_success_story_industrial.pdf>.
66. Navarro M. Empire state building plans environmental retrofit. New York Times, <http://www.nytimes.com/2009/04/07/science/earth/07empire.html>; 2009.
67. [NBI] New Buildings Institute and Preservation Green Lab. Deep retrofits Vancouver, Wash: New Buildings Institute; 2011; , <http://www.newbuildings.org/sites/default/files/11DeepSavingsEBCaseStudiesNBI.pdf>.
68. Wigington L. Introduction to the thousand home challenge, <http://thousandhomechallenge.com/sites/thousandhomechallenge.com/files/user-files/Thousand-Home-Challenge-Intro_Webinar_10-16-2011.pdf>; 2011.
69. Neuhauser K. Deep energy retrofit incentive programs: the national grid pilot. Presented at the residential building energy efficiency meeting Somerville, Mass.: Building Science Consulting; 2010; , <http://apps1.eere.energy.gov/buildings/publications/pdfs/building_america/ns/a24_deep_energy.pdf>.
70. Elliott RN, Molina M, Trombley D. A defining framework for intelligent efficiency Washington D.C.: American Council for an Energy-Efficient Economy; 2012; Report E125.
71. Mercier C, Moorefield L. Commercial office plug load savings and assessment: executive summary Vancouver, Wash: New Buildings Institute; 2011; , <http://www.newbuildings.org/sites/default/files/OfficePlugLoadAssessment_ExecutiveSummary.pdf>.
72. Forsman K, Silver-Pell T. Energy information systems: a utility perspective. Presentation at the 2010 Market transformation symposium, <http://www.aceee.org/files/pdf/conferences/mt/2010/C2_Theda_Silver_Pell.pdf>; 2010.
73. Shui Bin. Greening work styles: an analysis of energy behavior programs in the workplace Washington, D.C.: American Council for an Energy-Efficient Economy; 2012; Report B121, <http://aceee.org/research-report/b121>.
74. Foster B, Mazur-Stomman S. Results from recent real-time feedback studies Washington D.C.: American Council for an Energy-Efficient Economy; 2012; Report B122, <http://www.aceee.org/research-report/b122>.
75. Economy.com. 2012. Data buffet: gross state product, historical, by state. Downloaded May 2012.
76. Crossman K, Brown D. Energy trust of oregon kaizen blitz pilot program. Proceedings of the 2009 ACEEE summer study on energy efficiency in industry Washington D.C.: American Council for an Energy-Efficient Economy; 2009; , <http://www.aceee.org/proceedings-paper/ss09/panel03/paper07>.
77. Friedrich K, Eldridge M, York D, Witte P, Kushler M. Saving energy cost-effectively: a national review of the cost of energy saved through utility-sector energy efficiency programs Washington D.C.: American Council for an Energy-Efficient Economy; 2009; Report U092, <http://www.aceee.org/research-report/u092>.
78. Goldman CA, Barbose G, Hoffman IM, Bilingsley M. A rising tide for utility customer-funded energy efficiency. Proceedings of the 2012 ACEEE summer study on energy efficiency in buildings Washington D.C.: American Council for an Energy-Efficient Economy; 2012; Lawrence Berkeley National Lab. 2012.
79. Hayes S, Young R. Energy Efficiency: The Slip Switch to a New Track Toward Compliance with Federal Air Regulations. Washington, D.C.: American Council for an Energy-Efficient Economy; 2012, <https://www.aceee.org/research-report/e122>.
80. Kushler M, Nowak S, Witte P. A National Survey of State Policies and Practices for the Evaluation of Ratepayer-Funded Energy Efficiency Programs. Washington, D C. American Council for an Energy-Efficient Economy; 2012, <https://www.aceee.org/research-report/u122>.
81. Lazard, Ltd. Levelized cost of energy analysis – version 5.0. Energy 2011; (no. June):0–15.
1In this book Allcott and Greenstone argue that utility demand-side management programs have higher costs, but they are looking at this just from the consumer perspective and not the utility perspective. For example, they include both consumer and utility costs for demand-side management and use discount rates above the utility cost of capital. For a fuller discussion of these issues, including a critique of some other points raised by Allcott and Greenstone, see Nadel and Langer [14].
2For example, in 2004 ACEEE found that energy efficiency programs cost utilities an average of about 3 cents per kWh [15]. A similar study in 2009 found an average of 2.5 cents per kWh [77].
3http://quickfacts.census.gov/qfd/states/06000.html
4For example, J.D. Power and Associates [53] estimated U.S. sales of about 100,000 battery electric vehicles in 2020 plus sales of about 1.7 million hybrid electric vehicles of which only some would be plug-ins.
5It should be noted that declines in electric sales were not a result of declining Gross State Prudct (GSP). GSP grew over the 2000–2010 period in all states, generally by 35 percent or more. The only states growing by less were Michigan (14 percent growth) and Ohio (25 percent growth) [75].