Shifting Demand
From the Economic Imperative of Energy Efficiency to Business Models that Engage and Empower Consumers
John A. “Skip” Laitner1, Matthew T. McDonnell1 and Heidi M. Keller2, 1Economic and Human Dimensions Research Associates, 2Johns Hopkins University
1 Introduction
In 1950, the United States was an emerging economic powerhouse with a population of 152 million people – just one-half of the people who reside here today. The size of the economy, as measured by its Gross Domestic Product (GDP), was just 15 percent the size of today’s number one market in the world; and, in 1950, the U.S. used about 35 quadrillion Btus of purchased energy, including electricity, coal, natural gas, oil, and wood. If the many different forms of energy were converted to a corresponding amount of petroleum, the energy needed to power the American economy in 1950 was the equivalent of about 16.4 million barrels of oil per day. That is about one-third of today’s current energy use, now just over 46 million barrels of oil per day equivalent. Perhaps most surprising is that in 1950 the United States wasted about 92 percent of those various energy resources in maintaining its economy. In other words, only eight percent of all the energy used within our economy was necessary to transform matter into goods and services [1].
The good news is that the United States has improved its overall rate of converting energy into useful work by an average 0.9 percent per year from 1950 through 2010 – even as the larger productivity of the economy grew by about two percent annually over that same time horizon. The extraordinary versatility of electricity has driven a large part of that productivity improvement. Despite the many annual efficiency improvements since 1950, surprisingly, the overall energy efficiency of the U.S. economy remains only 14 percent.1 In short, the United States continues to waste about 86 percent of the energy that is consumed in the production of goods and services.
Admittedly, not all of that energy can be recovered and put to more productive uses in a cost-effective manner. Yet, a large number of studies suggest that more can be done through better choices, smarter investments, and the development of new business models to enable those choices. Recent assessments by the American Council for an Energy-Efficient Economy (see, [2]), and the University of Toronto’s L. Danny Harvey [3], among others, suggest that the technology and wherewithal exists to greatly improve the current level of energy efficiency.
On the basis of pure economics, the United States, and others, might quadruple the current level of efficiency by the year 2050 – should we choose to actively develop those prospects [2,20]. The more complete set of energy efficiency opportunities are likely to be enabled by what author Jeremy Rifkin calls a transition to Third Industrial Revolution [4]. On the other hand, if the world continues along the business-as-usual path, evidence suggests the robustness of the global economy may be substantially weakened. At the same time, however, the market is evolving and unfolding in whole new ways that may either constrain or enable future opportunities for energy productivity improvements – depending on the social and institutional arrangements enabled, and the energy or economic policies enacted.
This chapter advances three critical points:
![]() The first is that advances in energy efficiency rather than in energy supply have been a primary driver of economic productivity, especially since the spread of the industrial revolution, beginning in the mid-18th century. The availability of high-quality yet affordable electricity has been a significant contributor to past productivity improvements.
The first is that advances in energy efficiency rather than in energy supply have been a primary driver of economic productivity, especially since the spread of the industrial revolution, beginning in the mid-18th century. The availability of high-quality yet affordable electricity has been a significant contributor to past productivity improvements.
![]() Second, in order to maintain a robust economy over the next several decades, a simultaneous decrease in the cost of energy services is required as well as a paradoxical increase in “useful energy” consumption. The key to resolving this paradox is reducing the waste associated with the larger demand for raw energy.
Second, in order to maintain a robust economy over the next several decades, a simultaneous decrease in the cost of energy services is required as well as a paradoxical increase in “useful energy” consumption. The key to resolving this paradox is reducing the waste associated with the larger demand for raw energy.
![]() Finally, and looking specifically within the electricity market, the development of new business models are essential to improve system efficiencies in ways that maintain the robustness of the future economy.
Finally, and looking specifically within the electricity market, the development of new business models are essential to improve system efficiencies in ways that maintain the robustness of the future economy.
Section 2 of this chapter examines the broader aspects of converting primary energy into useful work (energy services) as well as the critical need for greater energy efficiency gains in order to maintain a robust economy. Section 3 builds on this discussion and evaluates energy efficiency as a resource and how large a role it could play in an American or global energy portfolio. Section 4 looks at the need for new electric utility business models in order to actualize large energy efficiency gains and to close the “energy efficiency gap.” Using several case studies, Section 5 examines the shift in the electric utility industry from a linear, commodity-based approach (delivery of kilowatt-hours, or kWh) to that of a dynamic energy service provider. Finally, Section 6 offers concluding thoughts, namely, that in order to accommodate the greater imperative for building a more energy-efficient economy, and to leverage the full energy efficiency resource opportunity that enables a more robust economy, the global economy requires development of entirely new business models that engage and empower consumers to ensure such a transition.
2 Energy Efficiency and Economic Productivity
In the United States, economists and policy analysts have formulated many of their insights based on data collected by the Energy Information Administration (EIA). As it turns out, energy data collected by the EIA contains only part of the story on how energy moves the economy forward. The EIA routinely gathers annual data based largely on the sale of physical units of energy as tons of coal, cords of wood, gallons of gasoline, therms of natural gas, or kWh of electricity. All of these different energy forms have an equivalent heat value that allows one to compare a gallon of gasoline with, say, one kWh of electricity. The majority of other countries in the world convert these energy forms using a standard energy unit called the joule. In the United States, heat equivalent is the British thermal unit (Btu). One Btu is roughly the amount of heat given off by the burning of a wooden kitchen match.2 According to the EIA, there are about 124,238 Btus of heat equivalent in a gallon of gasoline – or the heat energy that might be provided by the burning of 124,238 wooden kitchen matches. Similarly, there are approximately 3,412 Btus of energy for every kWh of electricity delivered to the home or office building. When comparing electricity and gasoline, one might say that a gallon of gasoline is the heat equivalent of 36.4 kWh delivered to the end-user.
When including the energy wasted in the generation, transmission, and distribution of electricity (see also chapter by Gellings on this topic), the production of electricity required roughly 10,697 Btus per kWh in 2010 [5].3 In other words, the 3,412 Btus bundled in a single kWh available for use in the home is only 31.9 percent of the total energy needed to create and distribute that electricity. Similarly, one gallon of gasoline is the heat equivalent of 11.6 kWh when compared to the energy that is necessary at the generation source.4
While energy is typically quantified by a heat metric, a more useful metric quantifies the ability of energy to do work. In the more simple explanation, work might be defined as lifting a weight against the force of gravity or overcoming sliding friction. From an economic perspective, work is defined as the energy actually used to transform matter into goods and services. For all practical purposes useful work can be divided into three primary categories: (1) “muscle work,” (2) mechanical and electrical power, and (3) a combination of low or high temperature heat, delivered to the point of actual use ([1], as updated by Laitner, 2012).
“Muscle work” is work carried out by people and animals. In 1900, for example, there was an estimated 43 million horses, mules, oxen, and other (non-milk) cattle on American farms [6]. A large number of these were draft animals providing work while another share of animals provided transportation. This did not include urban and work animals, which also provided substantial labor and transportation services. All of this “muscle work,” however, helped create economic value.
While very few animals provide work or transportation services today, there has been a substantial increase in the second and third categories of work. Mechanical and electric power is work done by a variety of steam and gas turbines, gasoline and diesel engines, as well as electric generators. The final work category is a combination of low or high temperature heat delivered to the point of actual use ([1], as updated by Laitner, 2012).
The EIA now tracks data for many different amounts of purchased energy [5,7,8], and preliminary estimates for 2010 suggest the United States consumed about 98 quadrillion Btus, or quads, of total energy in that year. One quad is roughly 8 billion gallons of gasoline, which, at current levels of energy efficiency, is sufficient fuel to run some 15.4 million cars for one full year of typical driving. It is also enough energy to provide the full energy needs for about 5.2 million households in a given year. It is sufficient energy to power $135.4 billion of annual economic activity within the United States. This, however, is only part of the story.
Ayres and Warr [1] have documented a more detailed accounting of the total energy that is actually used for heat, mechanical power, electricity, light, and muscle power. Whereas EIA and other data, for example, suggest that economic activity in the United States required a total of 98 quads (rounded) in 2010, the Ayres-Warr data (as updated and summarized in Laitner, 2012) – with their more complete accounting of actual formal and informal energy needed to power the full economy – indicate we required more like 124 quads (rounded) of total energy in that year. More critically, only 17 quads of that total energy consumption were actually used and useful in producing the total basket of consumer goods and services purchased in 2010.
As Figure 17.1 highlights below, it is not the total raw energy (i.e., the 124 quads just referenced) that is especially useful to our economy. Rather, it is the energy that is converted to useful work – as shown in Figure 17.1, the roughly 4 quads of useful work in 1950 and the 17 quads in 2010 previously referenced. In effect, it is the useful work or energy that actually enables economic activity as typically measured by the nation’s GDP (again, with relevant data reported in Laitner, 2012). Ayres and Warr further clarify the point by noting that the reason the raw energy “inputs do not explain economic growth is that their inefficient conversion leads to a large fraction of waste heat (and other wastes, like ash) that do not contribute to the economy but actually create health problems and costs of its disposal.”
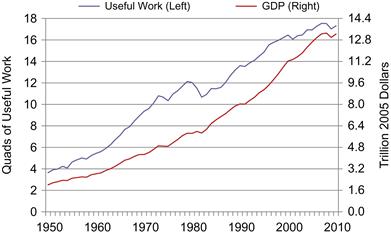
Figure 17.1 Useful Work (Energy) versus U.S. Gross Domestic Product (GDP). Source: Author calculations based on EIA data (2012) and Ayres and Warr (2009) – as updated by Laitner (2012), from 2005 to 2010.
As a complement to the first chart, Figure 17.2 draws on the raw data published by Laitner (2012) to highlight the role of useful energy over the period 1950 through 2010. The data is shown in an index format in which the amount of useful work per person and the amount of useful work per labor hour in 1950 are shown as a value of 100. The quick observation shows a highly similar pattern for both sets of lines shown in Figure 17.2, namely, the rather steep increase in useful energy per labor hour and per capita in the 1950 to 1980 time period. By about 1980, however, the amount of useful energy flattens out for both a per capita and per work hour basis. The immediate suspicion is that the flattening consumption of useful energy per capita must be affecting other aspects of the economy as well. In short, the flattening of useful work may be constraining the larger set of economic activities. This is, indeed, reinforced by both Figure 17.3 and in Table 17.1.
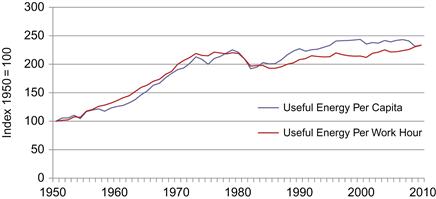
Figure 17.2 Useful Work Energy per Person and Work Hour (Index 1950=100). Source: Author calculations based on EIA data (2012) and Ayres and Warr (2009) – as updated by Laitner (2012), from 2005 to 2010.
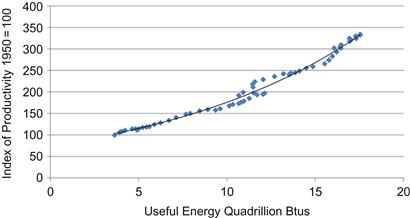
Figure 17.3 Useful Energy per Person (Index 1950=100). Source: Author calculations based on EIA data (2012) and Ayres and Warr (2009) – as updated by Laitner (2012), from 2005 to 2010.
Table 17.1
Key Historical Growth Rates in Energy and Economic Productivity
Note: Laitner (2012) with data from 1900 taken from both Ayres and Warr [1] and updated using EIA (2012).
Continuing, Figure 17.3 highlights the very tight and significant impact of useful energy as it drives overall U.S. economic productivity. That is, in order to amplify the ability of the U.S. population to increase its output, either on a per capita or an hourly basis, more actual work must be done. Again, looking first at 1950, we see that about 4 quads of work was necessary to generate the actual productivity recorded in 1950. The higher the productivity, the more useful work or useful energy is required.
Examining the upper-right part of Figure 17.3 we note the highest value of productivity reaches an index of 325 by 2010. Figure 17.3 also shows the largest amount of useful work, the same 17 quads of useful work described earlier. Again, this makes sense when we think of economic productivity as increasing the output per person, or output per hour of labor, by tapping into greater levels of cost-effective energy services. It actually does take energy to move the economy forward as economic activity more broadly increases over time. In effect, by increasing the efficiency with which we convert available energy into useful work, overall costs will decrease such that we can more easily afford to integrate even more useful energy as we continue to build economic momentum.
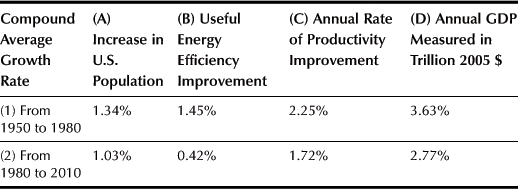
Table 17.1 further highlights the connection between useful energy and productivity, but in a slightly different way. In this case we provide data that compares the growth rates for population (column A); improvements in the rate of converting total energy into useful energy (column B); the growth in economy wide productivity (column C); and finally, the overall growth in the nation’s GDP (column D).5 In this case, however, we are looking at two periods from 1950 to 1980 (data row 1) and from 1980 through preliminary estimates for 2010 (data row 2).
Of immediate interest is the link between the improvement in the conversion of energy into useful energy (work) reported in column B as it relates to economic productivity in column C, and finally, to the growth in the nation’s economy (column D). The bad news is that the earlier period from 1950 to 1980 showed the larger improvement in columns B, C, and D. In the last 30-year period, covering the years 1980 to 2010, however, the entire economic process shows a weakening – especially as the economy-wide improvement in productivity fell from 2.25 percent to 1.72 percent. The reason for this weakening appears to be the result of a flattening rate of improvement in converting total “raw energy” into actual “useful energy” (or useful work) so that we can cost-effectively and simultaneously increase the magnitude of useful energy (or work expressed as quads of energy). Such an improvement, in turn, could drive up the nation’s larger economic productivity and total GDP.6 Presumably, then, as the rate of efficiency conversion increases, the quantity of total or raw energy required to power the economy will decline – even as the amount of useful energy continues to grow.
In effect, the data in Figures 17.1 through 17.3, as well as in Table 17.1, all reveal two important aspects of economic activity.
First, when we properly measure the links between useful energy and economic output, we find that America’s overall level of energy efficiency has been stagnating at a rather anemic 13 to 14 percent for the past 20 years or so (notably over the period 1990 through 2005 with a preliminary update by Laitner, 2012). As suggested in the second data row of Table 17.1, the stagnating conversion of total energy into useful work appears to constrain economic productivity.
Second, and not immediately obvious, if we merely double our current level of efficiency (following a business-as-usual rate of improvement), we may continue to see a weaker economy over the next several decades. Indeed, the evidence points toward a need to at least triple or quadruple the productive conversion of raw energy so that a greater magnitude of cost-effective “useful energy” is available to power a more robust economy. Improvements in the efficiency with which we both produce and use electricity will be vital in accelerating economic performance.
3 How Big is the Energy Efficiency Resource?
Economist William Baumol and his colleagues (2009) once wrote, “for real economic miracles one must look to productivity growth.” As suggested by this chapter, and by the large number of studies published by the American Council for an Energy-Efficient Economy (see, e.g., [9,10]; Gold et al. 2010; [11]), and by many other recent studies ([12], America’s Energy Future 2010, and the American Physics Society [13]), by priming "the productivity pump" with enhanced or expanded energy efficiency provisions, a net positive impact for the economy will likely result. More critically, a failure to accelerate the rate of efficiency gains compared to the last 30 years or so, risks a significantly less robust economy in the years ahead.
Some might ask the question, “Just how big is energy efficiency?” Perhaps the surprising news is that the opportunity for gains in energy efficiency (energy productivity) is bigger than one might imagine, although perhaps harder to achieve than one might initially believe – and, as this chapter will suggest, new business models will be needed to achieve those larger efficiency improvements. Among the more credible estimates, is a study published by the National Renewable Energy Laboratory [14], which suggested that if all commercial buildings were rebuilt by applying a comprehensive package of energy efficiency technologies and practices, they could reduce their typical energy use by 60 percent. Adding the widespread installation of rooftop photovoltaic power systems could lead to an average 88 percent reduction in the use of conventional energy resources. Even more intriguing, many buildings could actually be producing more energy than they consume – in effect, transforming building stock into power plants (also see chapter by Anderson et al for additional insights on this topic).
Using the United States as an illustrative example, the current electricity generation and transmission system now operates at about 32 percent efficiency. That is a level of performance essentially unchanged since 1960. The United States wastes more in the production of electricity today than Japan uses to power its entire economy [2]. At the same time, a study published by the Lawrence Berkeley National Laboratory [15] suggests that a variety of waste-to-energy and recycled energy systems could pull enough waste heat from our nation’s industrial facilities and buildings to meet 20 percent of current U.S. electricity consumption. And that is only the beginning of potentially large efficiency gains in power generation.
In Figure 17.4, focusing on electricity production and consumption, Laitner et al. (2012) suggest that a combination of both device and systems efficiency improvements among all end-use applications of the economy (including the full array of residential, commercial, and industrial sector electricity needs) could deliver productivity gains that lower electricity consumption by 30 percent in what they term an Advanced (efficiency) Scenario, and 37 percent in what they call the “Phoenix” Scenario. Both scenarios compare the year 2050 impacts with what might otherwise be forecasted for the 2050 Reference Case projection (the left-most dark gray bars in each set of data in Figure 17.4). More importantly, reducing generation, transmission, and distribution losses in the production of electricity – together with lowering the consumer demand for electricity – removes a significant level of waste (shown in the middle light gray bars in Figure 17.4). These two items together suggest that total primary energy (highlighted in the medium gray bars bars) dedicated to the production of electricity might be cost-effectively reduced by as much as one-half by 2050!

Again, why the need for greater efficiencies? It bears repeating. The larger gains in energy efficiency are made necessary as a critical step toward reducing the cost of energy services, thus enabling the productive use of all resources. So without greater efficiency, and the concomitant reduction in the cost of energy services (on both the end-use and the supply side), the economy may actually become much less robust. Indeed, it may also become a little smaller. Should the economy contract by even tenths of one percent, we will have fewer economic resources available to handle things like climate change, or improvements in our nation’s infrastructure.
4 The Shifting Utility Market
The potential gains in energy efficiency remain large. Yet, achieving those large-scale improvements is a vital step in maintaining the robustness of our economy. At the same time, there are emerging trends in consumer behavior, regulatory policies, and new technologies that are laying the groundwork for a fresh and diversified energy market place. Perhaps, more crucially, the old market structure and technologies are creating new pressures that mandate changes in the way we generate and deliver energy services – even as the marketplace demands new business models that can deliver those badly-needed productivity improvements. This section explores both of these aspects.
4.1 Utility Pressures
Utilities are experiencing tremendous pressures to redesign the way in which customers are served and business is conducted. The electric utility’s commodity-based business model is outdated and has been progressively so for the last several decades. The original model of the mid-twentieth century was based upon an ambitious “grow and build” strategy that an increasing number of analysts suggest is no longer sustainable (see also the chapter by Cavanagh in this volume).
The electric utility industry experienced broad improvements in thermal efficiency throughout the first half of the twentieth century, creating consistent declines in costs of production [16,17]. Utilities therefore encouraged energy usage and promoted the “all electric home” [18]. The increased demand for electricity continued to push large scales of production and widespread development, benefiting the consumer with low costs. According to Valocchi et al. [17], by 1967 the cost of electricity was 95 percent cheaper than in 1900. The electricity utility business model appeared to be intact. Utilities were making money and customers were paying low rates for electricity.
However, shortly thereafter in the early 1970s, the industry witnessed a plateau in the economies of scale [16,17]. Growth in the industry began to diminish and generating units reached their limit. Since the 1960s, the United States’ current level of electric efficiency, or inefficiency, has remained essentially static. Despite the evolving landscape of the past 30 to 40 years, most utilities have continued to follow the same business model of “grow and build” that is no longer relevant or sustainable (again see chapter by Cavanagh).
Today, however, is different. There is now a “perfect storm” of diversified events on the horizon that the electric utility sector cannot afford to ignore [20]. If the electric sector continues on with business as usual the challenges will eventually become insurmountable and could threaten a country’s security, economic vitality, and environmental quality. Lovins et al. (2011) assert that this impending cataclysm in the energy sector will be formed by:
![]() An Aging Electric Infrastructure: 70 percent of the electric transmission lines and transformers are at least 25 years old, while 60 percent of circuit breakers are at a minimum of 30 years old [19].
An Aging Electric Infrastructure: 70 percent of the electric transmission lines and transformers are at least 25 years old, while 60 percent of circuit breakers are at a minimum of 30 years old [19].
![]() The Electric Power Research Institute (EPRI) estimates that nearly 60 percent of the present infrastructure must be upgraded in order to ensure long-term viability and reliability [19]. Such essential upgrades could force the demand for new costly facilities.
The Electric Power Research Institute (EPRI) estimates that nearly 60 percent of the present infrastructure must be upgraded in order to ensure long-term viability and reliability [19]. Such essential upgrades could force the demand for new costly facilities.
![]() Environmental Constraints: Electric utilities are accountable for virtually 40 percent of today’s greenhouse gas emissions [18].
Environmental Constraints: Electric utilities are accountable for virtually 40 percent of today’s greenhouse gas emissions [18].
![]() If nothing is done to change the current “Business As Usual” path, emissions are expected to intensify by 38 percent over the next 40 years [20].
If nothing is done to change the current “Business As Usual” path, emissions are expected to intensify by 38 percent over the next 40 years [20].
![]() Technology Shifts: In 2011, 118 countries had implemented policies requiring the use of renewable energy. This was an increase from 55 countries in 2005 [20].
Technology Shifts: In 2011, 118 countries had implemented policies requiring the use of renewable energy. This was an increase from 55 countries in 2005 [20].
![]() With an emerging market for renewable energy, new customers and companies will enter the marketplace providing both an opportunity and a threat to utilities [20].
With an emerging market for renewable energy, new customers and companies will enter the marketplace providing both an opportunity and a threat to utilities [20].
![]() Security Concerns: Blackouts cost the United States $80 billion each year [19].
Security Concerns: Blackouts cost the United States $80 billion each year [19].
![]() Businesses can lose billions of dollars if the power is out for only a few minutes. The electric grid remains not only vulnerable to electric blackouts, but also to terrorist and cyber-attacks [20].
Businesses can lose billions of dollars if the power is out for only a few minutes. The electric grid remains not only vulnerable to electric blackouts, but also to terrorist and cyber-attacks [20].
The convergence of these highly uncertain and costly factors has forced the need for an altered way of doing business. Energy efficiency and conservation are two of the greatest tools we have at our disposal today to address the looming energy crisis and reduce our impact on the environment [21]. Yet the market is fundamentally different than just a few years ago, and we will need new business models to tap into the full resource opportunities and develop the range of energy efficiency resources throughout all regions and all sectors of the U.S. economy.
Electric utility companies are recognizing this shift and changing the way in which they conduct business. Duke Energy, headquartered in Charlotte, North Carolina, is a regulated utility providing electricity in five U.S. states. The company is changing their focus from traditional fuel source generation to renewables and energy efficiency, with plans to retire approximately 3,300 MW at eight separate coal generation sites over the next three years (Duke Energy Corporation, 2011). Following the disaster of the Fukushima nuclear plant in March 2011, Japan is considering a nuclear-free energy portfolio, leaving room for the development of renewables and a larger emphasis on energy efficiency and conservation. Becoming free of traditional energy sources, such as nuclear and coal, is possible with a revised business model. Germany is at the forefront of developing a strong sustainable renewable energy sector that is absent of nuclear and coal. The country has been studying a variety of scenarios for the past twenty years that would afford them with a 100 percent renewable electricity system. The country is poised to reduce greenhouse gas emission by 40 percent and increase their share of renewables to 35 percent by 2020 (Morgan, 2011). Their ultimate goal is to achieve 80 percent renewable energy generation and 80 percent reductions in greenhouse gas emissions by 2050 (Morgan 2011).
4.2 Understanding and Closing the Energy Efficiency Gap
With energy efficiency providing such a convincing case for delivering a low-cost energy service, why hasn’t it already saturated our economy? [12]. This question has baffled the energy community of researchers, economists, policymakers, and social scientists for the past 30 years [22]. Despite developments in cost-effective energy efficient alternatives, consumers (defined as households, businesses, and governments) have routinely failed to purchase the energy efficient option and adopt the more energy efficient techniques. The phrase energy efficiency gap recognizes this failure and identifies the difference between the actual energy used for energy services and the level of energy efficiency that could be provided in a more cost-effective manner for the same services [23]. The paradox of why energy efficient technologies and practices are not more commonly utilized is traditionally explained through market failures and barriers.
While the landscape of today is vastly different from that of 20 years ago, an energy efficiency gap still remains and the full potential is far from achieved. Consumers are not rational economic decision-makers. They cannot and will not always act in a fully informed manner, despite incentives and equalized costs. Even today and as explained by Levine et al. [23], profit-centered businesses fail to control their energy use and allow thousands or even millions of dollars go to waste. Households avoid purchasing efficient light bulbs, which have tangible long-term financial payback [24]. While there are a variety of explanations to the energy efficiency gap, consumer behavior should be seen as the most prominent and influential.
Behavioral research adds a more complex component to the energy efficiency paradox, one that is more multifaceted than the traditional economic models focused on price and information. Behaviors are complex and can be influenced by a variety of habits and intangible, subconscious factors. Understanding the complexity of the many varied human behaviors can, yield significant insights on how to best influence and change public perception and action on energy efficiency [25,26].
From still another perspective, IBM’s Global Utility Consumer Survey (2011) found that utilities might reap a more profound set of insights into the minds of their consumers if they were to adopt an approach based more on behavioral economics than on the more familiar “economics of technology.” While there have been some efforts to educate the energy consumer through various conservation efforts, IBM also confirms there remains a broad gap in the amount of information that is accessible to consumers preventing them from making informed choices [27,28]. IBM identified in its consumer survey three behavioral factors impacting how consumers use electricity: alternative motivations, information availability, and social drivers (also see chapter by Laskey and Sayler).
Today energy consumers have alternate motivations. The health of the environment more heavily impacts choices made by the younger generations, while the prosperity of the national economy is a motivator for those over the age of 55. This is in contrast to the previously conceived notion that financial incentives were primary drivers for saving energy among all consumers. Consumer motivations are varied, and noting this variance is critical to influencing changes in behavior [27,28].
Humans are both social and competitive by nature. Developing consumer portals that allow consumers to compare their energy usage with those of others is one way of socially engaging consumers. Social competition is a proven method for persuading and engaging [27,28]. Consumers under the age of 25 are more likely follow the example of others and less likely to rely on their own preferences. “Millennials” (Generation Y) depend heavily on their social networks for news and information. Social media has now become the new driving force for all forms of decision-making. Accordingly, in order to influence behavioral change, electric utilities must carefully select their information and information channels [27,28].
4.3 Why is Today Different?
The landscape of today is vastly different than it was 20 or 30 years ago. This is true for both the electric utility industry and the economy more broadly. New approaches are required that enable the industry to more fully capture the large energy efficiency opportunity. A new world of consumer influence has evolved; a world where consumers make decisions based on social interactions and shared concerns and experiences rather than necessarily based on the purchases of a commodity such as a kilowatt-hour of electricity. In 1990 the market conditions were relatively static, while today we experience an influx of constantly changing information via multiple forms of communication – Twitter, Facebook, email, LinkedIn, tumblr, blogs, “apps,” etc. [21].
Throughout the 1990s the information experience was defined by “content” [29]. Today, the framework has changed; the Internet is now focused on conversations, personal connections, and values. Social and mobile networks have eradicated the concept of simply displaying content for decision-making. “Content” has been replaced by “context,” which is defined by social niches representing unique personal connections [29]. There is a social niche for everyone and the tools of the Internet allow people to develop communities based on their own interests and ideals (Jarvis, 2009). The second Internet revolution, Web 2.0, has completely altered the relationship between companies and their customers. This constant connectivity and new company-consumer relationship illustrates both a threat and opportunity for businesses, such as utilities.
Businesses that were once thought of as too big to fail, have failed. They became victims of this new age of “Digital Darwinism” and consumer transformation [29]. Borders, Blockbuster, and the Yellow Pages were all once mega companies perceived as indestructible to market conditions. Today they are defunct because of their inability to respond to the consumer and digital shift. On January 19, 2012, Kodak filed for bankruptcy following in the footsteps of Blockbuster and Borders. A company, which was an American symbol for decades, unfortunately failed to acclimate to the digital revolution. As Harvard Business School Professor Rebecca Henderson commented, “It wasn’t that Kodak was oblivious to the future, but rather that it failed to execute on a strategy to confront it. By the time the company realized its mistake, it was too late” [30]. In short, Kodak focused too much on the successes of their past and failed to see the opportunities and threats of the future.
Figure 17.5 compares U.S. electricity sales with mail volume, suggesting a parallel progression and drop. The word kilowatt-hours could be substituted for “pieces of mail.” If utilities fail to act and change their commodity-based business model to a service-oriented structure they could be at risk of losing their customer base and revenue stream.
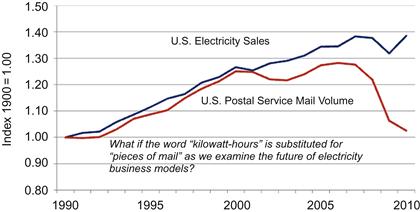
Figure 17.5 Comparing U.S. Electricity Sales with Mail Volume. Source: U.S. Energy Information Administration and U.S. Postal Service.
Consumer preferences are changing, and they want more today from their utilities. The current utility business model is geared toward delivering a commodity value, a kWh, but the new dynamic requires a shift to a service-oriented structure. Utilities must alter their revenue stream from the sale of kilowatt-hours to the sale, upgrade, and integration of energy products and services. A service-focused business model will more effectively engage the customer and strengthen the utility-consumer relationship. Such a structure is vital for utility survival in this new diversified world of economic, environmental and social change.
4.4 The New Energy Consumer
A modernized, informed public and energy consumer has materialized and is continuing to evolve. The public is no longer satisfied with the status quo and the current modes of energy production and operation. Energy consumers are ready for a change. A University of Texas Energy Poll, created by the Energy Management and Innovation Center at the McCombs School of Business, found that energy consumers have a considerable level of distrust and dissatisfaction about the current energy system [31].
Forty-three percent believe the United States is moving in the wrong direction, with only 14 percent believing we are on the right path [31].
Over the next year, 69 percent of survey participants anticipate increased household energy spending [31].
Within the next 25 years, approximately 41 percent of consumers believe the state of our energy sector will have vastly declined [31].
Such levels of distrust and angst about our current system are spurring engagement in energy efficiency and renewable sources.
In 2011, Americans declared that out of the eight actions Congress could address in 112th Congress, Americans were most in favor of an energy bill that provided incentives for using alternative energy (83 percent) [32]. In a survey of 1,016 U.S. adults taken in February 2011, USA Today found that “nearly three of four U.S. adults, or 71 percent, say they have replaced standard light bulbs in their home over the past few years with compact fluorescent lamps or LEDs (light emitting diodes) and 84 percent say they are “very satisfied” or “satisfied” with the alternatives” [33].
The Electric Power Research Institute conducted a consumer engagement study in 2011 on the acceptance and perceptions surrounding the Smart Grid:
Sixty-four percent of the study participants indicated that it would be very useful or extremely useful to understand how much electricity one uses, when it is used, and how much the energy usage will cost prior to receiving the their utility bill. This percentage increases to 92 percent, if “moderately useful” and “somewhat useful” are included [34].
Fifty-eight percent of respondents believe that it would be very useful to have options for owning “smart” energy-saving devices that share energy and information with the grid [34].
Customers now have more tools and an increased capacity to learn about energy efficiency and make informed decisions. Since 1990 there has been an 80 percent increase in the number of cell phone subscribers. In 2010 nearly 98 percent of the U.S. population had a cell phone (U.S Census Bureau, 2011). Cell phone subscribers now have access to social media applications on their phones and are in a constant stream of engagement. Approximately two in five social media users access social media sites from their mobile phones (NM Incite, 2011). Active social media users have tremendous influence offline with 60 percent of social media users creating reviews of products and services (NM Incite, 2011). As an example of such influence, Bank of America was forced to recall a new debit card fee following considerable consumer backlash in the fall of 2011 (Mui, 2011). The onset of a five-dollar monthly debit card fee spurred a reaction where 21,000 people were committed to closing their accounts if the fee wasn’t revoked and 300,000 people signed an online petition (Mui, 2011).
In 1990 consumers waited until the end of the day to get their nightly news. Today information goes directly to the consumer, multiple times a day in the form of tweets, blogs, and status updates. The consumer expects the information to be delivered to them individually and they expect it to be personal. Business as usual has ended and companies can no longer survive on the status quo. The new information architecture has changed where consumers/people are at the center [29].
Not only do customers now have more tools to make educated decisions about energy efficiency, but they also have the capacity to take action. Between 1990 and 2008, energy service companies (ESCOs) grew at a compound annual growth rate of 19.1 percent [19]. The energy efficiency industry is expected to continue on this growth path over the next several years.
This restructuring of the company-customer dynamic provides both an opportunity and a threat to utilities. If utilities want to succeed and provide the highest quality of service, they must become adaptive and recognize the ways for improving customer satisfaction [21]. This means a shift from the delivery of commodities to providing the kinds of services and value that consumers are beginning to expect.7 Through the digital transformation of the late 2000s, customers have become more engaged, informed, and stronger advocates for change.
5 The New Business Model
With an increased environmental awareness and the growing availability of more productive energy technologies, consumers have more reason to be connected, and potentially even become electricity suppliers themselves [35] (see also chapter by Kesting and Bliek). Energy consumers are starting to understand their potential new role in the electric power sector value chain. Volatile fuel prices, future regulatory constraints, financial infrastructural burdens, and an evolved energy consumer have created the perfect environment for electric utilities to create customer centric business models.
In order for utilities to stay competitive and not fall by the wayside, like so many big companies have done with the Web 2.0 revolution, utilities must engage and empower the energy consumer to act in ways that generate greater value-added services rather than just consume electricity. The “new utility” will find ways to leverage and understand their customers’ behaviors by using segmentation and data analytics. This new evolving energy marketplace will force a fresh two-way relationship between utilities and consumers, one where the benefits and responsibilities become shared [35]. A new business model is emerging based on sharing, changing consumer attitudes, social media, and mobile capabilities [36]. This will require utilities to shift from a utility controlled decision-making model that emphasizes the sale of commodities like kilowatt-hours to a consumer focused model that builds on a two-way communication platform, emphasizing value-added services. The “grow and build” platform is no longer a viable one. In a 2010 report by IBM called “Switching perspectives: creating new business models for a changing world of energy,” IBM discusses the traditional electricity value chain and how utilities need to re-invent it to include a new range of participants, an active consumer, bi-directional information flow, and distributed resources [17].
The traditional value chain was unidirectional. The new value chain of the evolving electric grid will have multiple feedback points. Power and information will be traveling in a variety of directions. Diversification will stem from new sources such as, plug-in electric vehicles, customer-owned generation, and energy storage. Customers will play a new role with their ability to provide demand response, electric power, and potentially energy storage. The consumer will no longer be in the position to simply receive value; they will be able to supply it [17].
As the value chain of the electric utility changes, it is imperative that utilities acknowledge the intersection of the new energy consumer, social media, behavioral science, innovation, and data analytics. Each of these components will be critical to developing a customer-focused business model and closing the energy efficiency gap [21]. A 2010 study by Accenture, for example, found that out of 1,000 energy consumers in the United States, 67 percent of survey participants had changed their behavior between one and five times over the course of a year because of content on a social media site [37,38]. Yet, without timely information and the capacity to do it right, those consumer changes may lead to a suboptimal or incomplete result with respect to the full efficiency and value-added opportunities. Hence, broad-scale customer engagement will be needed to ensure improvements in energy efficiency and decreased environmental impacts, and to also assist utilities in creating a profitable business model in the social web era of sharing and collaborating. With this confluence of concepts, utilities will be able to expand their portfolio and continue to diversify services in ways that maintain or appropriately enhance their profit margins.
5.1 Elements and Examples of the New Business Model
The utility business model of the twentieth century was based on increasing electricity sales with an ever-expanding generation base – the “grow and build model” [17]. The role of the consumer was passive; there were no costs on carbon and the average cost of developing new generation was consistent or diminishing [39]. The business model of today must be different because the economic, social, and environmental landscape is different.
As suggested in Figure 17.6 below, the electricity utility industry has been a declining growth industry since perhaps the 1950s. While the figure above displays the U.S. annual growth rate in electricity consumption, the overall trend is confirmed across the OECD. This circumstance alone mandates an entirely different approach to meeting market demands. At the same time, the consumer is no longer passive; they are active, engaged, and aware of their economic surroundings and the potential impacts to their communities and environment. Utilities must acknowledge the financial risk associated with carbon management and the need to account for increasing costs on carbon emissions [39]. Costs are also increasing for new capacity generation, urging utilities to look beyond their traditional service offerings and utilize energy efficiency as a true fuel source. The business model of the 20th century was simple; today it is complex, dynamic, and integrated.
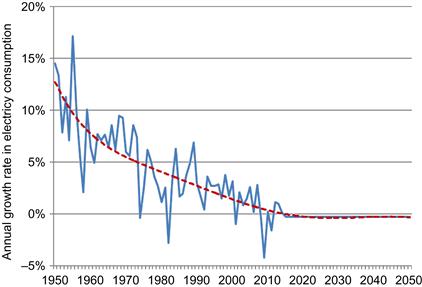
Figure 17.6 U.S. Historical and Future Growth Rates of Electricity Usage. Source: EIA (2012a) for historical data with 2010 and with estimates to 2050 adapted from Laitner et al. (2012).
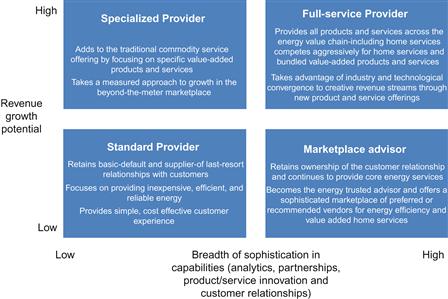
In the 2011 Accenture report, “The New Energy Consumer: Strategic Perspectives on the Evolving Energy Marketplace,” four separate business models are discussed as possible future strategies for success, each with their own opportunities and risks. Each business model recognizes the need for strong customer engagement. However, business models that continue to increase their value-added services will likely see the greatest increase in profit [37,38]. In order to survive it is essential that utilities continue to innovate and expand well beyond their conventional offerings. Utilities that fail to expand their array of services (as opposed to commodities only) will place themselves at risk for becoming displaced by local generation start-ups and competitor networks [40].
Additionally, in the new energy market place utilities will face further competition from companies looking to sell services that decrease electricity usage, such as Gridpoint, Johnson Controls, and AT&T ([40]; see also [11]). While Accenture lists four separate business models, becoming a full energy service provider is the only option for guaranteeing increased profits and ensuring long-term viability and success in the new dynamic energy marketplace. Figure 17.7 suggests that moving away from the standard commodities-based model of selling kilowatt-hours (see the lower-left quadrant of Figure 17.7) and toward becoming a full energy service provider (shown in the upper right of Figure 17.7) is more likely to maintain and/or enhance future revenue potential – especially in light of a declining market as suggested in Figure 17.6.
NRG Energy is a Fortune 250 wholesale power generation company headquartered in Princeton, NJ. It typifies many of the aspects of a utility that is transitioning into a full energy service provider. In effect, it is capitalizing on industrial and technological advancements to increase its bottom line. The company is expanding their offerings by creating subsidiaries in specific focus areas such as, renewable power and electric vehicle services. By developing their role in the electric vehicle systems market, NRG will acquire a new customer base. Despite expanding their services and altering their business model the company was still able to leverage existing capabilities and combine the electric vehicle services with the traditional electric customer package. Growing the value chain not only strengthens the relationship with the customer, but it solidifies NRG’s positioning in the new dynamic energy marketplace [37,38].
The largest electric utility in Spain, Endesa, reinvented itself in order to prosper in the emerging multi-product marketplace. Challenged by the ability to profit in an environment with non-commodity oriented sales, the company found a way to increase their product line and customer outreach. Endesa re-structured their growth on the premise that their bottom line was directly linked to customer approval and engagement. Moving beyond a traditional growth structure for a utility, Endesa added services like residential solar power, home protection services, home heating control, as well as wiring and plumbing maintenance services [37,38]. The key to Endesa’s success has been integrating new product development with meeting customer needs and ensuring customer satisfaction. Endesa further complemented a new retail portfolio with an extension into online social services. The company created an online social site, www.twenergy.com, where customers can play educational games on energy efficiency and conservation [37,38].
Imaginative and innovative thinking is necessary to change the energy business model. The work behind the Pecan Street Project is one example of pushing the boundaries of the traditional electric utility structure. The Pecan Street Project is an organization through the University of Texas-Austin working to redesign the electric grid by testing new technologies and examining customer behavior with new energy management systems. In evaluating potential new business models, the Pecan Street Project released a report in 2010 that envisions Austin Energy as a fee-based service provider as opposed to a rate-charging commodity provider [41]. The report underscores the importance of transitioning to a new business model with distributed generation and increased customer engagement and involvement in energy efficiency. Under this service provider business model, customers could sign up for a plan at a fixed rate each month. The plan would engage customers as energy partners, not just receivers. For example, customers would agree to make their rooftops available for solar power, become involved in demand response programs and would acknowledge that using energy outside of their service plan would be “pay as you go” [41]. This structure would be relatively comparable to that of a cell phone bill agreement. With a cell phone bill structure, one pays for certain services (talk minutes, text messages, video downloads, etc.) with an agreed upon limit and if the limit is exceeded additional charges accrue [42]. Such a flat rate model would transition the utility’s reliance from the sale of kilowatt hours to revenue generated from energy services and products.
The CEO of Duke Energy, Jim Rogers, strongly believes in developing a business model where the profits are closely aligned to the customer and their energy choices [42]. The company understands the need to go beyond the meter, foster new customer relationships, diversify the energy portfolio with clean, renewable sources, and provide a substantial platform and service for energy efficiency [42]. Utilities have the tools to advance energy efficiency, more so than any other industry with their ability to successfully raise capital. In 2007, Duke Energy proposed the “Save a Watt” energy efficiency program to the North Carolina Utilities Commission designed to allow Duke Energy to prosper in the new dynamic energy marketplace. The program would align the installation of energy efficiency measures within their basic electric service package, similar to the combined structure utilized by NRG Energy for their electric vehicle services [42]. Energy efficiency would be viewed as another fuel source and subsequently, an investment in a new generating station (Duke Energy, 2007). Duke would use the program to create a profit and also ensure that the planning and approval process was unlike the traditional, complicated, and cumbersome structure of most energy efficiency programs.
In the original model, Duke was poised to retain 90 percent of the difference between implementing energy efficiency and the cost of building an additional power plant. If a new power plant cost 6 cents/kWh and implementing energy efficiency measures costs 3 cents/kWh, then Duke could profit 90 percent of the difference, or 2.7 cents/kWh [42]. The energy efficiency program was perceived to be too profitable for Duke Energy by regulators, and the profit ratio was eventually reduced since the original proposal in 2007 [42]. Nonetheless, Duke Energy showed that energy efficiency could replace the old “grow and build” business model through customer engagement and energy efficiency measures. With considerable profits from energy efficiency investments and reduced energy cost savings, Duke Energy defined energy efficiency as a new fuel source and a replacement for investing in new capital-intensive coal plants [43]. The “Save a Watt” program has not been approved in all of the states that Duke Energy services. However, it has been successful in Ohio and additionally in North Carolina where the program was approved through 2013 (Duke Energy, 2011).
In these examples, the electric utility business model of the 21st century is all about selling services not commodities. This model has been accepted by Duke Energy’s Jim Rogers, as evidenced by the “Save a Watt” program. He comments, “I would rather invest $10 billion in making my customers more productive with their use of energy than put $10 billion into a new nuclear power plant” [42].
The future of business will continue to be defined by shared experiences and customer relationships. Successful utilities must be able to create business models that incorporate customers into the company culture, process, and development [29]. The key to becoming and staying relevant today and in the future will be customer-focused engagement with an understanding of behavioral science and data analytics, added energy services that meet customer needs, and developing energy efficiency as a new fuel source. With routine and sustained engagement, utilities can spur greater adoption of energy efficiency, increase productivity, and expand profits by converting connected customers into connected energy efficiency advocates [21].
6 Conclusions
In many ways the kind of transition that is needed within the current utility business model to achieve new levels of productivity and market share might be exemplified by the post-1993 transformation of International Business Machines (IBM). In 1993, IBM was a global leader in the information technology (IT) industry – but it was in deep financial trouble. The company had reported a net loss of $8.1 billion, the largest ever in the history of that industry. Many analysts wrote off IBM as dead. Author Charles Ferguson [44] wrote that IBM’s prospects for survival were very bleak. Larry Ellison, the CEO of Oracle Corporation, IBM’s main competitor at that time – said, “IBM? We don’t even think about those guys anymore. They’re not dead, but they’re irrelevant."
Faced with organizational deficiencies and the increasing commoditization of personal computers, IBM management made the bold (and at the time controversial) decision to shift its focus to a service-driven business model. In what was termed as the most remarkable turnaround of any company ever, ten years down the line in the fiscal 2003, IBM reported a net income of $7.58 billion on revenues of $89.13 billion. Today, IBM’s consulting business has reinvigorated and reinvented the company, taking IBM from the brink of financial disaster to a poster child of managerial and fiscal success. In short, IBM was transformed from a company that primarily manufactured mainframes to a company that offered complete IT solutions. The company changed its focus from being product centric to being customer-centric. Put differently, IBM transformed from a commodity manufacturer with razor-thin margins, to a value-added service provider with robust profits. Today, IBM boasts a market capitalization of $232 billion dollars. Compared to Oracle Corporation’s market capitalization of $134 billion, IBM is anything but irrelevant (Bloomberg, NYSE, May 11, 2012, close; NASDAQ, May 11, 2012, close).
It is this same kind of new business model that is needed in order to move from anemic levels of (in)efficiency to one that enables a more robust economy over the next decades. As Laitner et al. [2] and other studies have documented, we have a full array of energy efficiency improvements that can deliver a 40 to 60 percent reduction in both electricity and overall energy needs by the year 2050. But market pressures are building, and consumers are changing. What was once a passive customer is quickly becoming a much more vital part of the give-and-take within the market. And, they are looking to pull more value out of purchases than ever before. All of this means that in order to accommodate the greater imperative for building a more energy-efficient economy and to leverage the full energy efficiency resource opportunity that enables a more robust economy, the development of entirely new business models that engage and empower consumers is necessary to ensure such a transition.
References
1. Ayres RU, Warr B. The economic growth engine: how energy and work drive material prosperity Northampton, MA: Edward Elgar Publishing, Inc; 2009.
2. Laitner JA “Skip”, Nadel S, Elliott RN, Sachs H, Khan AS. The long-term energy efficiency potential: what the evidence suggests Washington, DC: American Council for an Energy-Efficient Economy; 2012; Available at: ACEEE Report E121, <http://www.aceee.org/research-report/e121>.
3. Harvey LDD. Energy demand scenarios. Energy efficiency and the demand for energy services London, UK: Earthscan Ltd; 2010.
4. Rifkin J. The third industrial revolution: how lateral power is transforming energy, the economy, and the world New York, NY: Palgrave MacMillan; 2011.
5. Energy Information Administration. [EIA]. Annual energy outlook 2012 early release Washington, DC: U.S. Department of Energy; 2012; DOE/EIA-0383er(2012). <http://www.eia.gov/forecasts/aeo/>.
6. Bureau of Statistics. Statistical abstract of the United States: 1900 Washington, DC: U.S. Department of the Treasury; 1901.
7. Energy Information Administration. [EIA] 2011 Annual energy review 2010. DOE/EIA-0384(2010). <http://www.eia.doe.gov/aer/>. Washington, D.C.: US Department of Energy.
8. Energy Information Administration. [EIA]. Short-term energy outlook. April Washington, D.C: U.S. Department of Energy; 2012; <http://www.eia.doe.gov/steo/>.
9. Laitner JA “Skip”. The positive economics of climate change policies: what the historical evidence can tell us ACEEE Report E095. Washington, DC: American Council for an Energy-Efficient Economy; 2009.
10. Laitner, J.A. “Skip”. Climate change policy as an economic redevelopment opportunity: the role of productive investments in mitigating greenhouse gas emissions. ACEEE Report E098. Washington, DC: American Council for an Energy-Efficient Economy, 2009b.
11. Laitner JA“Skip”, McDonnell MT, Ehrhardt-Martinez K. The NPPD generations options analysis: continuing to focus on the emerging markets. A presentation given to the Nebraska Public Power District Board of Directors, February 8, 2012. Columbus, NE; 2012.
12. [McKinsey]. Unlocking energy efficiency in the U.S. Economy. McKinsey & Company, <http://www.mckinsey.com/Client_Service/Electric_Power_and_Natural_Gas/Latest_thinking/Unlocking_energy_efficiency_in_the_US_economy>; 2009. [accessed 09.04.12].
13. [APS] American Physical Society. Energy future: think efficiency Washington, D.C.: American Physical Society; 2008.
14. Griffith B, Long N, Torcellini P, Judkoff R, Crawley D, Ryan J. Assessment of the technical potential for achieving net zero-energy buildings in the commercial sector Golden, Colo: National Renewable Energy Laboratory; 2007.
15. Bailey O, Worrell E. Clean energy technologies: a preliminary inventory of the potential for electricity generation Berkeley, CA: Lawrence Berkeley National Laboratory; 2005.
16. Munson R. From Edison to Enron: the business of power and what it means for the future of electricity Westport, CT: Praeger Publishers; 2005.
17. Valocchi M, Juliano J, Schurr A. Switching perspectives: creating new business opportunities for a changing energy world. IBM institute for business value. IBM corporation; 2010.
18. Gianunzio M. Changing the customer-utility paradigm. American public power association, <http://www.publicpower.org/Media/magazine/ArticleDetail.cfm?ItemNumber=31244>; 2011.
19. Harris Williams & Co. ESCOs – enabling energy efficiency: an introduction to energy service companies (“ESCOs”), <http://www.harriswilliams.com/pdf/HW&Co.ESCOWhitePapeFinal.pdf>; 2009. [accessed on 31.01.12].
20. Lovins A, Rocky Mountain Institute. Reinventing fire: bold business solutions for the new energy era Vermont: Chelsea Green Publishing; 2011.
21. Keller HM. Why is today different? Reinventing the electric utility business model. master’s thesis. Advanced academic programs, Johns Hopkins University, <https://jscholarship.library.jhu.edu/>; 2012. (forthcoming).
22. Dietz T. Narrowing the US energy efficiency gap. Proceedings of the national academy of sciences of the United States of America. 2010;107(37):16007–16008.
23. Levine M, Koomey J, Hirst E, Sanstad A, McMahon J. Energy efficiency policy and market failures. Annual review of energy and the environment. 1995;20:535.
24. Charles D. Leaping the efficiency gap. Science. 2009;325(5942):804–811.
25. Allcott H, Mullainathan S. Behavior and energy policy. Science. 2010;327(5970):1204–1205.
26. Ehrhardt-Martinez K, Laitner JA. People-centered initiatives for increasing energy savings Washington, DC: American Council for an Energy Efficient Economy; 2010.
27. IBM Corporation, IBM survey reveals new type of energy concern: lack of consumer understanding: behavioral economics a key factor to realizing the benefits of smarter energy. <http://www-03.ibm.com/press/us/en/pressrelease/35271.wss>; 2011a. [accessed 04.12].
28. IBM Corporation, The social business: advent of a new age, <http://www.ibm.com/smarterplanet/global/files/us__en_us__socialbusiness__epw14008usen.pdf>; 2011b. [accessed 09.04.12].
29. Solis B. The end of business as usual: rewire the way you work to succeed in the consumer revolution New Jersey: Jon Wiley & Sons, Inc; 2012.
30. Time Business, <http://money.usnews.com/money/blogs/flowchart/2010/08/19/10-great-companies-that-lost-their-edge>; 2012 January 20. [accessed on 01.02.12].
31. Brooks S. Texas enterprise. Poll: Americans aren’t optimistic about energy, <http://texasenterprise.org/article/poll-americans-arent-optimistic-about-energy>; 2011. [accessed 09.04.12].
32. GALLOP, <http://www.gallup.com/poll/145880/Alternative-Energy-Bill-Best-Among-Eight-Proposals.aspx>; February 2, 2011. [accessed on 31.01.12].
33. USA Today, <http://content.usatoday.com/communities/greenhouse/post/2011/02/poll-americans-ok-newer-light-bulbs/1percent29>; February 18, 2011. [accessed on 31.01.12].
34. Electric Power Research Institute [EPRI]. Consumer engagement: facts, myths, and motivations grid strategy 2011: consumer engagement Palo, Alto, CA: Electric Power Research Institute, Inc; 2011.
35. Valocchi M, Juliano J, Schurr A. Lighting the way: understanding the smart energy consumer Somers, NY: IBM Corporation; 2009.
36. Ganksy L. The mesh: New York New York: Penguin Group; 2010.
37. Accenture, Revealing the values of the new energy consumer: accenture end-consumer observatory on electricity management 2011, <http://www.accenture.com/SiteCollectionDocuments/PDF/Resources/Accenture_Revealing_Values_New_Energy_Consumer.pdf>; 2011a. [accessed 09.04.12].
38. Accenture, The new energy consumer: strategic perspectives on the evolving energy marketplace, <http://www.accenture.com/SiteCollectionDocuments/PDF/Resources/Accenture_New_Energy_Consumer_Evolving_Marketplace.pdf>; 2011b. [accessed 09.04.12].
39. Small F, Frantzis L. The 21st century electric utility: positioning for a low carbon future Boston, MA: Ceres; 2010.
40. Fox-Penner P, Wharton J. Surewest’s transformation and its lessons for today’s electric utilities The Brattle Group, Inc 2011.
41. Duncan R. Renewable energy world. Renewable energsy and the utility: the next 20 years. <http://www.renewableenergyworld.com/rea/news/article/2010/05/renewable-energy-and-the-utility-the-next-20-years>; 2010. [accessed 22.04.12].
42. Fox-Penner P. Smart power: climate change, the smart grid, and the future of electric utilities Washington, DC: Island Press; 2010.
43. Alschuler E. 2012. Unlocking efficiency in office districts a comprehensive approach to efficiency programs. Proceedings of the 2012 ACEEE summer study on energy efficiency in buildings. Washington, DC: American Council for an Energy-Efficient Economy.
44. Ferguson C. Computer wars: the fall of ibm and the future of global technology New York, NY: Times Books; 1993.
1Some may be surprised. The estimated efficiency of converting energy into useful work in 1950 was only 7.99 percent. The calculation to estimate the current level of efficiency over the last 60 years at an average 0.93 percent rate of improvement is 7.99 percent * 0.9360=13.96 percent efficient in the year 2010.
2More formally, a British thermal unit is the amount of heat required to raise one pound of water one degree Fahrenheit at one atmosphere pressure. There are approximately 1,055.056 Joules of heat in one Btu.
3Many of the values discussed here are preliminary estimates for the later years as 2010 and 2012. And those values will differ in some cases, depending on the EIA document that is used as a reference. For example, the EIA’s Annual Energy Review for 2010 (the latest currently available) shows total energy per kWh as 10,189 Btus, a five percent difference than reported in the text. The Annual Energy Outlook is a later publication so we choose the value reported there. However, those small differences do not change the outcomes of the larger discussion reported here.
4Even food can be compared on a heat or energy equivalent. A quarter pound cheeseburger from McDonald’s contains an estimated 510 food calories, which is the equivalent of just over 2,000 Btus. Expressed as an equivalent of electricity, the cheeseburger has an energy value of 0.593 kWh about the same as the electricity required to light a 100-watt incandescent bulb for almost 6 hours.
5Perhaps not immediately apparent, but the growth in GDP is a function of multiplying the rate of population growth times the rate of growth in productivity, the latter of which can also be expressed as a growth in GDP per capita. So, for example, if population growth in Column A of Table 17.1 averages 1.03 percent in the period 1980 to 2010, and productivity growth averages 1.71 percent, then (1+0.0103) times (1+0.0172) equals 1.0277, which results in a growth of 2.77 percent.
6The U.S. economy provided a GDP of $5,389 billion in 1980. It more than doubled in size, reaching a total of $13,248 billion by 2010 (with both values measured in constant 2005 dollars). Perhaps not immediately apparent, but had the U.S. economy maintained a productivity improvement of 2.25 percent rather than 1.72 percent over the period 1980 to 2010, even with a smaller population grow rate, GDP would have actually grown to an estimated $15,491 billion (also in constant dollars). In other words, a very small change in productivity would have meant an economy that was about $2.2 trillion larger than we actually recorded in 2010.
7It may not be immediately obvious but again the word consumer is more than households. The term refers to any individual, corporation or entity that consumes electricity. Yes, this includes households but it also includes businesses, industries, and governments.