The Holy Grail
Consumer Response to Energy Information
Chris King1 and Jessica Stromback2, 1eMeter, a Siemens Business, 2VaasaETT
1 Introduction
Since the first championing of energy efficiency by Art Rosenfeld and others in the 1970s, consumers have suffered from a lack of energy usage data, data that can greatly increase the level of achievable improvement – and further contribute to zero demand growth. How much? A recent study, discussed in detail below, found such data could lead to average usage reductions of 8.7 percent among those who engaged with the programs;1 at today’s retail prices,2 this would translate into savings for U.S. residential consumers of $15 billion per year.
Energy information feedback revolutionizes energy efficiency, creating “Intelligent Efficiency.”3 In general, energy efficiency is the receipt by an energy user of the same value or functionality through utilization of fewer kWh of electricity.4 There are three main mechanisms for achieving this result:
![]() New versions of appliances or equipment can be manufactured using more energy efficient designs, often driven by standards such as California’s Title 24 program.5
New versions of appliances or equipment can be manufactured using more energy efficient designs, often driven by standards such as California’s Title 24 program.5
![]() Energy users can turn off equipment or appliances that provide no value, such as lighting in a vacant room.
Energy users can turn off equipment or appliances that provide no value, such as lighting in a vacant room.
![]() Consumers can make proactive decisions to upgrade their equipment, appliances, insulation, windows, or other items to more efficient devices.
Consumers can make proactive decisions to upgrade their equipment, appliances, insulation, windows, or other items to more efficient devices.
Unlike the first point – standards that take effect naturally but over a long time period – both the second and third mechanisms require active decision-making based on information – hence the term, “intelligent energy efficiency.” At the heart of such decisions is energy usage data.
Appliance and building standards have been the heart of policymakers’ implementation strategy for energy efficiency. Now, information technologies – above all the Internet and smart meters – make it possible to achieve the holy grail of intelligent energy efficiency, because there is now cost-effective availability of and access to detailed and useful energy information.
Utility websites provide access to usage and cost data from bills but often go further. Some add in other data sources – e.g., weather and housing data – or comparison data for similar customers. Other utilities have online audit software that shows users, after filling out a form, how much of their usage is going to different end uses. Such additional data can be delivered through other means as well, including monthly utility bills and even mailed reports. At the other extreme to mailed reports of month-old data are in-home displays (IHDs) that show real-time consumption information sent directly from the meter to the display.
The most effective approach combines convenient access to the data with regulations that protect consumer privacy and security.7 The first element of physical access is letting consumers see their data by putting usage and cost data online, where it can be accessed, normally at no cost. The second element is giving consumers their data, by enabling them to download it, import it into a spreadsheet, or authorize a third-party to receive it for various analyses. The third element is, where smart meters are installed, to enable data to be sent in real-time to local displays or devices. In all cases, up-to-date security measures are essential for consumer protection.
Utilities have conducted many pilot programs to test the effectiveness of information feedback. These programs find that consumers use less energy when provided with additional information. As described in section 5 of this chapter, the level of savings varies from a bare minimum to over 10 percent, averaging 8.7 percent.8 Various factors influence the results. Generally, the more timely the data, the greater the efficiency gains.
Building and appliance standards have achieved impressive results for energy efficiency, first in California, then throughout the United States, and finally internationally. The addition of information feedback has significant promise for making further progress. Utilities across the United States began providing monthly data on their websites in the first half of the last decade. Those with smart meters have added interval usage data to their websites, and the trend is to add more functions, including bill comparisons and budget alerts. While utilities in Ontario have followed – or sometimes lead – the U.S. utilities closely, other countries have made less progress. There have been many experiments, especially in Europe, but far less wide-scale implementation outside North America.
Programs providing real-time data have been active in Texas and the UK, where such data is provided via specialized in-home displays to tens of thousands of customers.
As smart meters are more widely adopted and as regulators further develop data access policies for consumers, online and real-time data access are expected to grow rapidly in both availability and effectiveness.
This chapter has six sections. Section 1 is the introduction. Section 2 describes the elements of the physical infrastructure needed to deliver energy usage data to consumers most effectively. These include online access, enablement of third parties, and real-time data, when smart meters are available. Section 3 identifies the key industry standards that apply to the physical infrastructure. The focus is on access via utility websites, the interface to deliver data to authorized third parties, and the real-time interface into the home or building. Section 4 describes essential regulatory policies to protect customer data privacy and security. Some policies are specific to energy consumption data, while others leverage existing consumer protection legislation. Section 5 presents empirical results. These data are from a variety of information feedback pilots and programs. They range from enhanced information on monthly bills to multi-functional utility websites to real-time IHDs. The chapter’s conclusions are summarized in section 6.
2 Energy Information Feedback Physical Infrastructure
Maximizing the effectiveness of data in helping consumers achieve energy efficiency goals requires a three-part conceptual infrastructure. To begin, customers need to be able to view data already held by the utility in the way most convenient to them – online. Then, they need a means of getting the data themselves so they can use it with other software or share it with third parties that can help analyze it. Finally, if smart meters are installed, consumers should have access to real-time usage data. To minimize cost, this framework leverages the Internet.
2.1 Element One: Letting Consumers See their Cost and Usage Data
Lord Kelvin is credited with saying, “You can’t manage what you don’t measure.” Beyond recording usage, energy measurement values need to be readily available for energy consumers to utilize the data. In today’s world, “readily available” means online. Importantly, this first element of our energy information feedback infrastructure does not require the collection of any new data. It is as simple, conceptually, as taking what’s already in the billing system and putting it online.
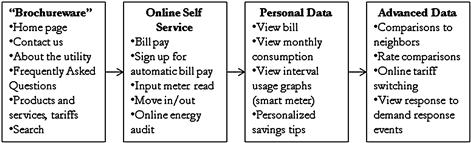
This ability to gain access to one’s personal cost and usage data online is the third, and perhaps last, major step in the evolution of utility websites. The first, beginning in the late 1990s, was the initial creation of websites. These were generally what was known as “brochureware,” because the web pages contained static, rarely changing information. Such sites were a source for general descriptions of utility services and perhaps posting of annual financial reports or other company-oriented information. Many small utilities still have such websites.
Some examples of functionality introduced at this stage are as follows:
![]() Frequently Asked Questions, such as “How to read your meter”
Frequently Asked Questions, such as “How to read your meter”
The second evolutionary stage was to create the ability for customers to transact with the utility – using the website instead of calling up customer service representatives. At this point, energy users began to use websites to make payments, sign up for budget billing plans, or even initiate or move service. These online transactions reduce utility labor costs and increase customer satisfaction, making such websites effective and popular.
The overall concept is to provide the same services and options as “offline” customer service, but to make those services available online. Few new services have been introduced in this evolutionary stage. By now most websites of large utilities have various online transaction capabilities. These typically include the following:
The third stage of evolution is the addition of energy information feedback supporting customer energy efficiency activities. In essence, it involves making the utility website an information portal for a customer’s own information. A common first feature is online presentment of customer total bill amounts – but not details such as consumption. Over time, consumers are given access to more information, including monthly usage. Where smart meters have been installed, most customers in North America have access to their interval usage data.
Some utilities are going further and adding personalized analysis. For example, California’s three major investor-owned utilities – Pacific Gas & Electric, Southern California Edison, and San Diego Gas & Electric – have added bill comparisons. Customers of those utilities can click a website button and see what their annual energy bills would total according to the different rate options available to them, generally a tiered flat rate, a time-of-use rate, and a dynamic pricing option (e.g., critical peak pricing). They can then switch tariffs online, selecting the tariff that best fits their needs.
As will be discussed in section 5, data that is more timely is more useful for managing energy consumption. The online information is only as timely as the underlying data. For example, monthly data is not available until the end of the billing month. On the other hand, for customers with smart meters, the standard practice for retrieving data to the utility data center – and which could be considered the best practice – is to retrieve meter data daily and post it within the next day or so.9
Next-day data provides near term feedback for energy-consuming activities conducted yesterday and still fresh in the consumer’s memory. It allows for timely calculation of month-to-date bills and corresponding projections. It supports sending email or text message energy alerts for crossing a usage or budget threshold. And next-day data enables email or text message notification that a customer’s energy price has gone up to the next price tier.10
Real-time data is available through the home area network (HAN) interface available in most smart meters, though delays in industry standards development have limited the number of utilities that have activated the HAN interfaces.
2.2 Element Two: Letting Consumers Download or Share their Data
The second element of our energy information feedback infrastructure is allowing consumers to download their data or authorize the sharing of their data with third-party service or application providers to use the data – at the consumer’s choice and only with the consumer’s authorization – to help manage consumption. Aneesh Chopra, former Chief Technology Officer of the United States, calls this “liberating the data.”11
2.3 Element Three: Real-Time Access to Usage Data
The third element regards real-time data. Our information framework also accounts for smart meters but does not require them. The idea is that if there is a smart meter, then the smart meter should have a built-in communications interface to send real-time usage data to an IHD, gateway, or other device, whether in a home or in a business. Figure 21.1, above, is an example of an IHD that retrieves real-time data directly from the electricity meter and shows the results to the consumer. Similarly, if there is a smart meter, the emerging best practice is daily retrieval of the data and posting on the utility website for customer access within 48 hours.
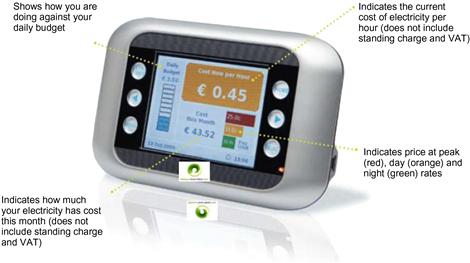
Figure 21.1 Display, electricity smart metering customer behavior trial in Ireland.6

3 Standards
The U.S. National Institute of Standards (NIST) leads the Smart Grid Interoperability Panel (SGIP) to produce and maintain a catalog of standards. The catalog is a compendium of standards and practices considered to be relevant for the development and deployment of a robust and interoperable smart grid, including standards for exchanging energy usage information.
3.1 The Role of Standards for Energy Usage Data
These standards specify how energy consumption data from meters, especially smart meters, is to be stored and shared. For example, there are standards for how data should be stored in utility databases and in electricity meters. Other standards are data models that specify how different data elements are interrelated – such as the connection between the meter, the consumer, the transformer, and the distribution circuit. These data models are used in software applications that manipulate or analyze energy usage data, including presentment of data to consumers via online websites.
The most important use of standards is in exchanging data between computer systems operated by different entities. Examples include exchanging data between one utility system (e.g., billing) and another (e.g., demand response management), between the utility and the customer (e.g., downloading energy usage data to a laptop), or between the utility and a third-party authorized by a customer (e.g., a company that provides demand response services to energy customers).
Without such standards, the exchange of data between parties requires custom development of software interfaces. This is costly in both time and money. The standards also allow competitive markets to develop. Standardized data exchange with authorized third parties allows multiple companies to develop products and services for energy customers, knowing that they will be able to obtain the energy information from the utility via the standard interface – once the interface has been adopted and implemented by the utility, of course.
The standards process and concepts can be daunting at first glance. There are literally hundreds of current and potential standards that affect smart meters and the grid. Also, standards development organizations (SDOs) operate around the globe.
There are four key points regarding standards that apply to energy usage information, as described below.
3.2 The Standards Context
The first point to consider is that standards are a journey, not a process. New standards are introduced into the market all the time. There is no “end point.” Smart grid standards get adopted as they become available – and as utilities and other companies decide it is sensible to use them.
In addition, standards are an opportunity, not a requirement. Independently operating SDOs such as IEEE and IEC develop standards. Governments often recognize standards, but only rarely mandate adoption of specific ones. For example, regarding the NIST smart grid standards catalog, George Arnold, NIST’s National Coordinator for Smart Grid Interoperability, explains: “Entries in the Catalog of Standards constitute the first items in what will be a useful toolkit for anyone involved in the Smart Grid – whether they are utilities that generate and distribute power, companies developing new electronic devices, or consumers who buy and use them.”12
In another good example of standards best practice, the Public Utility Commissions of California and Texas have ordered utilities in those states to use an open standard for the HAN interface on their smart meters. In both cases, they declined to specify which standard.
3.3 Interoperability
Interoperability is the most important goal of standards. Interoperability means devices able to send data to one another – for example, computer wifi networks. Another form of interoperability is when different entities send data to one another – for example, a utility sending data to its customers via a website. Interoperability is what made the Internet possible, not to mention huge leaps and bounds in the functionality of almost every kind of electronics.
For the smart grid, interoperability spurs two important kinds of competition that ultimately benefit consumers, utilities, and the smart grid ecosystem:
![]() Competition in available products. When devices from different manufacturers and vendors can talk to devices from other manufacturers and vendors, those manufacturers and vendors must compete for utility or consumer purchasing dollars.
Competition in available products. When devices from different manufacturers and vendors can talk to devices from other manufacturers and vendors, those manufacturers and vendors must compete for utility or consumer purchasing dollars.
![]() Competition among service providers. Interoperability allows data to be exchanged between multiple parties so utilities and consumers can use data services of different parties.
Competition among service providers. Interoperability allows data to be exchanged between multiple parties so utilities and consumers can use data services of different parties.
In both cases, interfaces use a published, open interface – usually without paying royalties to use the standard.
3.4 Key Standards for Energy Information for Energy Users
Of the hundreds of smart grid standards currently in development and use, two are crucial for the smart grid. These concern two key interfaces (see Figure 21.4):
![]() Open Home Area Network (OpenHAN), allowing in-premise energy devices to communicate with each other.
Open Home Area Network (OpenHAN), allowing in-premise energy devices to communicate with each other.
![]() Open Automated Data Exchange (OpenADE), allowing utilities to exchange information with customers or other parties authorized by customers to receive data.
Open Automated Data Exchange (OpenADE), allowing utilities to exchange information with customers or other parties authorized by customers to receive data.
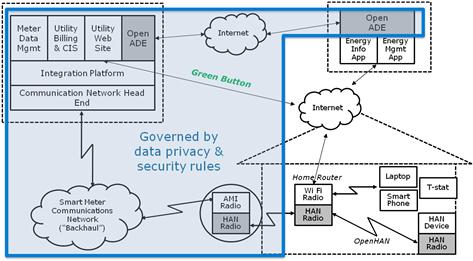
Figure 21.4 OpenADE, including Green Button, is a key standard for delivering data to energy users or their service providers. OpenHAN enables the provision of real-time meter data to in-premise devices, including homes and businesses.
OpenHAN (which could be ZigBee, wifi, or something else) enables low-cost, high-function smart appliances, lighting systems, and smart thermostats – such as the Nest thermostat developed by the iPod’s creator. OpenHAN applies equally to businesses.
OpenADE allows utilities to share with their own customers or with third-party service providers to help energy users understand and manage their energy usage. Importantly, parts of OpenADE (other standards) will make it easier for utilities to manage smart meter data internally – as well as exchange it between internal systems.
OpenADE is another name for the Energy Services Provider Interface (ESPI) standard adopted and administered by the North American Energy Standards Board (NAESB). ESPI is a standardized process and interface for the exchange of a retail customer’s energy usage information between their designated data custodian (i.e., electric utility) and an authorized third-party service provider. It includes a consistent method for the authorization of third-party access to retail consumer’s usage information and a standardized interface for the exchange of that information. The goal of ESPI is to support the development of innovative products that will allow consumers to better understand their energy usage and to make more economical decisions about their usage.
The ESPI standard provides model business practices, use cases, models and technical details that describe the mechanisms by which the orchestrated exchange of energy usage information may be enabled. NAESB works closely with NIST and SGIP.
3.4 Green Button Initiative
Green Button is a subset of the ESPI standard. It is based on the idea that electricity customers should be able to securely download their own easy-to-understand energy usage information from their utility or electricity supplier. Armed with this information, consumers can use a growing array of new web and smartphone tools to make more informed energy decisions, optimize the size and cost-effectiveness of solar panels for their home, or verify that energy-efficiency retrofit investments are performing as promised. Consumers are also seeing innovative apps that allow individuals to compete against Facebook friends to save energy and lower their carbon emissions.
Green Button is an industry-led effort that responds to a White House call-to-action: provide electricity customers with easy access to their energy usage data in a consumer-friendly standard format via a “Green Button” on electric utilities’ websites.
Voluntary adoption of this consensus standard by utilities across the United States is allowing software developers and other entrepreneurs to leverage a sufficiently large market to support the creation of innovative applications that can help consumers make the most of their energy usage information. Initially launched in January 2012, by May 2012 utilities committed to provide Green Button capability to over 30 million energy customers by the end of 2012.13 At the same time, application developers have already created over 50 different applications.14
4 Consumer Data Privacy and Protection
Security of customer information in wireless applications, and how personal data characteristics (such as customer usage information) can be protected are issues often mentioned in discussions of the Smart Grid and cybersecurity. Encryption of data (with limited decryption for data checking), and aggregation of data at high levels to mask individual usership have been mentioned as ways to protect the identity of individual customers. Customer-specific data stored in HANs, or customer-specific data communicated between the HAN and distribution utility (or load aggregator) must be secure to protect the privacy of information.15

Figure 21.5 Leafully is an example of a Green Button application and the winner of the U.S. Department of Energy Apps for Energy competition.
The National Regulatory Research Institute recommended in a recent report16 that public utility commissions should define the information that utilities will collect, determining with whom and for what purpose it should be shared, and assess the need for protecting the data. While allowing states to develop their own policies may be accomplished more quickly, the report also advocates a national approach to smart grid privacy issues.
4.1 California Public Utilities Commission Regulations
In 2011, the California Public Utilities Commission (CPUC) adopted the world’s first comprehensive set of rules to ensure that consumers can access the detailed energy usage data gathered by their smart meter – while also protecting the privacy and security of their data. Figure 21.4 illustrates the entities and data exchange interfaces that are covered by the CPUC rules, essentially regulated utilities and third parties authorized by customers to receive their data.
The CPUC clarified that its regulatory mandate includes exercising jurisdiction over regulated utilities with respect to energy data, privacy, and security. Furthermore, to protect consumer privacy and data security, the CPUC is exercising jurisdiction over third parties who receive data (via the utility’s data center) in the course of providing services to utilities, or when authorized by consumers. However, the CPUC is not exercising jurisdiction over third parties who receive energy usage data directly from a device installed at a residence or business that receives data via the HAN interface.
In this decision the CPUC relied mainly on existing privacy law, using the Fair Information Practice Principles that the U.S. Department of Homeland Security developed as its privacy framework. To clarify the application of these principles, the CPUC decision includes an appendix with details of its privacy rules.
Here is a condensed summary of the FIP principles as utilized by the CPUC:
![]() Transparency: Utilities and covered third parties must provide customers with meaningful, clear, accurate, specific, and comprehensive notice regarding the accessing, collection, storage, use, and disclosure of energy usage information.
Transparency: Utilities and covered third parties must provide customers with meaningful, clear, accurate, specific, and comprehensive notice regarding the accessing, collection, storage, use, and disclosure of energy usage information.
![]() Individual Participation: Utilities and covered third parties must provide to customers convenient and secure access to their energy information in an easily readable format. They must also provide customers with convenient mechanisms for granting and revoking authorization for uses of energy information other than using it solely for the delivery of purchased electricity.
Individual Participation: Utilities and covered third parties must provide to customers convenient and secure access to their energy information in an easily readable format. They must also provide customers with convenient mechanisms for granting and revoking authorization for uses of energy information other than using it solely for the delivery of purchased electricity.
![]() Purpose Specification: The notice provided to energy users must include an explicit description of: 1) each category of information collected, used, stored or disclosed by and the specific purposes for which it will be collected, stored, used, or disclosed; 2) each category of information that is disclosed to third parties, and the purposes for which it is disclosed; and 3) the identities of those third parties to whom data is disclosed.
Purpose Specification: The notice provided to energy users must include an explicit description of: 1) each category of information collected, used, stored or disclosed by and the specific purposes for which it will be collected, stored, used, or disclosed; 2) each category of information that is disclosed to third parties, and the purposes for which it is disclosed; and 3) the identities of those third parties to whom data is disclosed.
![]() Data Minimization: Covered entities must collect, store, use, and disclose only as much covered information as is necessary to deliver electricity or for a specific other purpose authorized by the customer. In addition, the entities must maintain data only for as long as necessary or authorized by the Commission and may not disclose to an authorized third-party more data than is necessary to fulfill authorized purposes.
Data Minimization: Covered entities must collect, store, use, and disclose only as much covered information as is necessary to deliver electricity or for a specific other purpose authorized by the customer. In addition, the entities must maintain data only for as long as necessary or authorized by the Commission and may not disclose to an authorized third-party more data than is necessary to fulfill authorized purposes.
![]() Use Limitation: Utilities and third parties must use the data only for delivering power and only those other purposes specifically authorized by customers.
Use Limitation: Utilities and third parties must use the data only for delivering power and only those other purposes specifically authorized by customers.
![]() Data Quality and Integrity: Covered entities must ensure that energy data they collect, store, use, and disclose is reasonably accurate and complete or otherwise compliant with applicable rules and tariffs regarding the quality of energy usage data.
Data Quality and Integrity: Covered entities must ensure that energy data they collect, store, use, and disclose is reasonably accurate and complete or otherwise compliant with applicable rules and tariffs regarding the quality of energy usage data.
![]() Security: Covered entities must implement reasonable administrative, technical, and physical safeguards to protect covered information from unauthorized access, destruction, use, modification, or disclosure. Any security breaches involving 1,000 or more customers must be reported immediately, with annual reports of all security breaches.
Security: Covered entities must implement reasonable administrative, technical, and physical safeguards to protect covered information from unauthorized access, destruction, use, modification, or disclosure. Any security breaches involving 1,000 or more customers must be reported immediately, with annual reports of all security breaches.
![]() Accountability and Auditing: Utilities and third parties are held accountable for complying with the CPUC’s requirements and must make available upon request or audit the privacy notices that they provide to customers, their internal privacy and data security policies, and the categories and identities of agents, contractors, and other third parties to which they disclose energy data. They must also provide customers with a process for access to their data, correction of inaccurate data, and addressing customer complaints about data covered by the rules.
Accountability and Auditing: Utilities and third parties are held accountable for complying with the CPUC’s requirements and must make available upon request or audit the privacy notices that they provide to customers, their internal privacy and data security policies, and the categories and identities of agents, contractors, and other third parties to which they disclose energy data. They must also provide customers with a process for access to their data, correction of inaccurate data, and addressing customer complaints about data covered by the rules.
With this ruling, the policy for California is somewhat settled. Implementation details need to be worked out for each user scenario such as providing data to third parties.
4.2 Should Other Jurisdictions Follow California’s Example?
The California example is a good one as a base. As a general rule, it adopted existing data privacy and security laws and regulations put in place to protect other consumer data, such as financial data. The CPUC determined that there are no fundamental differences between private energy data and other sensitive data, such as telephone records or bank transactions. Where energy data is breaking new ground – in particular, the transfer of energy data to third parties authorized by consumers – the CPUC put in place protections adopted specifically for the electric and gas utility industry. The implementation on the details of third-party access is in progress in a current CPUC proceeding, with a ruling expected in 2013.
Each jurisdiction – state, province, country – will develop its own rules. For example, the U.K. is establishing policies as the deployment of smart meters commence. Another instance is the Netherlands, where data policy is ensconced in legislation that was needed to address data policy issues that arose following earlier law approving a smart meter rollout. Germany’s regulators have issued a data protection policy finalized in late 2012.
4.3 Consumer Data Privacy Concerns
While all data can be considered sensitive in some way or the other; energy consumption data is somewhat less sensitive than other consumer data already widely shared over the web or other public/private networks. Utilities have handled detailed consumption data for large industrial customers with smart meters going back more than two decades. This data is quite sensitive, because it can reveal operating schedules, relative efficiency of production facilities, and other information that can affect a company’s competitiveness. All utilities have such data and most have made it available to their large customers on line without any known issues. Utilities have used the data for their own operations, as well as shared the data with third parties with the customer’s permission.
For mass-market customers, the availability of detailed usage data is new. However, the fundamental principles remain the same. There are concerns about data privacy, because, for example, the data could reveal occupancy patterns for a premise – though smart meters cannot reveal what appliance a consumer is using, contrary to some statements in the press. Occupancy can more easily be determined by observation for a person intent on learning that information. In general, the privacy considerations for consumption data are less serious than for other consumer data, particularly banking and credit card data.
Nevertheless, the energy data privacy concerns are important and should be respected, with concomitant data protections put in place – as we have seen in California.
5 Results of Customer Pilots and Programs
A recent meta analysis of 100 pilot programs broken down into 460 sub-pilots – with 74 focused on energy information feedback – provided extensive detail on the level and scope of consumer response to detailed energy information. The display of almost real-time energy consumption data on in-home devices (IHDs) led on average to an 8.7 percent reduction in energy consumption.17 Lower but still significant reductions of 5 to 6 percent on average were achieved through enhanced, more informative bills and access to usage data on websites.18
5.1 Research Methodology
The aim of the research was to discover the potential and limitations of a range of feedback and dynamic pricing programs enabled through smart grid technologies, including smart meters. The findings and conclusions based on a large pool of pilots are designed to gauge repeated results and surrounding requirements for successful implementation by other utilities.
Pilot organizers usually form sub-groups within their pool of participants and try different solutions with different groups. A typical case would be to measure the response of participants when given an IHD and when given detailed informative bills. We call “samples” these sub-groups within a pilot. Impacts of trials on individual samples were not calculated. Instead they were calculated and reported by the pilot organizers in their final reports, academic papers and presentations. These were collected for impacts reported with statistically significant results at a 90 percent confidence level and above. This review took the mean of the individual impacts in order to understand what the key determinants of successful pilots were. The mean impacts were calculated by averaging the individual impacts on each sample with each sample equally weighted.
5.2 Research Samples and Data
The research involved collecting and comparing about 100 pilots. Typically, organizers divide participants in a pilot into sub-groups in order to test different solutions, for instance different feedback types, different dynamic pricing schemes, a group with home automation and one without, etc. Hence, the pilots were broken down into 460 samples. The samples were then analyzed according to 22 different variables selected to gauge internal structural pilot variables influencing success as well as outside market factors that might also affect a pilot outcome. In all, over 450,000 residential consumers were involved in the reviewed pilots. Feedback pilots are designed to help participants reduce their overall energy consumption, lowering distribution and supply costs.
A total of 74 information feedback trials were analyzed during this research. The sample comprised 290,000 residential households from five regions; Australia (3 samples), Canada (12 samples), Europe (35 samples), Japan (3 samples), and the United States (21 samples). The majority of the pilots from Europe were conducted in Great Britain. Over 60 percent of the pilots took place within the last ten years and almost half after 2005.
5.3 Feedback Methods
The pilots analyzed in the research tested three main types of energy information feedback.
IHDs are displays that hang on the wall or sit on a counter and provide near real-time information about household electricity consumption. They also provide a variety of other data. For example, the display provided in the “Electricity Smart Metering Customer Behavior Trials” (see Figure 21.1) allows people to set daily budgets for how much they want to spend, informs them of their success, what the current price of electricity is, and provides information on how much they have spent so far this month. The home screen for the dynamic display unit is the key screen that the customer sees when the device is switched on, while further information can be gained if desired by navigating to other screens.
Importantly, there is significant discussion about the value and role of specialized IHDs. Some industry researchers believe real-time energy information will show up on smart phones:
…some smart grid technology vendors are getting out of the home display/hardware business because they anticipate that people will be able to use apps on smart phones (as well as controlling in-home devices through Internet-ready televisions) to program in-home devices, set trigger prices and set-point temperatures, and change those settings remotely if necessary. Home energy apps will be sufficiently powerful and flexible, and Internet connectivity will be sufficiently ubiquitous, that they are likely to be attractive to homeowners for home energy management and automation.19
Given that people are relying more and more on their smart phones, this vision appears likely to materialize.
Websites offer an alternative way to provide the consumer with information about their electricity consumption. As noted earlier in this chapter, websites are complementary to real-time displays by providing other information. The websites considered in the analysis rely on smart meters to collect the necessary consumption data and therefore the granularity of data provided to consumers depends largely on how often the meters are read or how often the information is transferred from the meter to the utility (or retailer). The standard frequency for the pilots was to have the information – typically hourly or quarter-hourly intervals – sent in a packet from the meter to the utility once a day.
The third category is called “informative billing.” Informative billing is an example of indirect feedback. Most residential consumers in Europe now receive estimated bills that are adjusted for the time of year and the household’s average consumption. They therefore do not accurately reflect the actual usage for a given month. The difference between the estimated average consumption and the actual usage is made up at the end of the year or when a resident changes electricity supplier.
Informative billing follows the typical U.S. practice by issuing a monthly invoice for the actual consumption and provides either historical information comparing what the customer used this month to last month or to last year during the same period. The bill may also provide information on how much the household consumed in comparison to other dwellings of the same description.
5.4 Feedback Content
For the pilots included in the analysis, information about consumption presented in the different feedback programs typically had one or several of the following content types:
![]() Peer Comparison: Comparison of household energy consumption levels between participants and similar-sized households. It enables participants to see if they use more or less electricity than their peers. (See chapter by Laskey et al for further discussion of such comparisons.)
Peer Comparison: Comparison of household energy consumption levels between participants and similar-sized households. It enables participants to see if they use more or less electricity than their peers. (See chapter by Laskey et al for further discussion of such comparisons.)
![]() Price of Electricity: The current price of electricity per kWh.
Price of Electricity: The current price of electricity per kWh.
![]() Historical Comparison: The household’s current electricity consumption levels in comparison to pre-pilot consumption levels. Participants can see if they reduced or increased their consumption compared to the same period last year.
Historical Comparison: The household’s current electricity consumption levels in comparison to pre-pilot consumption levels. Participants can see if they reduced or increased their consumption compared to the same period last year.
![]() Disaggregation of Consumption: The household’s electricity consumption is broken down as per household electrical appliances based on the consumer inputting information about the appliances in the home. The depth and degree of the breakdown can vary but in most cases the consumption of the oven, the fridge, the TV, and the lighting are estimated. It enables participants to see how much electricity individual appliances use and act upon it (and perhaps buy more energy efficient ones).
Disaggregation of Consumption: The household’s electricity consumption is broken down as per household electrical appliances based on the consumer inputting information about the appliances in the home. The depth and degree of the breakdown can vary but in most cases the consumption of the oven, the fridge, the TV, and the lighting are estimated. It enables participants to see how much electricity individual appliances use and act upon it (and perhaps buy more energy efficient ones).
![]() Bill-to-date Consumption: The current up-to-date consumption level of the household in kWh.
Bill-to-date Consumption: The current up-to-date consumption level of the household in kWh.
![]() Bill-to-date Cost: The current up-to-date bill in currency units.
Bill-to-date Cost: The current up-to-date bill in currency units.
![]() Savings Compared to Previous Periods: Compares the energy savings of households to previous periods.
Savings Compared to Previous Periods: Compares the energy savings of households to previous periods.
![]() Environment (CO2 emissions): The amount of CO2 emissions caused by the household due to electricity consumption.
Environment (CO2 emissions): The amount of CO2 emissions caused by the household due to electricity consumption.
5.5 Research Results
Figure 21.6 shows the energy conservation results for different types of feedback. Customers with an IHD had the highest response, with average energy savings of 8.7 percent. The remaining channels for feedback; webpage, and informative billing; produced almost equal consumption reduction levels and in some cases they were used in combination. A key benefit of IHD seems to be the “almost real-time” aspect which enables participants to link their actions to their energy usage practically in real-time.
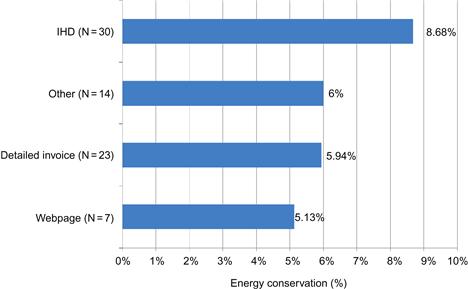
Figure 21.6 Energy conservation associated with different types of feedback, based on meta analysis of 74 pilot programs.20
Program results are reported as a percentage reduction of kWh consumption by the household.
Program success of pilots/trials is directly dependent on consumer involvement, and research findings indicate that “more is more” at every stage of the piloting and roll out process. For example, programs using consumer segmentation to create directed marketing campaigns for a particular consumer groups, increase consumer uptake and results. In the program structure, feedback and dynamic pricing used together tend to achieve better long-term overall results than either program type alone. Education improves dynamic pricing and informative billing programs. Multiple types of information on a display or a bill (current consumption, price, historical consumption, etc.) tend to achieve higher results than a display or a bill with only one message.
5.6 Extrapolating the Results of the Meta Analysis
The findings in Figure 21.6 reflect the average reductions made by the participants in the pilots. What they do not quantify is the potential reductions if the feedback were introduced into an entire population, something that has happened with website feedback in California and Texas. When a utility launches an offering into a market, the level of energy consumption reductions made will depend heavily on the number of people who become engaged with the program – in other words, on the uptake rate. For example, a 10 percent electricity consumption reduction by 1 percent of the population will lead to a 0.1 percent total reduction, whereas a 10 percent electricity consumption reduction by 100 percent of the population will lead to a 10 percent total reduction. Potential program uptake can be estimated by the percentage of people who are willing to take part in the pilot. If this number is high, say around 30 percent, as it was the case in the CER pilot in Ireland, a national rollout of a similar program is also likely to gain good customer support.22
The fact that uptake plays such a definitive role in program success highlights the importance of marketing and consumer education. It also can mean that low technology programs, such as informative bills which reach everyone, can have similar or better results to high technology solutions, such as home automation or displays, if these interest only a small percentage of the population. In this case, a range of appropriate feedback choices for differing consumer groups is optimal.
6 Conclusions
Energy users need three things to maximize their ability to save energy and money on their electricity bills: the consumer empowerment triad of information, pricing options, and automation (see Figure 21.7). Information – to provide understanding – is first among these equals and the starting point for intelligent efficiency. Time-based pricing provides additional financial incentive to lower peaks, and automation allows for “set-and-forget” energy management in our busy world. But information remains the key to all of these.
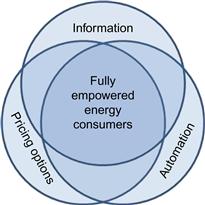
Figure 21.7 Energy feedback information is the first among equals in the consumer empowerment triad that allows maximization of energy saving and management benefits.21
As we look forward, it is essential to keep in mind that while energy information is the “what,” the “how” is just as important. The analysis of the pilots showed that, if customers do not find a program interesting, accessible and attractive, it will fail. This is equally true for every type of smart grid program. Customer segmentation offers utilities and technology providers the opportunity to study which customer groups are reacting best and how programs could be improved during rollout. This knowledge can then be used to create messages and material that have a direct and central impact on the number of consumers who successfully engage with a program in a given market.
Education should be included within all consumer energy initiatives. Providing detailed usage feedback supercharges dynamic pricing programs, especially those involving automation, as it helps to decrease total consumption rather than only peak consumption. By itself, usage feedback offers the opportunity to achieve billions of dollars in energy savings every year; leveraging information with dynamic pricing and automation could triple those savings, according to McKinsey and Co. – potentially to $59 billion per year in the United States.23
1VaasaETT, “Empower Demand,” October 2011. Also see Footnote 18.
2Energy Information Administration, U.S. Department of Energy, “Electric Power Monthly,” April 2012.
3American Council for an Energy Efficient Economy, “A Defining Framework for Intelligent Efficiency,” June 2012.
4U.S. Department of Energy at http://www.eia.gov/emeu/efficiency/definition.htm
5California Energy Commission, “Building Energy Efficiency Standards,” December 2008.
6Commission for Energy Regulation, “Electricity Smart Metering Customer Behaviors Trials Findings Report, May 2011.
7“Decision Adopting Rules to Protect the Privacy and Security of the Electricity Usage Data of the Customers of Pacific Gas and Electric Company, Southern California Edison Company, and San Diego Gas & Electric Company,” D.11-07-056, California Public Utilities Commission, July 29, 2011.
8VaasaETT, op. cit.
9Daily data retrieval of smart meter data is the de facto standard in North America, the UK, Australia, and New Zealand. Most European utilities, including those in Italy and Scandinavia, typically read their smart meters only once a month.
10In many U.S. states, customers have tiered electricity prices. For these tariffs, the first block of usage each month – say 400 kWh – is at one price, while usage above that has a higher price. Some states have as many as five price tiers, though two tiers is most common.
11Pacific Gas & Electric Company, “White House Challenge Met: PG&E’s Green Button Now Live,” January 2012 at http://www.pgecurrents.com/2012/01/18/white-house-challenge-met-pges-green-button-now-live/
12http://www.nist.gov/smartgrid/sgip-072611.cfm
13Executive Office of the U.S. President, “New Industry Commitments to Give Over 3 Million New Households and Businesses Tools to Shrink Their Energy Bills,” May 2012, at http://www.whitehouse.gov/sites/default/files/microsites/ostp/green_button_release_2012_05_02.pdf
14GreenTech Grid, “Green Button Apps: How Innovative Are They?,” May 2012, at http://www.greentechmedia.com/articles/read/green-button-apps-55-and-counting/
15Congressional Research Service: The Smart Grid and Cybersecurity – Regulatory Policies and Issues, Richard J Campbell June 15, 2011.
16NRRI, “Smart Grid Data: Must There Be Conflict Between Energy Management and Consumer Privacy?” December 2010.
17VaasaETT, op. cit.
18It is important to note that during a national or regional program rollout not all consumers will be willing to engage with feedback and therefore the total energy reductions will be dependent on the level of regional consumer uptake and engagement with the program.
19Lynne Kiesling, “Dematerialization, smart phones, and smart grid,” June 2012, at http://knowledgeproblem.com/
20VaasaETT, op. cit.
21VaasaETT, op. cit.
22During rollout, success can be utility dependent. Some utilities have simply been better than others at communicating and marketing pricing programs to their customers and will succeed better with the same offering in the same market than their competitors. Salt River Program, for example, has achieved a participation rate of over a third in its time-of-use rate program; see Association for Demand Response and Smart Grid, “The Persistence of Consumer Choice,” June 2012.
23“U.S. smart grid value at stake: The $130 billion question,” Summer 2010.