
Carpe Diem – Why Retail Electricity Pricing must Change Now
Allan Schurr1 and Steven Hauser2, 1IBM, 2New West Technologies
1 Introduction
A few months before the U.S. Continental Congress approved the Declaration of Independence (July 4, 1776), a little known Scottish philosopher published a book titled An Inquiry into the Nature and Causes of the Wealth of Nations. This now famous book and its author, Adam Smith, described the concepts on which we have built our modern economy. Smith’s statement “consumption is the sole end and purpose of all production” became the root of what we now commonly refer to as “supply and demand” where the science and mysteries of balancing the two drive successful businesses.
For the past century, no industry has embraced and exploited these concepts more than the electric utility industry, building a massive and complex infrastructure for delivering power to homes and businesses around the world. With rapidly increasing demand throughout most of that century, business models were created that assured adequate supply at a reasonable cost to consumers. Over the past decade, as the growth in demand has leveled and in some cases even decreased, utilities have begun to explore new ways of achieving the supply/demand balance.
Electric utilities, as is common for companies that depend on large capital investments, are a mostly fixed cost industry with a modestly rising cost structure for labor, materials, and compliance. Reductions, however, in expected demand and sales growth due to energy efficiency, self-generation, and economic dislocation threatens the core assumption of the historic regulated utility monopoly model. These reductions, while non-uniform, are nonetheless a secular trend in most of the OECD countries and will eventually result in fundamental policy and business model changes for this important infrastructure.
Different jurisdictions have begun to experiment with changes in the traditional business models by passing along certain variable costs directly to consumers; for example, an automatic fuel adjustment as input fuel prices fluctuate. But progress has been inconsistent and too timid to balance long-term goals of security of supply and infrastructure adequacy, environmental compliance, and price competitiveness.
During the expected long transition to achieving this balance, the traditional utility operational model will in the meantime, result in strong pressure on managers to reduce operating costs and on regulators to approve prudent costs over fewer units of sales. This “business as usual” approach will slowly raise prices so that a dilemma emerges:
![]() Do utilities recover prudent costs in a highly fixed asset business by increasing variable prices, which drives lower sales growth though encouraging core efficiency and self-generation? or
Do utilities recover prudent costs in a highly fixed asset business by increasing variable prices, which drives lower sales growth though encouraging core efficiency and self-generation? or
![]() Do they restructure pricing to create more accurate market signals for the core utility components of energy production and delivery?
Do they restructure pricing to create more accurate market signals for the core utility components of energy production and delivery?
This chapter will argue that in the long run, utility leaders will make required production and delivery investments only if marginal prices are accurate and if customer decisions to reduce consumption are based on true avoided costs that minimize cost shifting. To achieve this balance, pricing reform is needed now.
The system today encourages energy efficiency and self-generation through a somewhat distorted pricing structure. For example, a solar system supplying 100 percent of the energy for a home or business, served via net metering arrangement, may have a zero cost bill, but still relies on the grid for off-hour energy and capacity. These “zero net energy” homes, as described by Rocky Mountain Institute’s recent report on the subject, create complex value streams and cost shifting [1]. In the example here, all other customers end up paying for this solar customer’s “free” grid support, but may still enjoy the environmental benefits. Likewise, a business using 20 percent less energy than her next-door competitor may nevertheless induce substantially the same delivery costs on the grid. This paradigm is not sustainable from a cost standpoint in the midst of rapid adoption of alternatives to traditional electricity supply of historic volumes.
In response, utilities may delay the onset of the most challenging regulatory decisions around cost allocation by pursuing dramatic cost reductions to maintain cash flows. Or they may find other stop-gap measures, like new product and service revenues, to postpone the time when financial pressures become too high to ignore the need for more fundamental reform. The long-term trends are inevitable, however, and indeed it is desirable now, due to unique economic and political factors, to address this revenue model challenge with regulators.
The timing to address such a shift in the cost recovery model is propitious, in the U.S. market particularly, inasmuch as any changes to consumers’ bills over the next few years can be ameliorated by the historically low cost of natural gas. Utilities that act to resolve this dilemma now will enjoy comparative financial success over the long term as their peer group attempts what will surely be an increasingly challenging environment for structural change in the years to come.
This chapter will address these complex issues by providing an overview of the expected changes in the demand for electricity in sections 2 and 3. Section 4 provides specific examples of how these issues are being addressed by the industry. Section 5 outlines possible industry responses and suggests utilities take advantage of this window of opportunity to address structural pricing changes, since some options will merely postpone the inevitable financial impact of demand growth slowdown. Conclusions are drawn in section 6.
2 Breaking the Addiction to Electricity
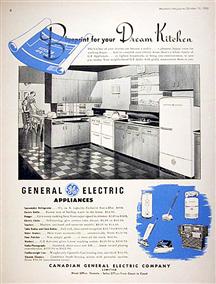
Many of us who were born in the 1950s or before remember the day that our mothers began using their first electric washing machine, maybe even the first refrigerator. Soon after came a television, a vacuum cleaner, a toaster, a range/oven, and so on. The marketing of new electric appliances was prolific in newspapers, magazines, radio and television even challenging us to “dream” about all the possible conveniences, as shown in the typical 1950 GE advertisement in Figure 4.1. Often local utilities were complicit with appliance manufacturers, supporting and even leading marketing campaigns. In most cases it wasn’t a hard sell, providing high value to customers in convenience, safety, health, and pleasure. “More time to play” was an often-used phrase promoting the time-saving nature of many of the devices. Implied, of course, but generally ignored or not understood, was how much electricity that was required to operate the device. Hans Rosling does an excellent job portraying this radical lifestyle change brought about by electricity.1 This lifestyle is one that few of us would relinquish or even slightly modify today. While for many of us in developed countries these changes started more than a half century ago, for much of the world these changes are still yet to take place.
Our workplaces went through a similar transformation with large buildings requiring significant artificial lighting and increased amounts of cooling. Productivity grew rapidly starting with electric typewriters and evolving to massively complex computers and networks, moving information at enormously greater speeds, quantities, and distances. Overall, demand for electricity was growing at a fast pace and utilities were challenged to build more and more power plants and delivery infrastructure to keep pace with the demand.
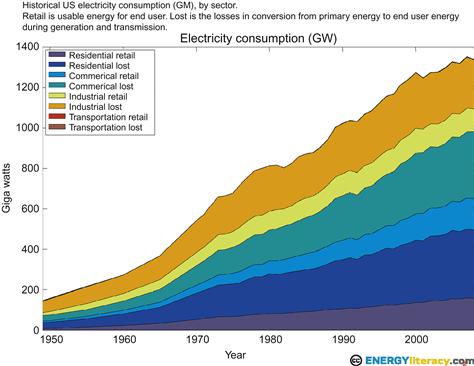
Figure 4.2 shows the growth in electricity supply from 1950 forward. Federal and state regulations ensured that no matter where, when, and how much electricity consumers wanted, the utility infrastructure would be ready and able to supply it. Utilities built very successful businesses providing this electricity across the United States and in many other countries in the world. Both federal and state regulators worked closely with the industry to ensure reasonable business decisions resulting in electricity consumers could afford, driving our economy forward. When needed, they worked through major and minor disruptions, making adjustments to the successful model to minimize impacts to consumers.
By the early 1970s, this growth in the demand for electricity began to concern some because of the potential for huge environmental impacts as well as the growing need to import energy resources. As discussed by Sioshansi in the introduction to this book, several pioneers took on the challenge of both understanding the fundamentals of electricity use and began to develop ideas that showed how consumers could continue to avail themselves of the services that electricity provided while actually reducing the amount of electricity required for these services.
Figure 4.3 shows the historical and projected growth rates in electricity demand in the United States. While these rates were highest in the 1950s, technology improvements along with market saturation have continued to slow the growth in demand to the point where experts are now predicting less than 1 percent growth in electricity demand for the decades ahead. For example, technology improvements have substantially decreased the amount of electricity used in a typical refrigerator. In 1980, the typical household refrigerator was about 20 cu. ft. and consumed nearly 1300 Kwh/year. Today the typical refrigerator is over 22 cu. ft. and consumes less than 500 Kwh/year; the same or better “service” using less electricity. Nilleson et al further describe the global experiences in these advances.

Figure 4.3 Electricity Demand Growth Rates (Annual Percent Change) 1950–2035. Source: EIA, Annual Energy Outlook 2011.
The real question is whether growth will continue or whether a combination of technology and market forces will reduce existing demand sufficient to offset any new growth. Certainly examples abound, like those described in Australia by Smith. The Energy Information Administration compares the growth in electricity consumption compared to real GDP for the United States from 1980 to 2010 (Figure 4.4). This shows that starting in the mid-1990s, growth in the U.S. economy is becoming less and less dependent on electricity production. Their projections in Figure 4.3 indicate an assumption that a small link between economic growth and electricity still exists, but the projected constant 1 percent growth in electricity demand is likely more based on assumption than fact.

Figure 4.4 Growth Rates of CO2 Emissions, Electricity Generation and Real GDP Compared. Source: EIA, Annual Energy Outlook 2010.
A recent report by the American Council for an Energy Efficient Economy [2] examines the potential for a reduction in electricity consumption between 2010 and 2050. They assume continued strong economic growth of 2.8 percent per year resulting in a tripling of the U.S. GDP over the 40-year period. As a reference case they used the EIA growth projections in electricity consumption on a largely business as usual scenario resulting in an increase of about 25 percent in electricity demand in 2050. They then looked at two scenarios they called Advanced and Phoenix. The Advanced Scenario assumed that current and near commercial technologies available today are deployed throughout the residential, commercial, and industrial sectors. In other words, no technology R&D or breakthroughs are required. The resulting energy efficiency reduces the amount of electricity required by about 25 percent (translating to a 0.8 percent per year real decline in electricity demand).
The Phoenix scenario is a bit more aggressive, assuming, for example, that the average sq. ft. per home in the United States declines slightly between now and 2050. The resulting decrease in electricity demand in 2050 is over 40 percent. The reduction in this scenario is still based on available technologies but assumes faster and deeper penetration. Laitner et al also make similar arguments in their chapter.
Recent advances in smart grid technologies are rapidly becoming a key enabler of energy efficiency by engaging consumers in new and much more effective ways. Laitner presents an elegant analysis of the impact that semiconductor-based technologies have had on the U.S. economy in the last 40 years and projects an even greater impact going forward. He projects, for example, that between 2010 and 2030 that semiconductor-enabled efficiency can reduce electricity consumption by more than 20 percent [3].
While predicting the future is always difficult, the average growth in electricity demand in the United States is most likely to range between a 1 percent per year increase to a 1 percent per year decrease. Of course, this will vary significantly between regions, states, and even cities. Nadel summarizes the variations by state and highlights states where recent policy changes have accelerated the growth in energy efficiency programs and the resulting reduction in electricity demand. While a decade ago, energy efficiency was largely focused in a few states and utilities, programs now are sprinkled around the country. California has always been thought of as the leader in this endeavor, and they certainly can rightly claim the role of pioneer, but as Nadel shows, other states like Vermont, Nevada, Hawaii, Rhode Island, Minnesota, and Iowa are now ahead of California in the percentage of reduction in electricity due to energy efficiency programs. To make the point about the widespread nature of energy efficiency investments, even utilities like Oklahoma Gas and Electric have launched aggressive demand reduction programs that will help them defer the need to build new generation for the next decade or beyond.
3 Self-Generation Becomes the Norm
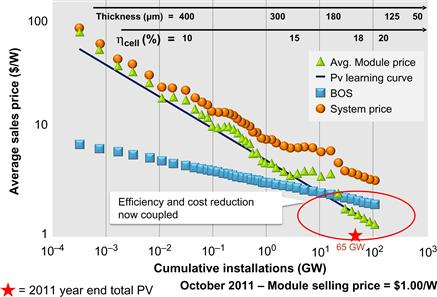
Driven recently by renewable portfolio standards and generous incentives such as feed-in tariffs and net metering, rooftop solar systems for both residential and commercial applications have dramatically increased in count. This growth in the market for such systems combined with innovative manufacturing and reductions in the price of silicon has continued to push down the cost of solar panels. Figure 4.5 shows both the increase in sales and the decrease in cost, depicting the correlation between the two and indicating the continued potential for further cost reductions. These cost reductions are difficult to forecast, but still highly likely as described in the current Department of Energy “Sunshot” initiative where costs for PV systems are expected to reach grid parity (without subsidy) by the end of this decade [4].
The southwest U.S. is experiencing high growth rates in rooftop solar systems2 with San Diego, Phoenix, and Las Vegas leading the way. Some newer housing developments have rooftop PV on every home, resulting in 20 percent or more of the electricity for that neighborhood being supplied by self-generation. While extremely low natural gas prices may slow the growth, it is a trend that will continue especially as solar prices continue to fall.
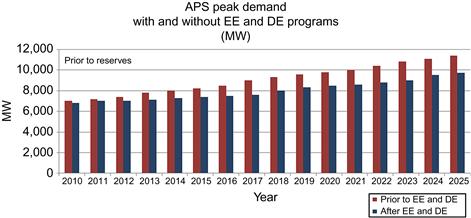
A 2010 analysis by Arizona Public Service shows (Figure 4.6) that nearly half of the expected growth in electricity demand by 2025 will be met by energy efficiency (EE) and distributed energy (DE) resources. Germany has clearly demonstrated the feasibility of very large percentages of solar power reaching nearly 50 percent of the total electricity generated in a May 2012 two-day period.3
While electricity storage is still too expensive to allow consumers to totally disconnect from the grid in most situations, the cost of storage is projected to come down over the next several years motivating even more self-generation. Current grid-connected systems rely extensively on local distribution grids to supply power when the sun doesn’t shine, at night and during maintenance events. Utilities are beginning to charge consumers additional fees for “leaning” on the grid with their own generation. As these fees become more widespread, they will provide additional incentives for consumers to add storage and permanently disconnect.
This is the key issue: consumers use less grid-generated electricity while exerting increased stress on the grid to keep themselves supplied when they need it. Existing pricing structures result in cost shifting and underfunding of needed operations and investments.
Certain communities, especially where the price of utility-supplied electricity is very high, are focused on maximizing both energy efficiency and self-generation. The Vineyard Energy Project on Martha’s Vineyard is an example where a variety of smart grid projects, energy efficiency, and local renewable energy will help them achieve their long-term goal of operating an independent power grid, fueled by local renewable energy.4
With natural gas prices in the United States at historic lows, many commercial and industrial consumers are considering generating their own power using small- and medium-sized high-efficiency turbines. These systems can provide local, reliable, and inexpensive electricity, especially when combined with productively using the waste heat, improving power quality and availability, and displacing utility-generated electricity that must be transported long distances or through congested transmission and distribution lines. Commonly referred to as cogeneration or combined heat and power (CHP), these systems are well understood and very dependable.
A report by the Oak Ridge National Laboratory [5] suggests that with pro-CHP policies, the United States could generate 240GW or 20 percent of its electricity needs from CHP systems by 2030. This equates to three times the current amount of CHP in the United States, but roughly equivalent by percentage to what is already done in Europe. Combined with new microgrid control systems that allow users to optimize the integration of multiple supply options (e.g., solar PV and CHP) with demand management, these self-generation options may become a preferred strategy for many companies. If these new CHP systems were built and operated by local utilities, they could add instead of subtract from revenues, but this would require new business models for most utilities.
As a case study in what is occurring in practice, Portland General Electric is profiled as to their energy sales outlook, their business strategy regarding promoting energy efficiency, and their current revenue model.
3.1 Portland General Electric Viewpoint
Portland General Electric (PGE) is a vertically-integrated electric utility serving the Portland Oregon metropolitan area. It has approximately 822,000 customers and $1.7B in annual revenues. Its energy supply mix is comprised of coal, natural gas, hydroelectric, wind, and outside purchases. Retail rates range from $0.109/kWh for residential to $0.062/kWh for industrial customers.
According to Jim Piro, CEO, the combination of relatively strong economic growth, its low-cost generation portfolio, and appropriate regulatory recovery mechanisms means that PGE’s customers and shareholders are well positioned even as energy efficiency grows its already strong role in the resource mix of this utility [7].
PGE estimates load growth of 2.3 percent, with energy efficiency offsetting about half of that in the near term (Figure 4.7). The expected load growth is dominated by industrial load growth from the technology sector (e.g., Intel) in the PGE service area. Commercial and residential rooftop solar PV is growing but is seriously limited by a limited number of rooftops with good solar insolation. Portland is one of the leading cities for electric vehicle adoption, and PGE estimates that its system is capable of supporting up to 50 MW additional sales from plug-in electric vehicles over the next 10 years. The impact of self-generation is expected to be largely offset by new load.
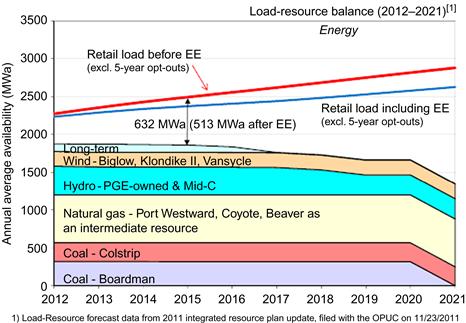
Figure 4.7 Portland General Electric IRP Resource Outlook [6].
Since Oregon regulators approved revenue decoupling for residential and small commercial energy sales, after adjustments for weather, the net revenue effect of energy efficiency driven sales and demand reductions is minimized. In addition, revenue adjustment for outside power purchases and fuel costs are addressed outside of general rate cases allowing for more timely collection of revenues with a mitigating effect on volume and price risk in wholesale generation.
Additionally, to ensure competitive financial returns and avoid unnecessary rate impacts, PGE is in the midst of an operations and maintenance (O&M) expense productivity program timed to coincide with its anticipated worker retirement over the next several years. All operating areas are first benchmarked against industry best practices and then investments are prioritized to target highest impact improvements. Even with this aggressive program, PGE projects approximately 1 percent/year growth in the cost of O&M.
As Jim Piro sees it, citing the impressive efficiency plans of a local grocery chain, energy efficiency is good for customers’ competitiveness and an important element of the regional energy mix. PGE even collects funds for Energy Trust of Oregon (ETO) and other organizations, anticipated to be nearly $90 M in 2012, for use in implementing energy efficiency programs and other public purpose activities in the PGE service area. Energy efficiency is just part of the business landscape for PGE.
3.2 Raymond Gifford Viewpoint (Former Chairman of the Colorado Public Utility Commission)
Of the several possible regulatory responses, the experience of the 1980 and 1990s era telecommunications analog is instructive. Former Colorado PUC Chair Raymond Gifford offers his thoughts on applying this experience to energy. Chairman Gifford describes the critical need for regulators and utilities to come together in a new compact that encourages both cost and service innovations and pricing structures that do not shift costs to one group from another based solely on the former’s lack of participation in energy efficiency or self-generation [8].
According to Gifford, one key to that result is a state regulatory model that saw great success in the telecom business. Known as “price cap” regulation, the construct is that a revenue requirement and resulting price is set for several years, often 7 or more, less a stipulated productivity factor that reduces the price each year from the prior year. The consumer sees reduced costs, and the utility can benefit from accelerated productivity investments. An additional feature of this scheme is that utilities also get authorization and pricing latitude for certain quasi-regulated services. In the telecom case, these were calling features like caller ID, voicemail, three-way calling, and call forwarding. All of these are considered optional services, but which can be marketed and delivered by the incumbent utility, thus increasing revenue and margin further.
Gifford is not very optimistic that such a new model applied to energy utilities will come easily. Regulators are not likely to lead in this regard, and utilities are not known for proposing innovative regulation until the existing model is not yielding favorable returns. Inasmuch as utilities are seeing only minor sales growth erosion and many have expectations that sales will return to pre-recession level soon, they are reluctant to propose something that does not yet have an experience curve in the energy utilities space.
4 Industry Implications
While some electricity sales reductions are operationally beneficial if they occur during the coincident peak, most mechanisms for sales growth reductions are not so well integrated into utility capacity planning as to result in much if any avoided cost. Except for utilizing the marginal peaking generation resources, substations have the same equipment, trees still fall across overhead pole lines and cause outages, consumption is measured, and bills are sent. Only reliable and persistent demand response resources have both an immediate and long-term cost avoidance opportunity. These phenomena come from the modern utility industry model, which was conceived and deployed around the three pillars of increasing load growth, declining marginal costs, and cost-of-service price regulation. When one or more of these three pillars erodes, the economic underpinnings of the system become imbalanced. In addition to the sales growth reduction from energy efficiency and self-generation, the other two pillars are under challenge too.
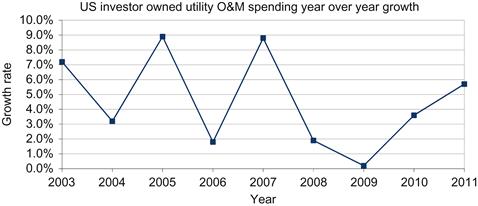
O&M costs have been rising faster than inflation for much of the past decade. Materials have been impacted by global economic growth, and commodity labor prices continue to rise. The Edison Electric Institute reports that O&M expenses for its investor-owned utility members grew an average of 4.6 percent from 2003 to 2011, with some volatility due to M&A accounting and a dip in 2008 due to the recession [9,10]. Generation construction prices have also increased during this time due to high costs of materials, permitting, and labor. Fortunately, in the United States, natural gas prices in summer and Fall of 2012 are between $2–3 MMBtu, which mitigates the total cost of energy in most markets. Many experts believe these low prices will persist for many years to come.
The regulated monopoly behind cost-of-service ratemaking is also beginning to unravel at the seams.
First, in many markets, social spending in the form of low-income service, renewable feed in tariffs, energy efficiency investments, and economic development programs all serve to increase the overall revenue requirement above the basic cost-of-service.
Secondly, rate design is yet another policy decision that can skew the price signal of marginal cost of energy and the associated investment return of energy efficiency or self-generation. For example, in markets like California, significantly differentiated tiered pricing places the prices for the highest tiers at multiples above the lowest tier to encourage such energy efficiency and self-generation options.
Finally, the presence of regulatory compensation or performance incentive schemes that reduce the harm from sales erosion on the investment and operating decisions made by utilities is a factor in the financial stability and investment attractiveness in utility companies.
In the long run, a sustainable energy infrastructure will only emerge from the reassessment and the replacement of these three elements with a coherent system of consumer price structures that reflect the short run and long run marginal price of a unit of electricity.
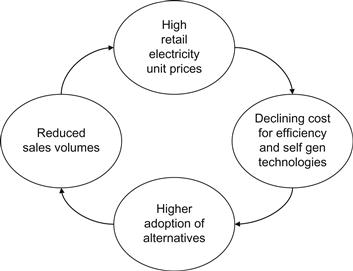
The need to achieve this sustainable financial structure is apparent. The positive feedback loops of high avoided unit prices, reduced cost of alternatives to utility supply, and supported social policy spending will most likely accelerate these trends toward more energy efficiency and self-generation. In the limit, non-participating consumers will pay more for the basic commodity service or utilities will see diminished financial returns that raise the cost of capital, and thus rates, as investors evaluate the prospects of earnings, cash flow, and risk.
5 Possible Responses
Addressing the cycle in Figure 4.9 can take many forms. The best and most efficient way of addressing this cycle are structural pricing changes that would give the accurate market signals for both capacity and energy, but these may be the most politically difficult due to the elimination of certain intra-class subsidies and the resulting bill impacts.
Less structural in nature and less efficient in result, energy efficiency incentive and sales decoupling mechanisms, currently implemented in various states, can partially offset the financial downside to the utility of lost sales and revenues. Also, aggressive productivity and cost reduction programs can help maintain financial performance by mitigating some of the intra-class pricing increases from any structural price changes. And finally, some utilities are hedging these effects by creating plans for energy services offerings that can yield new revenue streams.
Tailored to local conditions, all these steps should be pursued as a portfolio of responses to the fundamental challenge to the financial integrity of utility providers and to support a long-term investment climate in low-cost and reliable energy service.
5.1 Regulatory
Given the strong role of regulation in the utility industry, it would seem that a response from local and national regulators to this slower sales growth condition would be logical. Mixed objectives, however, make these regulatory adjustments difficult to implement given the many stakeholder positions. The most efficient approach in the long run is one where all parties – utilities, customers, and new entrants – make rational investment decisions based on avoided costs or expected gain. Parties may disagree as to the appeal of each, but there are three obvious and necessary regulatory adjustments.
Some background on traditional ratemaking is helpful. Utilities typically aggregate their cost-of-service from generation through delivery and customer accounts, including depreciation, taxes, and financing expenses. These costs are reviewed by regulators for prudency to establish an annual revenue requirement to build and operate the system going forward. In some cases, such as the example cited above for Portland General Electric, there are automatic adjustments for fuel costs. Once the revenue requirement is established the regulator performs class allocations to residential, commercial, and industrial customers based on their share of the costs incurred.
In its most simple form, prices are then set by taking this class revenue requirement and dividing by the forecasted sales to create a volumetric unit price. It is because this last step has been simplified significantly that leads to risk in cost recovery for utilities. Notably, fixed costs are recovered through volumetric charges, leaving the risk of under collection of the cost-of-service as sales decline due to high penetration of energy efficiency and self-generation.5
In the larger commercial and industrial classes there may be a demand charge component to address the maximum rate of electricity consumed and compensate for fixed costs like generation plant, cable and poles, transformers, and metering. But the smaller commercial and residential consumers are typically charged on an all-volumetric rate. Furthermore, the time of day or day of the week when energy is consumed is often not reflected in the pricing structure for any of the classes, even though there is substantial time variation in generation costs to adequately meet peak period demand.
Therefore, the typical rate structure often obscures the true cost-of-service, and decisions to reduce consumption through efficiency or self-generation may not reduce utility costs commensurate with the reduced electricity sales. This is especially true when “net metering” or “feed-in tariffs” are in place. These two mechanisms pay the retail price or greater for electricity produced from selected renewable energy sources like solar. Yet the residual cost to serve by the utility is not reduced proportionately with the revenue reduction. Zero net energy buildings, as described by Rajkovich et al and elsewhere in the book, merely demonstrate the point. Unless the building is entirely grid independent and disconnects, there is residual cost by the utility of providing back-up electricity service, but with no revenue resulting. All volumetric pricing to recover a significant fixed cost business creates false price signals for these measures.
The three response mechanisms are marginal cost rate design, direct cost recovery, and energy efficiency performance incentives.
5.1.1 Marginal Cost Rate Design
The most economically direct mode of addressing the short-term and long-term revenue implication of sales growth erosion is utilizing cost-based pricing with rate design to reflect true marginal cost revenue collection. In other words, the marginal cost to produce and deliver a kWh is reflected in the marginal revenue collected for that same kWh. The following example is one way to address this imbalance of marginal cost-of-service matching the marginal revenue collected.
Liander in the Netherlands is a distribution system operator (DSO) in a competitive retail market structure. Energy consumers separately contract with competitive retailers for energy, usually at all volumetric pricing. But for the delivery portion of the bill, Liander has a fixed cost rate design to recover what are non-variable costs of running the distribution network. If a consumer is connected to the grid, they pay a fixed fee per month, regardless of the throughput, but as a function of amperage of the electric panel and whether it’s single-phase or three-phase service. In the 2012 tariffs, a residential customer with three-phase service between 25 and 35 amps will pay approximately $100 per month in delivery and metering costs, including taxes [11].
The Liander example is a unique case in the utility industry. In other deregulated markets, the DSO charges are still collected in mostly volumetric pricing. Other industries, however, are similarly considering capacity-pricing models, such as the broadband Internet industry that may price for maximum bandwidth provided not minutes of use or megabits of data.
Some utilities in the United States are starting to move toward a hybrid of higher fixed monthly fees to recover a portion of the fixed cost of operating the assets along with a volumetric fee that is applied to the energy consumed at that delivery point. Sacramento Municipal Utility District (SMUD), for example, recently adopted a multi-year transition to a $25/month fixed customer fee, with offsetting reductions in unit electricity prices. But regulators are reluctant to make large changes in the rate structure for fixed cost recovery pricing due to adverse bill impacts on existing low-consumption users. Any such shifts will likely happen in stages, but failure to do so will increase the prices to those customers unable to participate in energy efficiency or self-generation strategies, whatever the reason.
5.1.2 Cost Recovery and Performance Incentives
A second alterative to mitigate this revenue erosion is incentive regulation that financially rewards the utility for encouraging energy efficiency or compensates the utility for lost revenue, thus making them indifferent to or even encouraging them to promote energy efficiency in their service area. According to the U.S. EPA, numerous states have implemented these mechanisms for direct cost recovery of energy efficiency program costs, fixed cost recovery of lost revenue, and performance incentives to further promote energy efficiency [12]. These mechanisms rarely target the negative revenue effects of self-generation, however, and as pointed out at the beginning of section 5, only delay the top-line financial effect from the “non-virtuous cycle.” Indeed these incentive mechanisms result in higher costs, which create a positive feedback loop for price increases and more sales erosion.
California has had these three mechanisms in place since the 1990s. As described by Cavanaugh, all four investor owned utilities (e.g., PG&E, SCE, SDG&E, SoCal Gas) are incented to promote energy efficiency, get cost recovery for energy efficiency and distributed renewable generation programs, and are further recompensed for lost revenue through a decoupling mechanism that dates back to the 1980s.
As described by Laitner et al, Duke Energy has an approved innovative energy efficiency incentive program known as “Save a Watt” in the North Carolina market, which became effective in 2009. While controversy remains amongst various stakeholders as to the level of avoided costs, it represents a bold admission by Duke and its regulators that financial incentives matter if utility behavior is to change over a sustained period.
In anticipation of these significant changes to their sales outlook, utilities should concurrently work with regulators on implementing proper marginal costs signals and to put into place mechanisms that help recover lost short-term revenue from sales erosion. The energy efficiency incentive mechanisms have an added feature of building and maintaining utility energy end-use expertise and brand permission for future services by encouraging utilities to support energy efficiency programs directly.
5.2 Enterprise Model
Additional strategies to mitigate this lost margin that do not depend on new regulatory models should also be considered. These options, at a minimum, might reduce the financial impact due to adoption lags in these more favorable regulatory models, but also can boost returns in the short run and create greater customer value.
5.2.1 Cost Management and Productivity
Operating costs for utilities are always under the watchful eye of management. While certain back-office functions like finance, accounting, HR, and supply chain are addressed as part of an enterprise resource planning system (ERP), process standardization and new analytics are able to improve performance even further when applied to these common systems.
However, the long asset life and risk adverse culture of utilities can lead to slow adoption of other modern practices for cost management, especially in the asset management and front-office operations. Combine this under-exploited opportunity with the imperative to increase worker productivity as seasoned utilities workers face retirement and new workers take their place, and it is easy to see that cost management requires more focus than ever before. Many utilities in North America and in Europe have realized the urgency and are taking steps to re-engineer operations substantially across the value chain.
Cost management can take many forms at a utility. In the generation domain, fuel and maintenance costs are the primary opportunity areas for cost reduction. Many strategies are used to achieve these savings, including condition-based maintenance and asset management, described below, as well as fuel procurement optimization.
In the transmission and distribution assets and operations domain, a significant opportunity for both short-term and long-term cost reduction includes asset utilization, asset management, and compliance management. There are too many to mention here, but some of the more interesting that take advantage of new solutions and systems include:
![]() Mobile field workforce management is a common strategy to reduce unproductive work through better scheduling, materials and equipment integration, and work analytics.
Mobile field workforce management is a common strategy to reduce unproductive work through better scheduling, materials and equipment integration, and work analytics.
![]() Condition-based maintenance, which reduces unneeded inspection functions and relies on remote monitoring of asset health and automatically triggers repair work when specific conditions are present or anticipated.
Condition-based maintenance, which reduces unneeded inspection functions and relies on remote monitoring of asset health and automatically triggers repair work when specific conditions are present or anticipated.
![]() Increased asset utilization to reduce unnecessary capital expense by understanding asset loading, leveraging new sensors and consumption data from advanced metering infrastructure (AMI), and then more dynamically operating the network through the use of remotely-operated switches and voltage control.
Increased asset utilization to reduce unnecessary capital expense by understanding asset loading, leveraging new sensors and consumption data from advanced metering infrastructure (AMI), and then more dynamically operating the network through the use of remotely-operated switches and voltage control.
In the meter to cash domain, common cost reduction areas include meter reading, credit and collections processes, and commercial losses. While not as large as other business domains, its predominance of O&M expense makes savings here a direct and immediate impact on earnings and helps lower bills over the longer term.
For example, traditional manual meter reading is costly, and hard-to-access meters require appointments or estimated bills due to missed meter reads. Replacing electro-mechanical meters with radio accessible, solid-state meters, automated meter reading (AMR), or the more capable AMI will reduce the cost to read and improve accuracy through reduced exceptions and estimated reads.
Credit and collections is another candidate for cost efficiencies. Reducing bad debt and write-off is the primary goal by using improved credit analytics and collections process improvement. In addition, reducing the costs of establishing new service, or of managing repeat collections problems, often accompanies AMI investments via remote connect and disconnect of service.
Finally, self-service and transaction automation are emerging areas of focus. With the advent of new approaches for self-service that supplement typical utility web offerings, such as smart phones, tablets, and social media, utility customer business processes can benefit from both lower costs and higher satisfaction.
In sum, these productivity enhancements can address a moderately large spend category with cost reductions amounting to double-digit percentage improvements in overall costs.
5.2.2 New Revenues
New revenue sources are another option to mitigate the revenue loss from core utility services. Traditionally, utilities have been successful at finding opportunities in wholesale generation and trading, where excess generating or transmission capacity can be utilized to create new revenues through in-market wholesale power sales and transmission revenues.
But can new retail customer revenues streams also have a material effect in addressing sales erosion? At a minimum, there are hedging strategies that can be employed by utilities to allow them to participate in the same market trends that are slowing sales growth. For example:
In addition to the energy efficiency performance incentives described above, utilities in the United States and across Europe already have or are creating unregulated energy service companies aimed at profiting from energy efficiency and self-generation investments. For the most part, the track record in the US is either mixed or still unproven. In Europe, where market liberalization has unbundled energy retailing from the delivery function, many utility retail arms have offerings for energy efficiency, particularly targeted at larger non-residential customers. These entities will provide any of the several functions needed for market adoption such as design, procurement, installation, and financing. In the United States, there are fewer in operation, after a flurry in the later 1990s and early 2000s before many were divested or shut down. But advances in Internet-based energy monitoring and management hold promise for new penetration into the small commercial and residential market, which are being tested by many utilities against a backdrop of new offerings from telecommunication and cable TV firms.
Duke, once again, has shown a novel way to participate in the distributed generation market through a program in North Carolina that provides approximately $50 M in capital to purchase and install utility-owned distributed solar, while paying a lease fee to the building’s owner for “roof rights.” Duke earns a return on investment and avoids the loss or retail energy sales since the solar energy produced is viewed as utility generation.
Many utilities are currently considering additional participation plays including on-bill financing, combined heat and power (CHP) unregulated operations, and for-fee energy information products.
Finally, many utilities look to the growth in electrified transportation such as electric vehicles (EVs) as an offset to reduced sales. In certain markets, the forecasted energy sales to EVs can have a mitigating impact in the long run, particularly if increased sales occur in low-cost nighttime hours.
Each of these, if well executed, can serve to simultaneously hedge against sales erosion and improve the utility’s brand perception and customer satisfaction. But they require new skills in marketing, product development, and business operation that are only partially available from an incumbent resource pool.
Most importantly, these are merely short-term mitigation steps to address a long-term flaw in marginal price structures that permeate the utility ratemaking process. Absent reforms in price structure, cost reduction, and revenue improvements are insufficient to maintain the investment stream of the grid itself.
6 Conclusions
Energy efficiency and efficient distributed generation are already cost-effective investments for many, and will become increasingly so as technology developments drive cost down and innovative business models overcome other barriers to customer adoption. These favorable economics are often significantly benefited by the existing volumetric biased utility pricing structures, even though a significant amount of fixed cost is collected in these volumetric prices. Combined with variable economic growth across geographies, future sales for most utilities are expected to be flat or negative.
As this trend becomes more visible and utilities adjust their prices to slower growing sales, prices will increase to all customers as remaining and growing fixed costs are spread across fewer sales. This situation, while favorable to efficiency and renewable energy adoption, leaves non-participants with even higher bills and creates an unsustainable situation for the utility business.
Forward-thinking utilities are considering several options and some are taking aggressive action. Some options address the fixed cost recovery problem directly, while the remainder either delay the effect described above or are only partial hedges against the financial effects of decreases in revenue. The most successful utilities will be those that address the long-term structural cost recovery problems head-on with their regulator. Their own long-term viability is at stake.
A bright spot in this dilemma is that natural gas prices are at historic lows in real terms and the resulting negative pressure on prices affords both regulators and utilities alike a short window of opportunity to put into motion structural fixes that address customer equity and ensures reliable infrastructure built on competitive investor returns.
References
1. Rocky Mountain Institute, Net Energy Metering, Zero Energy and the Distributed Energy Resource Future, March 2012.
2. Laitner et al. The Long-term Energy Efficiency Potential: What the Evidence Suggests ACEEE Report number E121 January 2012.
3. Laitner et al. Semiconductor Technologies: The Potential to Revolutionize U.S. Energy Productivity, ACEEE Report number E094 May 2009.
4. Sunshot Vision Study DOE/GO-102012-3037 February 2012.
5. Shipley et al. Combined Heat and Power: Effective Energy Solutions for a Sustainable Future. Oak Ridge National Laboratory report number TM-2008/224; December 2008.
6. Portland General Electric, Investor Presentation, Williams Capital Group March 22, 2012.
7. Interview, Jim Piro, CEO Portland General Electric; April 27, 2012.
8. Interview, Raymond Gifford, Former chair Colorado Public Utilities Commission; May 2, 2012.
9. Edison Electric Institute, Industry Financial Review; 2010.
10. Edison Electric Institute, Industry Financial Review; 2011.
11. Elektrciteit Tarieven, Stedin.net; 2012.
12. Aligning Utility Incentives with Investment in Energy Efficiency, U.S. Environmental Protection Agency, Office and Air and Radiation, Climate Protection Partnerships Division; November 2007.
1See http://www.ted.com for Hans Rosling’s presentation titled “The magic washing machine.”
2See http://www.openpv.nrel.gov
3See Reuters, May 2012.
5See James Bonbright’s classic reference “Principles of Public Utility Rates.”